


Article Figures & Data
Figures
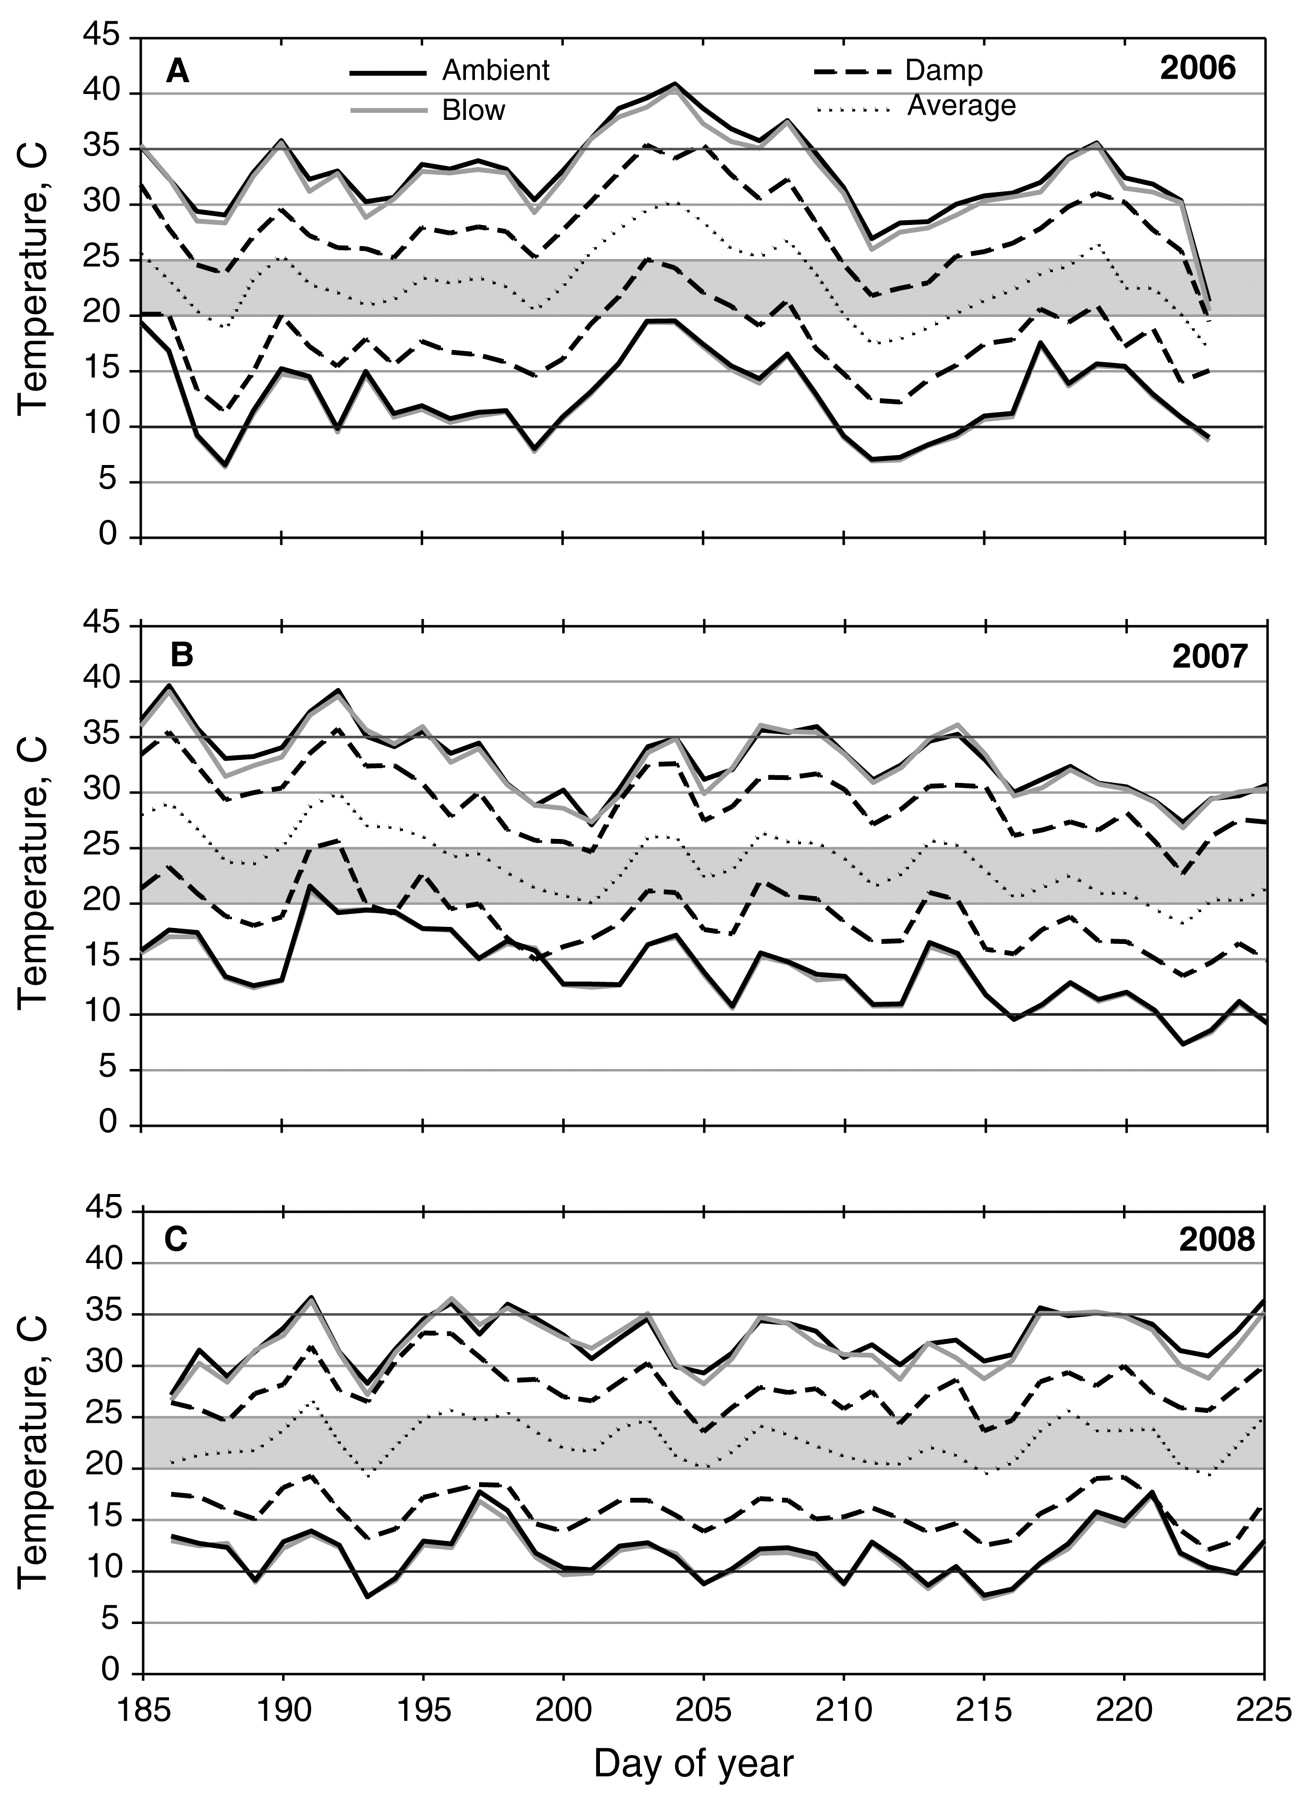
- Figure 1
Exemplary data (n = 4) showing average daily maximum (three upper traces), ambient daily mean (center trace), and average daily minimum (three lower traces) temperatures during Period I in 2006 (A), 2007 (B), and 2008 (C), and with theoretical minimum (10°C), maximum (35°C), and optimum (20–25°C) temperatures for berry metabolism indicated.

Tables
- Table 1
Treatment duration (days), thermal time summaries (DD), average diurnal temperature range (DTR), and number of hours above indicated temperatures during each experimental period.

- Table 2
Berry mass, skin mass per berry, soluble solids, and percent berry coloration at veraison (Period I) and harvest (Period II).
- Table 3
Total proanthocyanidin (PA) content, mean degree of polymerization (mDP), and subunit composition (mole percentage) as a portion of total in seed PA at veraison (Period I) and harvest (Period II).
- Table 4
Total proanthocyanidin (PA) content, mean degree of polymerization (mDP), and subunit compositions (mole percentage) as a portion of total terminal and extension units in skin PAs at veraison (Period I) and harvest (Period II).
- Table 5
Total anthocyanin content and composition (mass percent) of skins at harvest.
- Table 6
Total flavonol content and composition (mass percent) of skins at veraison (Period I) and harvest (Period II).


Vol 63 Issue 1


Jump to section
Related Articles
Cited By...
More from this TOC section
Similar Articles
