


Abstract
The relationships among grapevine (Vitis vinifera) vigor variation and resulting fruit composition, fruit chemical analyses, wine chemical analyses, and sensory attributes were investigated. The study was conducted in a commercial vineyard consisting of the same clone, rootstock, age, and vineyard management practices. In 2003, vine vigor parameters were used to designate vigor zones within two vineyard sites to produce research wines. Similar winemaking practices were used. Descriptive sensory analysis and partial least squares (PLS) modeling was done on two-year-old wines. Wines and model extracts were analyzed by HPLC. Significant sensory attributes included earthy, chemical, heat, sweet, sour, bitter, and astringent. Astringency was the most important attribute used to differentiate the wines. Low vigor wines had much higher astringency than high vigor wines. Positively correlated variables included number of seeds per berry, fruit total tannin (mg/kg), and skin tannin (mg/kg), while total flavan-3-ol monomers per seed, total flavan-3-ol monomers per berry, fruit TA, and berry weight were negatively correlated with the sensory attributes. Interestingly, seed tannin was not an important variable in the model. There was a strong relationship between fruit total tannin and wine astringency, which was related to differences in skin rather than seed-derived tannin. There was a strong relationship between measured and predicted astringency.
Red wine astringency and bitterness are provided primarily by monomeric and polymeric flavan-3-ols (Noble 1994). Astringency is an important sensory attribute of wine quality. Polymeric flavan-3-ols or tannins (proanthocyanidins) are also important in wine because of their roles in the formation of pigmented polymers, long-term color stability (Somers 1971), and human health (Santos-Buelga and Scalbert 2000, Dixon et al. 2005).
The numerous chemical compounds in wine (Rapp 1990), the interactions of chemical compounds in wine (Lesschaeve and Noble 2005), and the complex nature of the human response to gustation (Thorngate 1997) have led to an interest in understanding the relationship between the chemical analyses of a wine and the perception of taste. In addition, there is interest in understanding how various vineyard factors influence fruit composition and sensory characteristics of the resulting wine. Astringency in particular has been difficult to study because of its long persistence and carryover effects in sensory studies (Valentová et al. 2002, Colonna et al. 2004).
Astringency is a tactile sensation that can be described sensorially as mouth drying and puckering. Tannins are defined as having the ability to precipitate proteins. In the case of wine, tannins precipitate salivary proteins. While monomeric flavan-3-ols are primarily bitter, as molecular weight increases with polymerization, astringency becomes predominate over bitterness (Noble 1994, Peleg et al. 1999). Consequently, large polymeric tannins from skins and seeds are the major contributors to wine astringency.
There are differences in grape skin and seed tannin composition and these are thought to have different astringent qualities in wine. Skin differs from seed tannin in having a higher mean degree of polymerization (mDP), the trihydroxylated flavan-3-ol (−)-epigallocatechin, and lower galloylation. Typical mDP for Pinot noir seeds ranges from 6 to 9 while skins range from 27 to 42 flavan-3-ol units (Pastor del Rio and Kennedy 2006). Studies have shown there are also differences in sensory properties related to the identity of the monomeric unit, specific linkages, degree of galloylation, and formation of derivatives (Peleg et al. 1999, Vidal et al. 2004b, Lesschaeve and Noble 2005).
Other taste factors modify the intensity of astringency through enhancement or suppression. Increasing the ethanol content increased the intensity of bitterness but had no effect on astringency (Fischer et al. 1994). Lowering the pH of wines increased the sourness (Fischer and Noble 1994), while adding acid increased the astringency of wines (Kallithraka et al. 1997). Increasing sweetness or viscosity has been reported to decrease bitterness in vermouth. In wine, the addition of sucrose (Ishikawa and Noble 1995) and increasing the viscosity with carboxymethylcellulose reduced the astringency (Smith et al. 1996). Consequently, the mouthfeel of wine can be modified by a number of compounds and interactions.
In addition, sensory studies have investigated the effect of vintage (Boselli et al. 2004), growing region (Heymann and Noble 1987, Boselli et al. 2004, Kallithraka et al. 2001), grape cultivar (Boselli et al. 2004), and various viticultural practices (Reynolds et al. 1996) on the relationship between wine chemical profile and sensory characterization. Principal component analysis (PCA) has been used to determine relevant biological parameters for fruit and wine (Kallithraka et al. 2001), and partial least squares (PLS) regression analysis has been used to evaluate the ability to predict a response (Frank and Kowalski 1984).
Although there have been studies comparing growing regions, there have been few studies on site environment or vine vigor variation within vineyards and the influence on the resulting fruit and wine. In premium winegrowing regions, fruit from specific vineyard sites often sell for a higher price, as they are perceived to be of higher quality and are used for top-tier wines. In the present study, vigor zones were delineated into two vineyard sites to investigate differences in fruit and wine chemical analyses (Cortell et al. 2005). Although the two vineyard sites had vines that were the same age, rootstock, clone, and under similar management practices, the fruit was used for wines with distinctly different price points. The objective of this study was to compare sensory perception to biological and chemical analyses of the fruit and wine with an emphasis on astringency. A second objective was to evaluate the ability to predict astringency based on chemical analyses.
Materials and Methods
Vineyard.
This study was conducted in a commercial vineyard in the Willamette Valley, Oregon. Two vineyard sites (A and B) were selected for the investigation based upon historic evidence of phenolic variation. The vine vigor zones were based on average shoot length, estimated leaf chlorophyll content (SPAD-502 meter, Konica Minolta, Windsor, CT), and cross-sectional trunk area, as previously described (Cortell et al. 2005). The vigor index was used to delineate three zones of relative vigor in each site for fruit and wine analysis. Fruit sampling, fruit extraction, and winemaking were previously described (Cortell et al. 2005). Phenolic analysis of fruit and wines by high-performance liquid chromatography (HPLC) included flavan-3-ol monomer analysis (Lamuela-Raventos and Waterhouse 1994), tannin analysis by phloroglucinolysis (Kennedy and Jones 2001, Kennedy and Taylor 2003), and gel permeation chromatography (Kennedy and Taylor 2003). Individual skin and seed tannin extraction into wines was determined according to Peyrot des Gachons and Kennedy (2003). Although the fruit and wine data has been previously presented and discussed, a summary of the data to describe vine vigor, yield, and fruit composition (Table 1⇓), fruit monomers and proanthocyanidins (tannins) (Table 2⇓), and wine chemical analyses (Table 3⇓) has been included (Cortell et al. 2005).
Mean and SEM of vigor zone ratings and vine vigor zone fruit composition.
Mean and SEM of fruit chemical analyses from the vine vigor zones.
Mean and SEM of wine chemical analyses from the vine vigor zones.
Wine sensory evaluation.
The bottled wines were stored horizontally at room temperature for four weeks during the sensory descriptive data collection period. The 15 samples are listed in Table 4⇓. The wines were served at room temperature (~20°C) and poured about 30 min before evaluation. The B-high (high vigor zone) wine was not analyzed in the sensory panel because one rep was missing because of previous use. B-high was similar to A-low and B-medium in vine vigor with a vigor rating of 0.49. Consequently, it was anticipated the wine sensory of B-high would be similar to A-low or B-medium.
Wines, vineyard site, vigor zone, replicate, and codes used in the sensory experiment.
Sensory panelists.
Nine volunteer panelists participated in the study, all students, mainly from the Department of Viticulture and Enology, University of California, Davis. The panelists were experienced wine tasters and all but three had previously participated in wine sensory descriptive analyses.
Sensory training.
Six training sessions were run. During the first two sessions the panelists tasted all samples included in this study to become familiar with the wines and to create a list of attributes that would describe the variability among them. This list was changed until all panelists agreed on a final list of attributes and on their definitions (Table 5⇓). References were created to help the panelists understand how to define and rate each attribute. The references were used during training sessions and during real evaluation sessions. The list of attributes was used to evaluate each wine quantitatively on an unstructured scale. The panelists were trained to rate the attributes in the samples relative to the rest of the samples of wines in the study.
Sensory attributes, their definitions, and respective standards. All standards were added to 30 mL of the base wine: 2005 Cabernet Sauvignon.
Sensory evaluation sessions.
Samples were evaluated in individual sensory booths under red light. The 15 samples were served in three replicates. In each of nine sessions, seven or eight samples were evaluated in a completely randomized order. Panelists rated the samples based on the list of attributes on an unstructured scale by marking the scale on a computer with a cursor (mouse). Because of the potential astringency of the samples, panelists were instructed to rinse with water extensively and thoroughly between samples. A 30-sec rest between each sample was included as part of the computerized evaluation session. All seven or eight samples were evaluated monadically, without other breaks than the compulsory 30 seconds. Data were collected using FIZZ for Windows (version 2.00 E; Biosystems, Couternon, France).
Statistical analyses.
Statistical analysis of the fruit and wine chemical data was performed using analysis of variance (ANOVA) and the least significant difference (LSD) test to determine statistically different values at a significance level of α ≤ 0.05. For vine growth, data vines within vigor zones were treated as independent samples. Sensory data were exported from the FIZZ data collection program into an Excel spreadsheet. A fixed-model analysis of variance (ANOVA) was performed for each attribute. In cases where the wine judge interaction terms were significant, a pseudomixed model using the judge*wines interaction as the error term was used. For attributes significantly discriminating among samples, LSD values were calculated to conduct mean separations of the vigor zones. Principal component analyses (PCA), using a correlation matrix, were performed on the wine sensory data using the means for the five vigor zones and the three replications per zone (15 wines) and a cutoff of 75% variance explained. Additionally, a PCA using a correlation matrix was performed on the wine sensory data and the fruit chemical data using the means for the five vigor zones and the three replications per zone (15 wines) and a cutoff of 75% variance explained. For clarity, all PCA biplots were plotted with the mean vine vigor zone scores. A stepwise regression was conducted in order to assess the importance of both vineyard site and vine vigor in explaining differences in wine sensory attributes. PLS1 regression was performed using Unscrambler (Camo, Woodbridge, NJ) to relate the perceived astringency to the chemical fruit data. Full-cross validation was used. All other statistical analyses were performed using SAS version 8e (SAS Institute, Cary, NC).
Results
Sensory analysis.
ANOVA results for the significant sensory attributes are shown in Table 6⇓. The mean intensities of significant sensory attributes for the vigor zone wines are presented in Table 7⇓. Other sensory attributes assessed in the wines included fresh fruit, processed fruit, green and spicy; however, they were not included as they were not found to be significant. The greatest sensory differences among wines were found in astringency followed by bitterness and sourness.
Three-way fixed model analyses of variance for all significant sensory attributes. F-values and significance (* indicates p < 0.05); for the error row the values listed are mean square error values.
Mean and SEM of wine sensory attribute intensities from vigor zones included in the sensory study.
The wines from the low vigor zones (A-low and B-low) had a higher intensity of earthy and chemical attributes than in wines from zones with higher vigor. There was a trend for higher heat or ethanol intensity in medium and low vigor zone wines compared with the A-high wine. This is in agreement with the initial Brix levels found in the fruit (Table 3⇑) where A-high was lower than the other zones, although Brix did not have a significant correlation with heat. The detection of sweetness was higher in the A-medium and B-low wines compared with the other wines. There was a higher intensity of sour taste in wines from B-low compared with A-high vigor zones. The intensity of bitterness was perceived as higher in wines from the low and medium vigor zones compared with A-high. The intensity of astringency increased in wines going from high vigor to low vigor zones. A-low and B-medium were similar in intensity.
The wine sensory PCA shows that the first two PCs explained 80.6% of the variance in the sensory data (Figure 1⇓). From left to right, PC1 is a high to low vigor axis and PC2 seems to differentiate the more bitter and astringent wines from the more sweet and chemical wines.
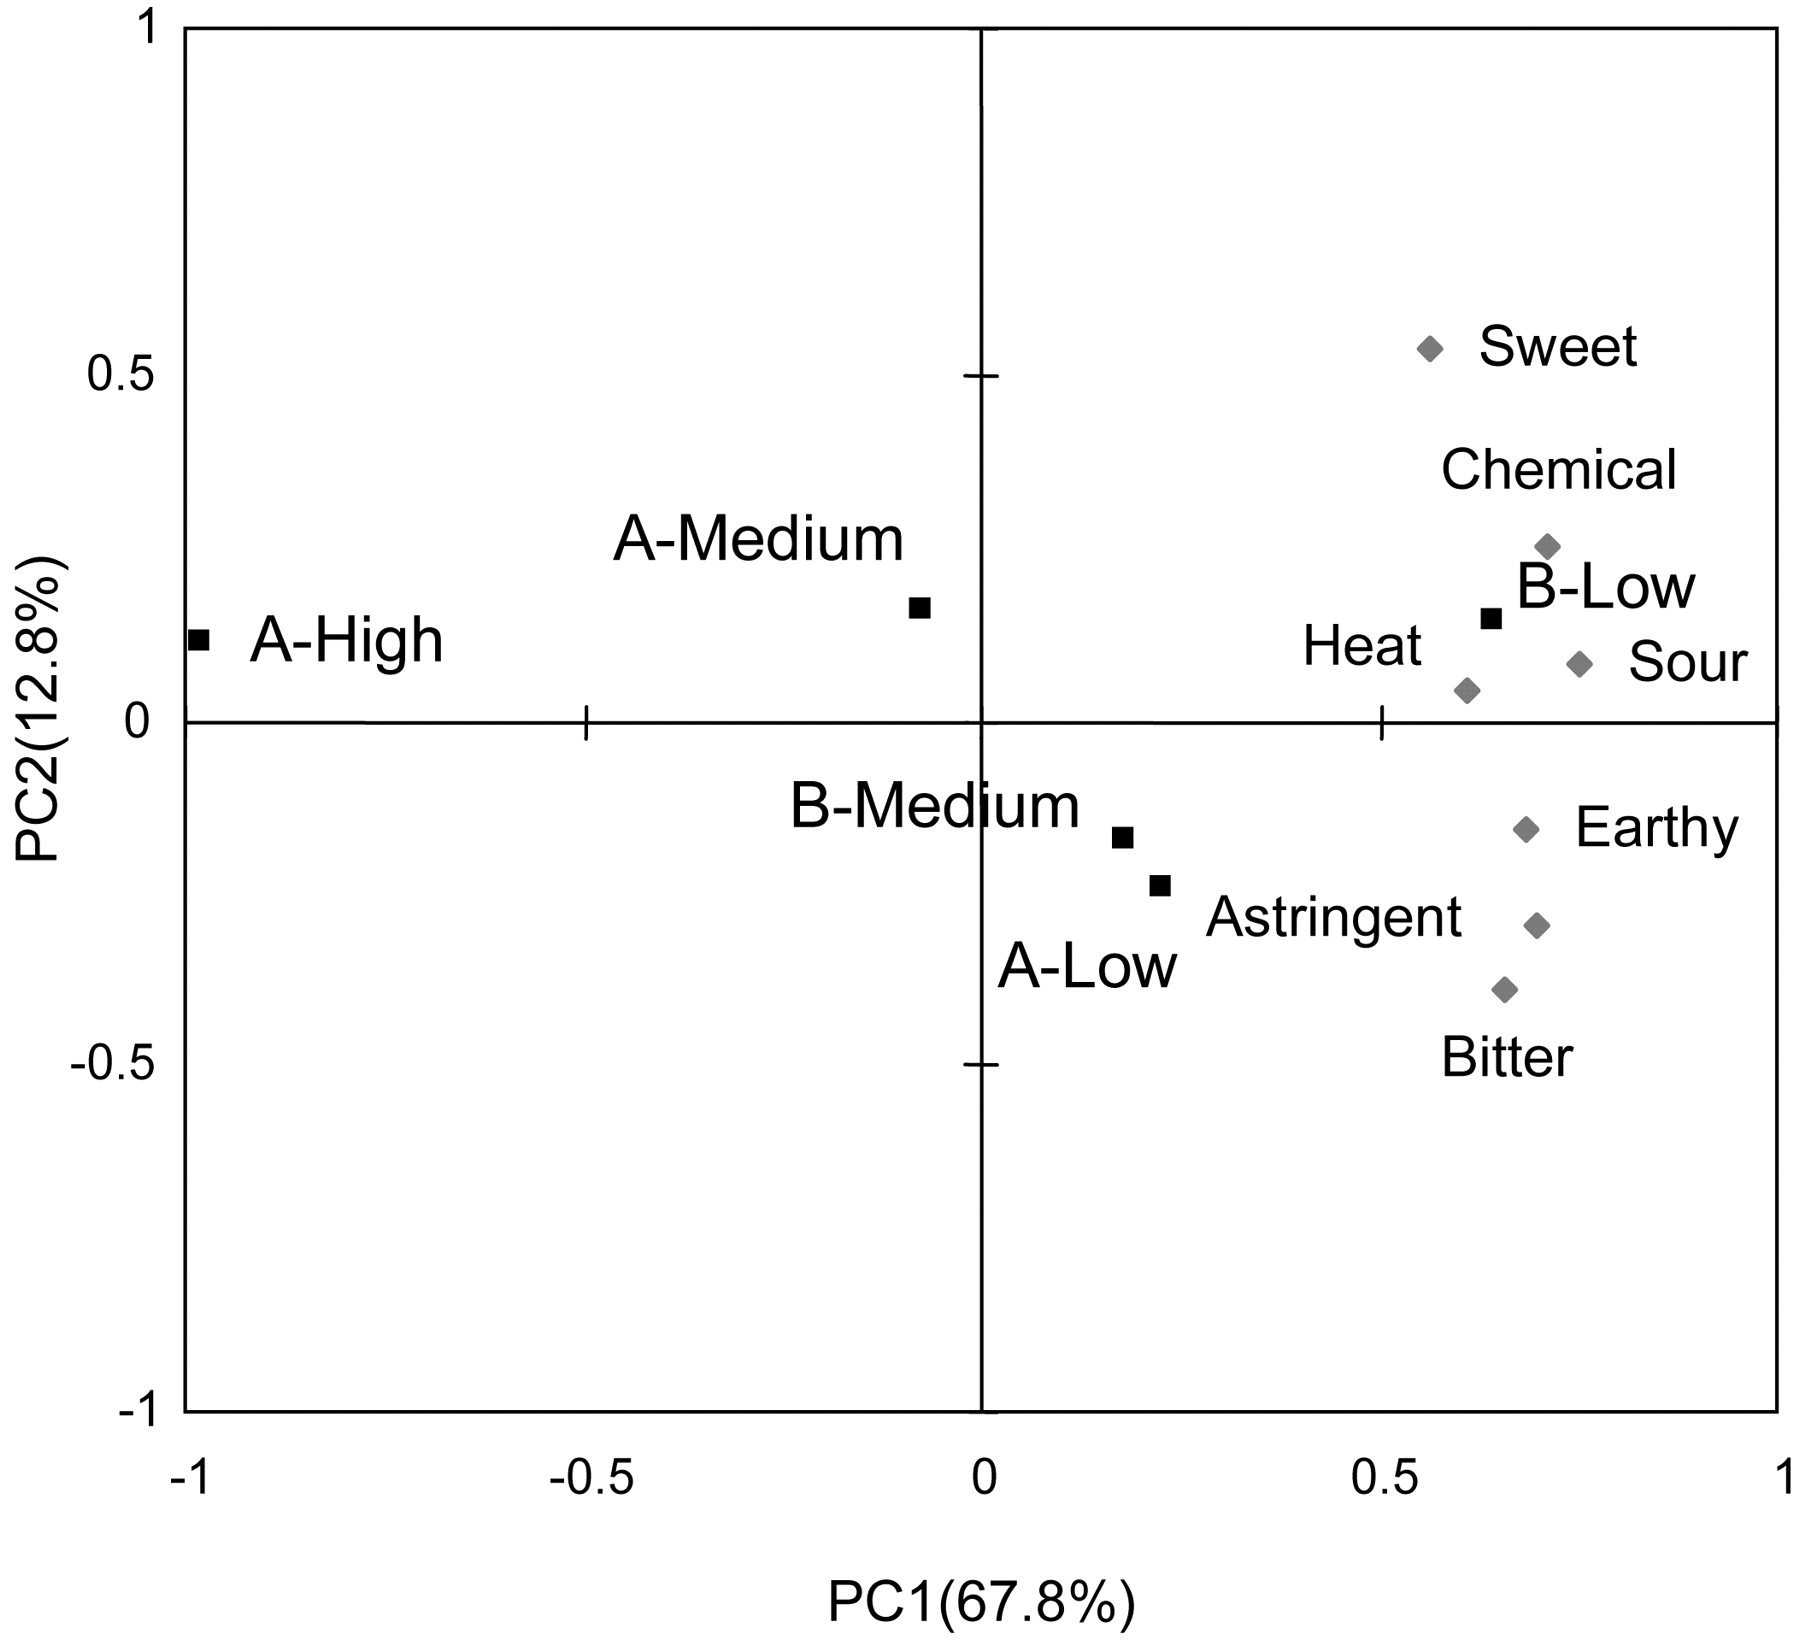
Principal component analysis (PCA) biplot for wines from different vigor zones and significant sensory attributes. PCA space was calculated on 15 wines, but for clarity the mean scores for each wine were plotted.
Relationships among vineyard, fruit, wine, and sensory data.
Differences in vine vigor, fruit composition and wine chemistry (Tables 1⇑, 2⇑, 3⇑) were previously described (Cortell et al. 2005). A stepwise regression was performed in order to assess the importance of both vineyard site and vine vigor in explaining differences in wine sensory attributes. Vineyard site was not significant for any of the sensory attributes. Vine vigor was significant for astringency (partial r2 = 0.95, p = <0.0001), sour (partial r2 = 0.48, p = 0.0044), chemical (partial r2 = 0.47, p = 0.0048), bitter (partial r2 = 0.43, p = 0.0082), earthy (partial r2 = 0.33, p = 0.0259), and sweet (partial r2 = 0.27, p = 0.0473). Vigor was not significant in explaining differences in perception of heat.
In order to investigate the relationships between fruit, wine, and sensory attributes, Pearson correlations and a PCA of wine and fruit chemical and sensory data (Figure 2⇓) were calculated. There were significant positive correlations between skin tannin (mg/kg) and wine tannin (mg/L) (r2 = 0.784, p = 0.0001), pigmented polymers (mg/L) (r2 = 0.827, p = <0.0001), and percent skin tannin (r2 = 0.693, p = 0.0014). Fruit monomers originating from seeds were also correlated with wine tannin (mg/L) (r2 = 0.653, p = 0.0033), pigmented polymers (mg/L) (r2 = 0.650, p =0.0035), and percent skin tannin (r2 = 0.554, p = 0.0171). These were the most important relationships noted between the fruit and wine.
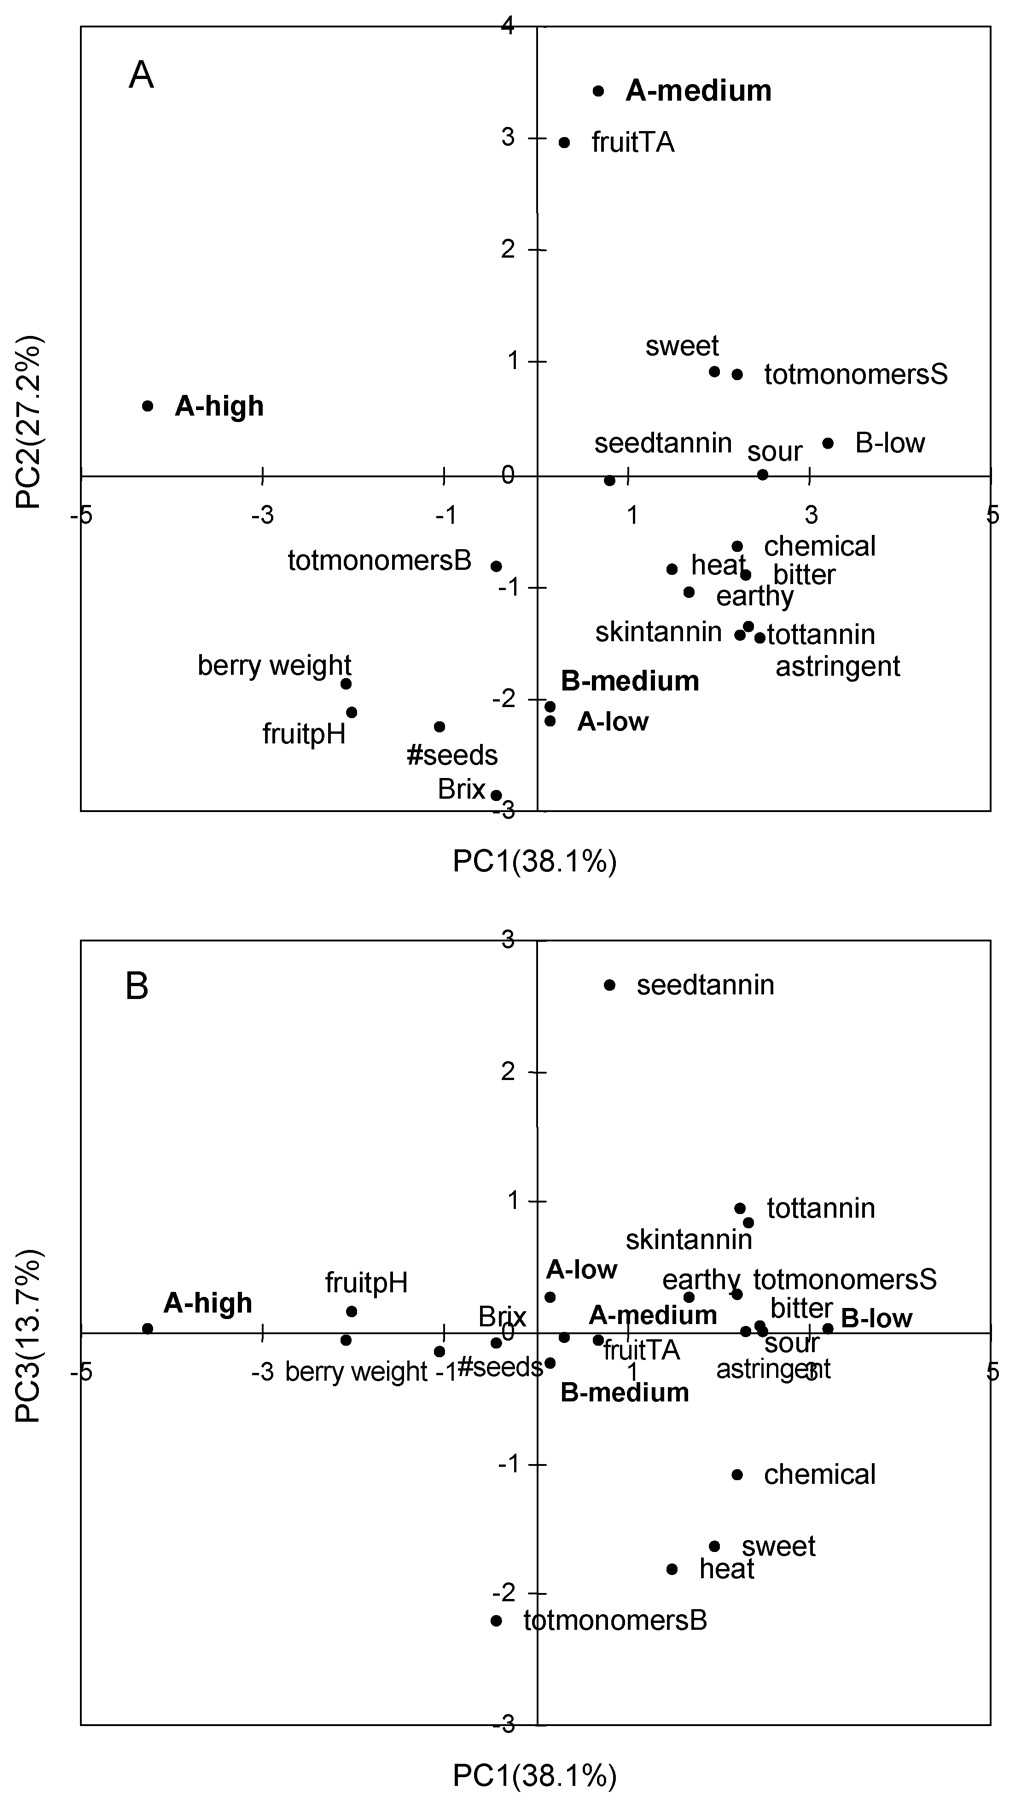
Principal component analysis (PCA) biplot for wines from different vigor zones with fruit chemical and physical data and significant sensory attributes. PCA space was calculated on 15 wines, but for clarity the mean scores for each wine were plotted. (A) PC1 and PC2; (B) PC1 and PC3.
In the fruit, there were positive correlations between skin tannin (mg/kg) and earthy, sour, bitter, and astringent sensory attributes (Figure 2⇑). Berry weight and pH were negatively correlated with both the sweet and sour attributes. Sourness did not appear to be related to fruit titratable acidity (TA) (Figure 2A⇑), but it is related in the third dimension (Figure 2B⇑). There was a negative relationship between sourness and fruit pH. Other fruit variables, including soluble solids (Brix), number of seeds, and seed tannin (mg/kg), were not related to the sensory attributes. While seed tannin is an important contributor to astringency in wine, there were not treatment differences in this study, and hence no significant correlations with sensory attributes.
In the wine, wine tannin (mg/L) and pigmented polymers (mg/L) were positively correlated with the earthy, chemical, sour, bitter, and astringent sensory attributes. Percent skin tannin had a positive correlation with all sensory attributes except for sweet. Wine monomers (mg/ L) were negatively correlated with the earthy, chemical, and sour attributes. pH was negatively correlated with all sensory attributes except for sweet.
PLS predictions of perceived astringency by fruit chemical variables.
As astringency was the most important wine sensory attribute, the correlation loadings plot of the PLS1 model showed the correlation of the fruit variables (X matrix) with the sensory attribute astringency (Y matrix) (Figure 3⇓). The cumulative Q2 quality index for the model was 0.770 for dimension 1 and 0.712 for dimension 2. Additionally the model had a goodness of fit R2 of 0.927 (df = 12), a standard deviation of 0.432, and a MSE of 0.149. The number of seeds per berry, fruit total tannin (mg/kg), and skin tannin (mg/kg) were again positively correlated with astringency, while berry weight, fruit TA, and total monomers (mg/kg) were negatively correlated with astringency. Fruit total tannin (mg/kg) was strongly correlated with the sensory attribute astringency in the wines (Figure 4⇓).

PLS1 correlation loadings of the relationship between fruit characteristics (X matrix) and perceived wine astringency (Y matrix). Dimension 1(horizontal) explained 95% of fruit characteristics and 80% of perceived wine astringency, while dimension 2 (vertical) explained 5% and 1%, respectively. Model goodness of fit R2 = 0.927. Cumulative Q2 quality indices for dimensions 1 and 2 were 0.770 and 0.712, respectively.

Univariate linear regression relationship between fruit total tannin (mg/kg) and perceived wine astringency in vigor zone wines (type I error = 5%).
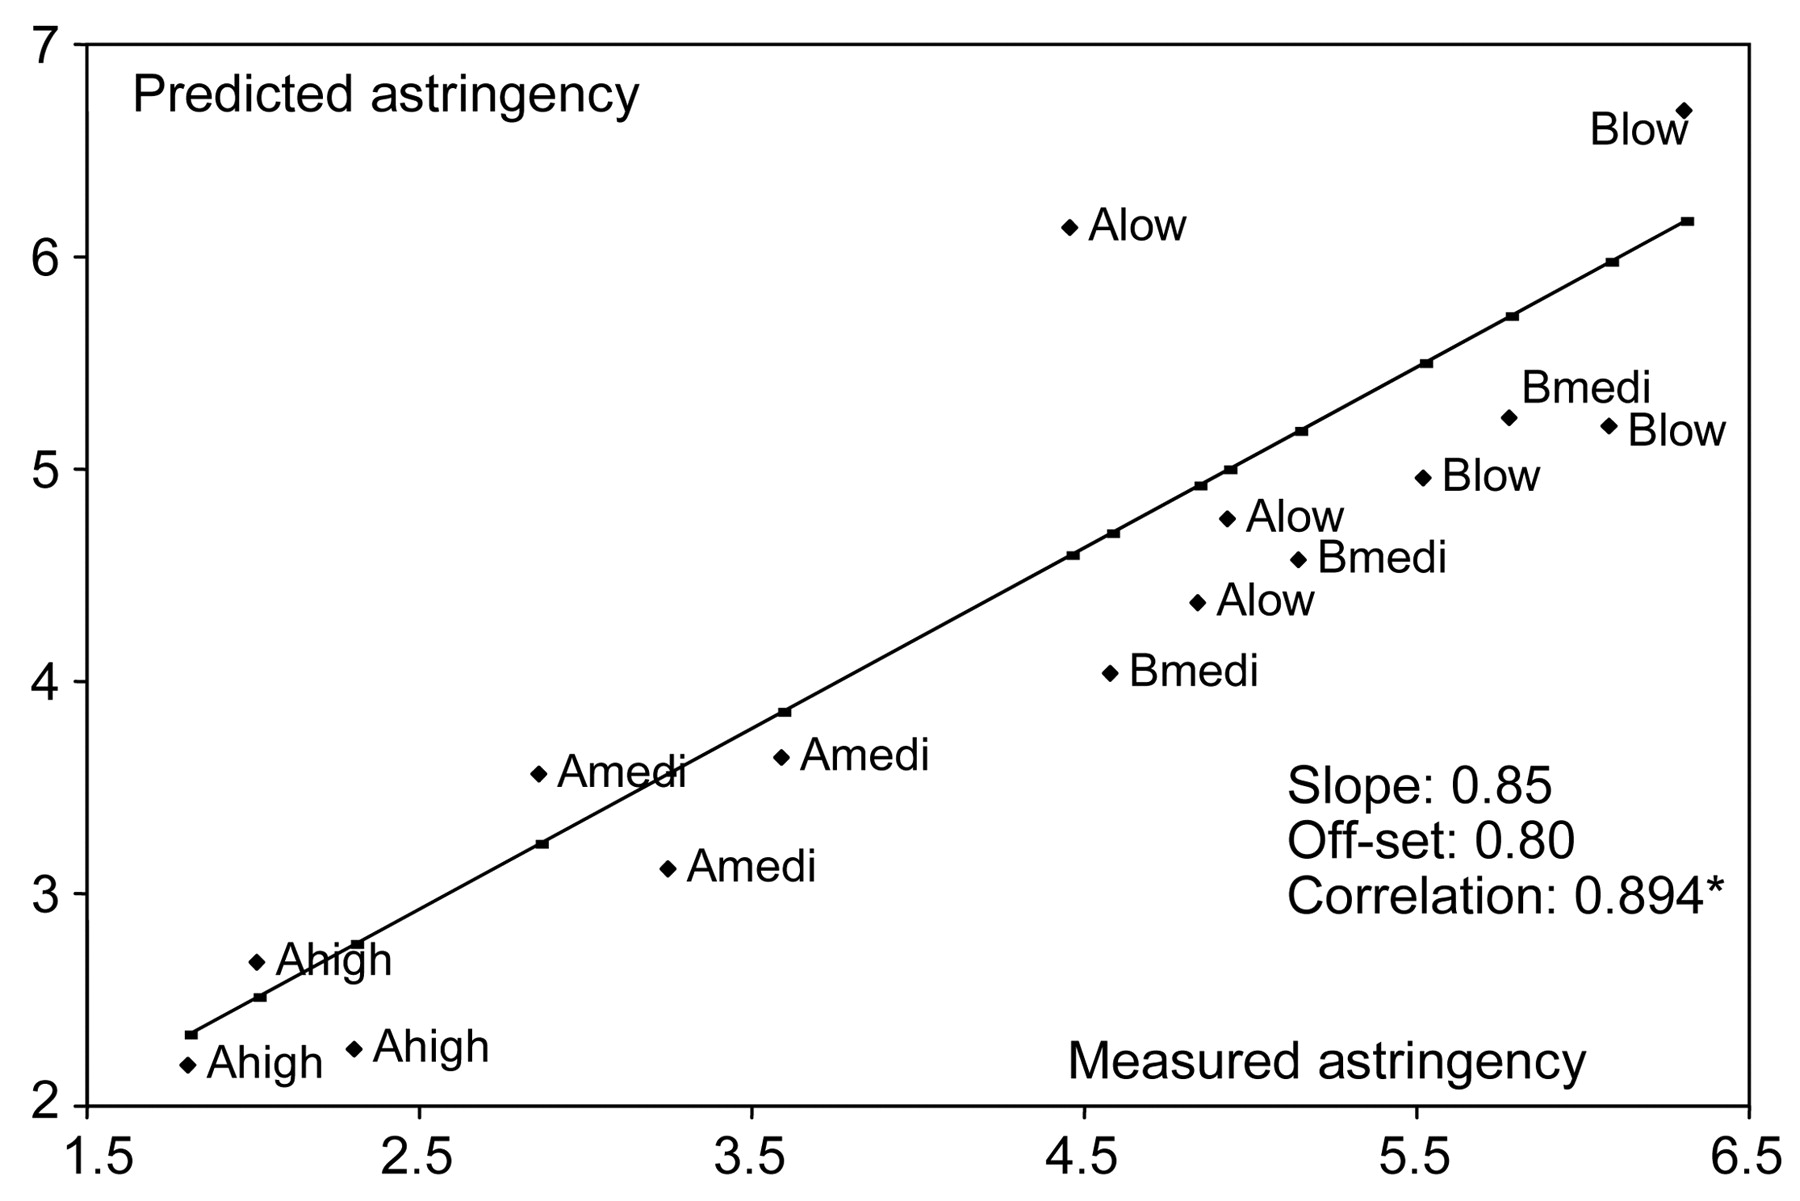
PLS1 was used to predict astringency in wine based on fruit variables important in measuring astringency (Figure 5⇓). The fruit variables included in the PLS1 regression analysis were number of seeds per berry, total berry monomers (mg/kg), skin tannin (mg/kg), berry weight, seed tannin (mg/kg), and total tannin (mg/kg). In this set of wines, there was a strong correlation (0.894) between measured astringency and predicted astringency. Astringency was the most important attribute that explained differences in wines made from vigor zones within the two vineyard sites.

PLS1 prediction of wine astringency based on fruit parameters including number of seeds, berry monomers, skin tannin, berry weight, seed tannin, and total tannin. Model goodness of fit R2 = 0.927. Cumulative Q2 quality indices for dimensions 1 and 2 were 0.770 and 0.712, respectively.
Discussion
The higher intensity of sensory attributes of earthy and chemical in the low vigor zone wines (Table 7⇑) was correlated with higher tannin and pigmented polymer concentrations, but it may have also been in response to other differences among the wines (Pripis-Nicolau et al. 2004). The higher sweet intensity in the low vigor wines may have been from reducing sugars or glycerol (Ough and Amerine 1988), although chemical analyses were not performed in this experiment for verification. Glycerol production was reported to be higher in stressed fermentations involving yeast osmotic stress (Alexandre and Charpentier 1998). Both sugars and polysaccharides that increase sweetness or viscosity were reported to reduce astringency (Ishikawa and Noble 1995, Smith et al. 1996). In this case, the low vigor wines also had higher astringency; however, the astringency was likely modified by the sweet sensory attribute.
Sourness in wine is primarily from tartaric acid with some contribution from malic and lactic acids when present (Ough and Amerine 1988). A sour taste in wine can be increased by increasing the TA, either lowering the pH or by adding acid (Fischer and Noble 1994, Kallithraka et al. 1997). As anticipated, sour intensity (Table 7⇑) was lowest in the A-high wine, which had the lowest TA and the highest pH (Table 3⇑). The B-low vigor zone wines had the highest intensity of sour taste with an intermediate TA and the lowest pH. While A-low and B-low had similar fruit TA, B-low was higher in sourness than A-low. The higher intensity of sourness was likely due to difficulties in getting the B-medium and B-low vigor zone wines to complete malolactic fermentation and also the lower pH found in B-low. The B-medium and B-low vigor zones had low nitrogen concentrations and other nutrients that contributed to incomplete malolactic fermentation (Table 1⇑), which may help explain why there were differences between treatments for TA and pH in the fruit compared with the wine. However, the pH of both fruit and wine was negatively correlated with sourness (r2 = −0.53, p = 0.04; r2 = −0.69, p = 0.003, respectively), while TA was not correlated, which agrees with a lower pH contributing to a higher perception of sourness.
In assessing interactions between acidity and astringency, a previous study found no differences between lactic or malic acid on the perception of astringency (Kallithraka et al. 1997); however, higher acidity increased the astringency of grape phenolic compounds (Peleg et al. 1998). In addition, the total duration of astringency increased with a reduction in pH (Kallithraka et al. 1997). In a PCA, wine astringency and fruit pH was negatively correlated, while fruit TA was positively related to astringency in the third dimension, suggesting that the lower pH in B-low could have accentuated the sensation of astringency but the differences in organic acids did not appear to be important.
Bitter taste is elicited by many structurally diverse compounds and the mechanisms for the perception of bitterness are poorly understood (Thorngate 1997). Flavan-3-ol monomers have been reported to be bitter in several studies (Arnold et al. 1980, Noble 1994). In addition, (−)-epicatechin was significantly more bitter and had a longer duration of bitterness compared with (+)-catechin (Noble 1994, Thorngate and Noble 1995, Kallithraka et al. 1997). In this study, the A-high wines were higher in total monomers and also had a higher proportion of (−)-epicatechin to (+)-catechin compared with the medium and low vigor wines (Table 3⇑), but were perceived to have lower bitterness. These findings do do not agree with previous studies.
The higher perception of bitterness in the medium and low vigor zones may have been due to the substantially higher astringency or interactions with other components in the wine. The Pearson correlation between bitterness and wine components found that wine tannin had the highest positive correlation with bitterness (r2 = −0.65, p = 0.0089), while pigmented polymers and percent skin tannin were also significantly correlated. Total monomers in wine were negatively correlated with bitterness. While large polymeric tannins are thought to be primarily astringent, they also contribute bitterness to wine (Robichaud and Noble 1990). Another possibility is that the monomers were incorporated into other compounds during the time between chemical and sensory analyses.
Enhancement of bitterness with an increase in ethanol levels was reported in wine (Fischer et al. 1994). That is worth noting since in this study the fruit from the low vigor zones had somewhat higher soluble solids at harvest (Table 1⇑), which resulted in higher alcohol in the wines. The lower vigor wines had a trend toward higher heat, which could accentuate the sensation of bitterness.
Astringency in wine is primarily from large molecular weight tannins (Robichaud and Noble 1990, Noble 1994). Astringency increases with increasing tannin polymerization (Arnold et al. 1980); however, variations in tannin composition, the extent of galloylation, and formation of derivatives can affect both bitterness and astringency (Lesschaeve and Noble 2005).
In wines, tannin comes from both seed and skin material. Skin tannin has greater polymerization than seed tannin (Labarbe et al. 1999). In the present study, total tannin concentration was about twice as high in B-low compared with the A-high vigor zone wines; however, the increase was from higher skin tannin rather than seed tannin (Cortell et al. 2005). There was a corresponding increase in tannin molecular size in the low vigor wines associated with the increase in skin tannin. In addition, skin tannin contains (−)-epigallocatechin, which has a tri-hydroxylated B-ring flavanol subunit. The higher number of hydroxyl groups could modify the perception of astringency. Consequently, the concentration, composition, and mean degree of polymerization of tannins are important in the intensity of astringency.
In the present study, fruit total tannin (tottannin, skin + seed) and skin tannin (mg/kg) were strongly related to astringency in the wine (Figure 2⇑, Figure 4⇑). Although seed tannin is an important contributor to astringency, in this study seed tannin concentration was similar among all vigor zones in the fruit and wines. Skin tannin in the fruit was important in differentiating the wines as there was higher skin tannin concentration (mg/kg) in the low vigor fruit compared with the high vigor fruit (Table 2⇑). The low vigor zone wines also had a much higher concentration of total tannin (mg/kg) and a higher proportion of skin tannin than the high vigor wines (Table 3⇑). The B-low wine was ~20% seed tannin and the A-high wine was ~50%. It could be expected that astringency would be higher in the low vigor wines not only because of the higher concentration of tannin but also because of the higher proportion of skin tannin, which likely have a higher average degree of polymerization than extracted seed tannin. Although skin tannin is thought to have a preferred mouthfeel in wines (Cheynier et al. 1998), few studies have characterized the differences between skin and seed tannin astringency perception at the concentration, composition, and average degree of polymerization found in wine.
The other major difference between high and low vigor zone wines was that the latter had much greater formation of pigmented polymers (Table 3⇑). Few sensory studies have been performed specifically on the contribution of pigmented polymers to wine astringency. Although pigmented polymers can include a wide diversity of derived compounds, they are thought to be primarily tannin-anthocyanin adducts. The formation of pigmented polymers was thought to reduce astringency of wine (Somers 1971); however, the taste of reaction products and the effect on astringency of incorporating anthocyanin units into a tannin structure remain to be investigated thoroughly (Cheynier 2005). Several studies have reported a decrease in astringency by modifying tannin structure with an ethyl bridge (Vidal et al. 2004a, del Carmen Llaudy et al. 2006). In another study, the addition of anthocyanins with either skin or seed tannin into white wine caused a significant increase in astringency over either fraction alone, suggesting that pigmented polymers formed in wine do contribute to astringency intensity (Brossaud et al. 2001). However, in another study, isolated pigmented polymers were less astringent than unpigmented tannins, suggesting that modifying tannin structure with anthocyanins attenuates astringency (Vidal et al. 2004b). In the present study, although pigmented polymer concentration was highly correlated with astringency (r = 0.965), overall tannin concentration was highly correlated with astringency (r = 0.906); thus, it is not possible to draw conclusions about the influence of pigment polymer content on astringency.
In this study, it was possible to predict astringency based on measured fruit chemical analyses (Figure 5⇑). Fruit variables included number of seeds per berry, berry weight, berry flavan-3-ol monomer concentration (mg/kg), and skin, seed, and total tannin concentrations (mg/kg). The importance of skin and seed tannins in astringency perception has already been discussed. Berry flavan-3-ol monomers can contribute to astringency, although they are considered primarily bitter (Thorngate and Noble 1995).
Extraction of tannin from seeds is generally quite low, although seeds contain a large amount of flavan-3-ol monomers and tannin (Sun et al. 1999). The number of seeds per berry is more important in extraction than the amount of tannin per seed because of the increased surface area for extraction (Harbertson et al. 2002). In this study, fruit from low vigor zones had a higher number of seeds per berry than in the high vigor zone (Table 3⇑). Since berry weight decreased with decreasing vine vigor, it was negatively correlated with astringency (Figure 2B⇑). An increase in berry weight has been previously reported in shaded fruit (Reynolds et al 1986, Crippen and Morrison 1986) and higher shade would also be expected in high vigor vines, as was found in this experiment. The ratio of seed, skin, and pulp in berries is thought to influence the extraction and concentration of phenolic compounds in wine (Coombe et al. 1987, Matthews and Anderson 1988). However, a recent study showed that berry size alone did not have a major impact on the concentration of phenolic compounds (Walker et al. 2005). In this experiment, the concentration of skin tannin in the fruit was the most important contributor to treatment differences in the wine astringency.
Conclusions
It is difficult to understand relationships between fruit composition, fruit and wine chemical analyses, and sensory perception because of the complexity of wine, number of reactions occurring in wine, interactions among compounds in wine, and variability in human perception. In this experiment, differences in fruit and wine chemical analyses played an important role in sensory perception, particularly for astringency in wines from high, medium, and low vigor zones. In a following experiment where artificial shading was applied, results suggested many of the differences related to vine vigor were due to differences in light exposure in the fruiting zone (Cortell and Kennedy 2006).
The low vigor zone wines were differentiated primarily by differences in astringency in addition to the attributes of earthy, chemical, heat, sweet, sour, and bitter. The fruit and wine chemical attributes that were significantly correlated with the sensory attributes included skin tannin concentration, total fruit tannin concentration, wine skin tannin proportion, total wine tannin, pigmented polymer, and wine monomer concentrations. The measurable differences in the fruit and wine, for example, in skin tannin and pigmented polymer concentrations, may have been contributing factors for the fruit targeted for different wine price levels. Improving our understanding of the vine-fruit-wine continuum is important in being able to make decisions in the vineyard and winemaking techniques to achieve a desired wine style.
Footnotes
Acknowledgments: The authors thank the Northwest Center for Small Fruit Research and the American Society of Enology and Viticulture for financial support.
The authors also thank Archery Summit Winery for student support.
- Received January 2007.
- Revision received August 2007.
- Copyright © 2008 by the American Society for Enology and Viticulture
Literature Cited
Vol 59 Issue 1


Jump to section
Related Articles
Cited By...
More from this TOC section
Similar Articles
