


Abstract
Shiraz berries commonly lose weight during the later part of ripening and loss of vascular flows into the berry may be a contributing factor. Changes in flow through the vascular streams were assessed by monitoring the accumulation of potassium and calcium in berries at the preveraison, postveraison, and shrinkage stages of development. Potassium, a predominantly phloem-mobile element, accumulated most strongly postveraison and less strongly during the shrinkage phase. Calcium, a xylem-mobile element, accumulated strongly before veraison, but after veraison accumulation patterns were variable. Girdling and excision of pedicels to remove phloem before and at the postveraison stage of development resulted in smaller berries but also inhibited the accumulation of sugars, pigments, and potassium, but not calcium, into the berry. With an assumption of ongoing transpiration, late-ripening shrinkage may be attributed to decreased phloem flow into the berry.
The occurrence of shrinkage during late ripening of grape berries has been reported for several varieties, but Vitis vinifera L. cv. Shiraz is particularly prone to this phenomenon. In Shiraz plantings of the south-west slopes, NSW, Australia, shrinkage (also known as shriveling in industry terminology) has occurred in six of the past seven years with yield losses of up to 25% before commercial harvest. Symptoms include loss of berry turgidity and wrinkling of the skin without any apparent exterior physical or pathological damage to the berry surface, the pedicel, or the bunch stem. The absence of such symptoms points to a physiological cause for shrinkage. Since water accounts for some 90% of the weight loss (Rogiers et al. 2000), an examination of berry water transport may provide insights into possible causes.
During fruit development, the vascular tissues contribute to solute and water accumulation. Phloem plays a major role in water transport to fruit such as tomato (Ho et al. 1987), apple (Lang 1990), and citrus (Huang et al. 1992). In the postveraison grape, phloem flow also predominates (Creasy et al. 1993, Greenspan et al. 1994, 1996, Ollat and Gaudillère 1996, Rogiers et al. 2000), and it has been hypothesised that flow is reduced during late stages of berry ripening in Shiraz as weight loss occurs (McCarthy and Coombe 1999). Xylem water also contributes to the growth of the grape berry, particularly before veraison (Düring et al. 1987), but it is unclear at what developmental stage this contribution ceases. Acid fuchsin, a xylem tracer, was shown to accumulate in the brush tissue of the berry shortly after veraison and movement through the peripheral veins was restricted (Rogiers et al. 2001). Assuming that the tracer is an accurate measure of water movement in the xylem, these results imply a cessation of xylem flow beyond the brush region of the postveraison berry, suggesting that xylem water may no longer contribute to berry growth late in development. However, results of a study of potted Shiraz vines suggested that complete cessation of water flow into the berry through the xylem did not occur (Rogiers et al. 2001). For instance, pedicel girdling of postveraison berries, that is, removal of phloem flow, did not result in similar rates of weight loss compared with excision of the berries. In addition, weight loss of girdled postveraison berries from vines grown with standard irrigation was less than those grown with deficit irrigation, indicating that the xylem may still have contributed water to the berry. This contradiction between the tracer and girdling results indicates that further clarification of the roles for the vascular streams into the berry is required to better understand the causes of shrinkage in Shiraz.
Calcium (Ca) has low mobility in the phloem, and its import into fruit is nearly exclusively through the xylem (Raven 1977). Potassium (K) has mobility in the xylem and phloem (Welch 1986); however, K concentrations in the phloem can be 10-fold greater than in the xylem (Hocking 1980). Accumulation of these elements into the berry should give an indication of xylem and phloem functionality. Accordingly, berry K and Ca were quantified over three growing seasons, during development and shrinkage, to gain further understanding of changes in flows through the vascular tissues into the berry. Berry pedicel girdling and excision were also used to manipulate accumulation of these elements.
Materials and Methods
Berry sampling.
Five bunches were harvested at random three times weekly from a plot of 400 own-rooted, 11-year-old, drip-irrigated Vitis vinifera L. cv. Shiraz clone PT23/N/Griffith vines (block A) at the Charles Sturt University Vineyard, Wagga Wagga, NSW, from flowering to harvest in the 2000 to 2001 and 2001 to 2002 seasons. A second plot of 17-year-old Shiraz vines from the same vineyard (block B) was also sampled in the same manner in the 2001 to 2002 and 2002 to 2003 seasons. In both blocks, the vines were grown on a single-wire system, cordon-trained and spur-pruned. The vines were at 1.5 m vine spacing and 3.5 m row spacing. The vines were not crop adjusted, and because of vigorous canopies, bunches were not exposed. Vines in block A had a N-S orientation while vines in block B had an E-W orientation. Climatic data was obtained from a meteorological station located within 1 km of the experimental blocks.
Whole bunches were placed in plastic bags and transferred to the laboratory on ice, where they were frozen and stored at −20°C. Subsequently, berry fresh weight, dry weight, total soluble solids (TSS), and mineral elements were measured.
Berry pedicel girdling and excision.
Berry pedicels of vines from block A were girdled or excised on two separate occasions during the 2000 to 2001 growing season, before and after veraison, to verify the predominant pathway of transport for K and Ca. On each date, five bunches were chosen from each of four vines. Before veraison (39 DAF) (days after flowering: when 50% capfall had occurred), three berries were girdled on each bunch, three berries were excised and resuspended on the bunch, and three berries were removed and frozen for later analysis. After veraison (60 DAF), nine berries were girdled, three berries excised, and three berries removed. Girdling was achieved by manually scraping a 2- to 3-mm ring around the pedicel with the blunt end of a razor until the tough tissue was reached. Excised berries were resuspended on the bunch using cotton thread tied to the pedicel. The pedicel was dipped in silicone to prevent water loss from this tissue. Bunches were resampled at approximately two-week intervals and three girdled berries were removed along with three control berries on each occasion. At the final sampling, the excised berries were also removed. Berry fresh weight, TSS, K, and Ca were analyzed.
Berry analysis.
The fresh weight of a 50-berry sample was taken from each of five bunches on each sampling date. The sample was homogenized and partitioned for TSS, dry weight, and mineral element analysis. The first subsample was centrifuged at 720 g for 10 min, and then TSS was assessed using a hand-held refractometer (ATAGO, Tokyo, Japan). Berry sugar amounts were estimated by multiplying the TSS reading with berry fresh weight. Dry weight was determined after allowing 20 g of the second subsample to dry to constant weight at 60°C in a drying oven. The third subsample was frozen and transported on dry ice to a commercial laboratory (Waite Analytical Services, Adelaide, or Charles Sturt University Environmental & Analytical Laboratories, Wagga Wagga) for K and Ca analysis. The thawed samples were digested with nitric acid, finished with hydrochloric acid, and then analysed by inductively coupled plasma atomic emission spectrometry.
Berry water relations.
Potted Shiraz vines were grown in a greenhouse at 20/30°C. Both green (preveraison) and purple (postveraison) berries were collected at midday, placed in a Schollander pressure bomb (SAPS 3005 Plant Water Status Console, ICT International, Armidale, Australia), and the water potential measured. Diameters of the berries were immediately measured with a micrometer, fresh weight determined, and the total soluble solids (%) measured with a portable refractometer (ATAGO Pocket PAL-1). In total, 12 preveraison and 13 postveraison berries were sampled. A comparable set of berries were weighed and then oven-dried at 65°C for two days to determine dry weight and percent dry matter.
The molality of the berry sap was calculated from the % soluble solids (converted to mass according to the method of McCarthy and Coombe [1999]), converted to molar mass (assuming fructose and glucose were the principal solutes in the berry), and the weight of water (from fresh weight and percent dry matter) in each berry. Solute potential was subsequently determined from the Van’t Hoff formula (Kramer and Boyer 1995, Tyerman et al. 2004).
Statistical analysis.
For the three growing seasons (2000 to 2002) and the two blocks (A and B) studied, a linear mixed model was used to fit cubic smoothing splines to model trends in K, Ca, fresh weight, dry weight, and sugar accumulation over days after flowering. Natural logarithmic transformations of the data were taken because of increasing variance over time. Fixed terms in the model for a variable included an overall mean and a linear trend across days after flowering. Random terms included random intercepts for years and blocks within years and linear trends for years and for blocks within years. Also included in the random part of the model was a term for the overall mean level curvilinear trend (cubic smoothing spline), fitted over DAF common to all three years. Year level curvilinear trend and the block within year level curvilinear trend, as well as deviations from all these trends (overall, year, and block) due to particular DAF, were fitted. The significance of all fixed terms was assessed (at 5%) using Wald tests, and the significance of random terms was assessed using residual maximum likelihood ratio tests (Verbyla et al. 1999). For the girdling/excision experiment, a linear mixed model was fitted to the data with a uniform correlation structure between harvests. All analyses were performed using ASREML (Gilmour et al. 2002). Rates of K accumulation were calculated using SigmaPlot software (version 8.0, SPSS Inc., Chicago, IL) with linear regressions from the first sampling date to veraison or from veraison to the weight maximum.
Results
Climatic conditions.
Wagga Wagga is located in the southwestern slopes region of NSW on the Murrum-bidgee River at an elevation of 200 m. The daily maximum temperatures in the winter reach 12 to 14°C, whereas maximum temperatures in the summer are warm, averaging 32°C. Two of the growing seasons in this study (2000 to 2001 and 2002 to 2003) were warmer than average with the mean maximum temperature in January reaching 36.0°C (Table 1⇓). Wagga Wagga has a mean annual rainfall of 570 mm, although monthly totals were highly variable over the growing season in each year, ranging from 0.4 to 151 mm month-1. Relative humidity in the midafternoon during the summer months typically average 30%.
Mean monthly temperatures and total monthly rainfall over the three growing seasons. Flowering occurred in November, veraison in early January, and harvest at mid-February to early March.
Berry growth and sugar accumulation.
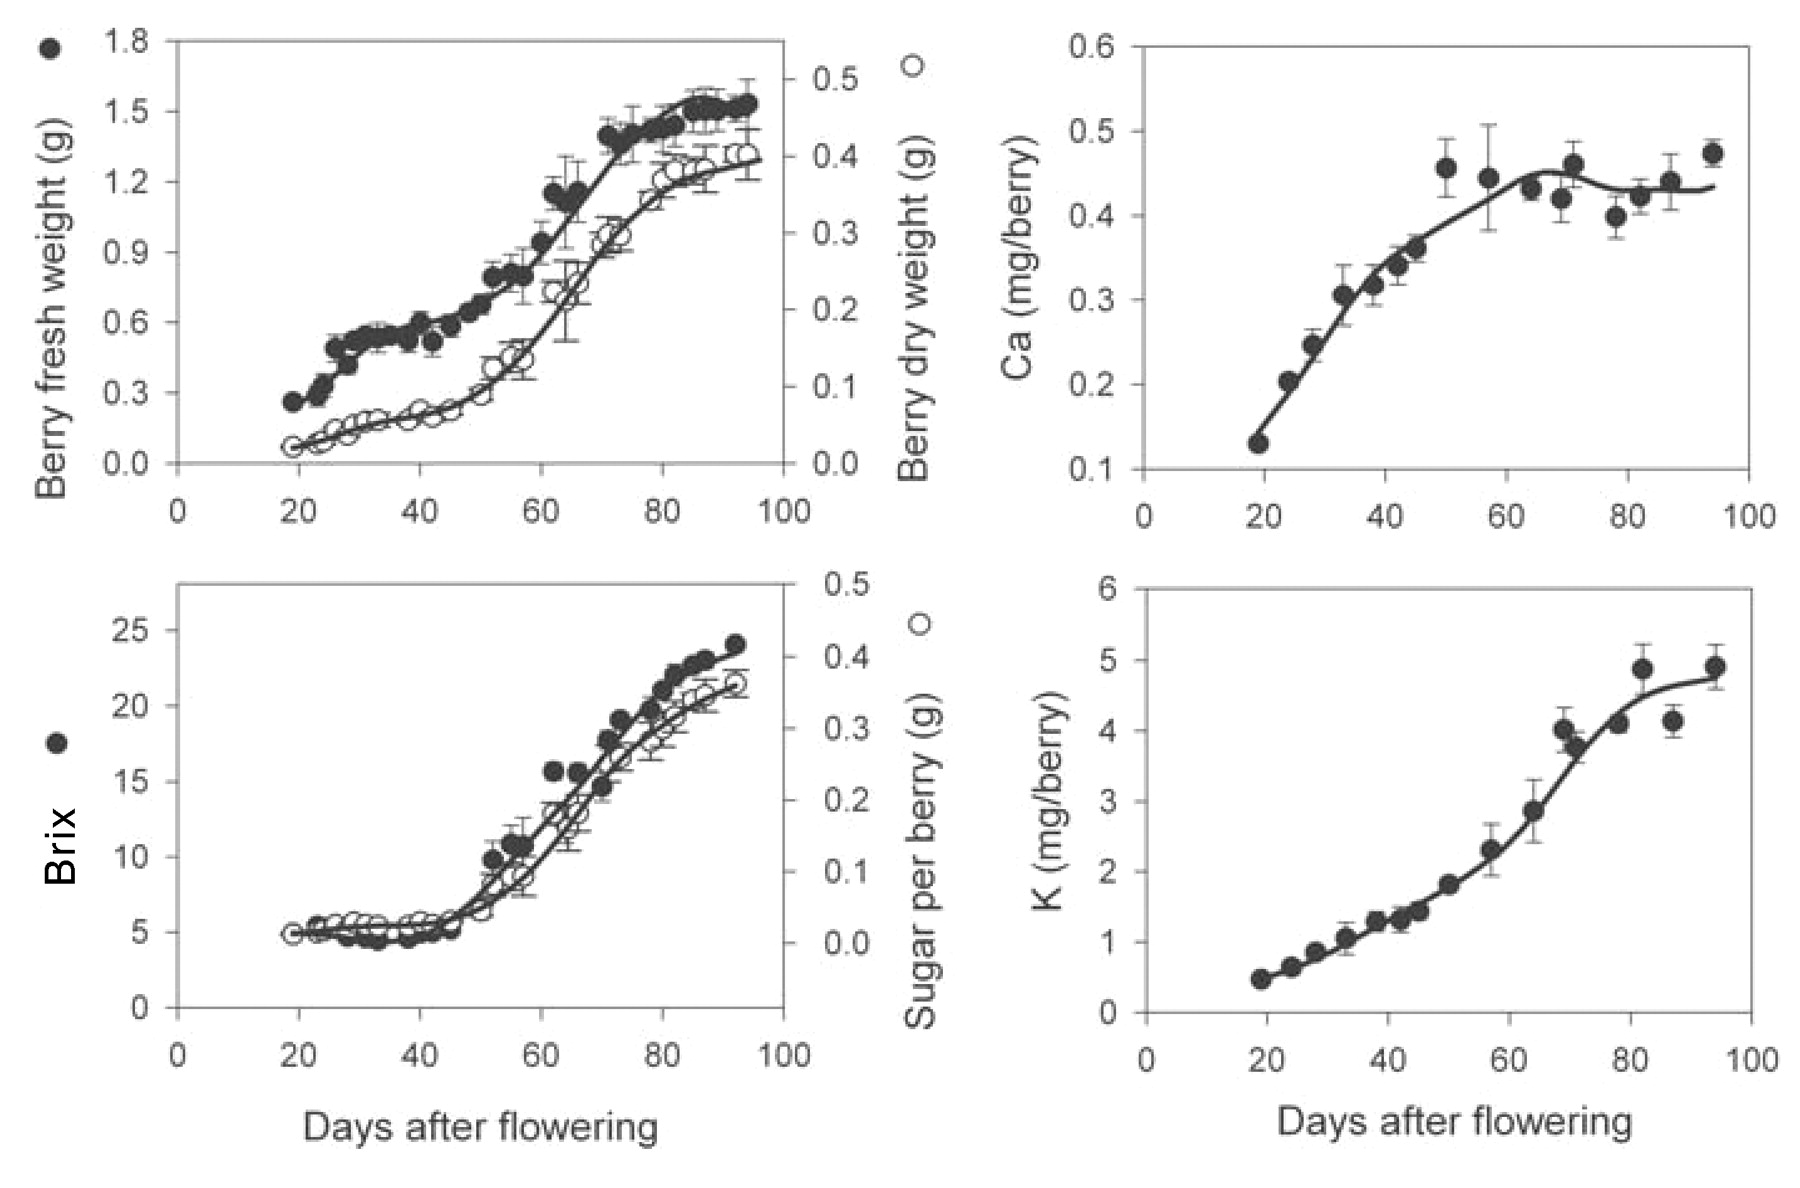
In the 2000 to 2001 season, the increase in fresh weight of Shiraz berries from block A followed a typical double sigmoid growth curve (Figure 1⇓), with 50% veraison occurring at 55 DAF (13 Jan 2001). The fresh weight maximum occurred at 87 DAF. These berries were commercially harvested one week later at 94 DAF (21 Feb) when the mean berry fresh weight was 1.5 ± 0.1 g, dry weight was 0.40 ± 0.3 g, of which 0.36 ± 0.02 g was sugar, and the soluble solids were 24.1 ± 0.3 Brix (Figure 1⇓). Dry weight accumulation continued until harvest; however, the rate of accumulation slowed from 82 DAF onward. Total sugar per berry and sugar concentration within berry continued to increase until harvest.

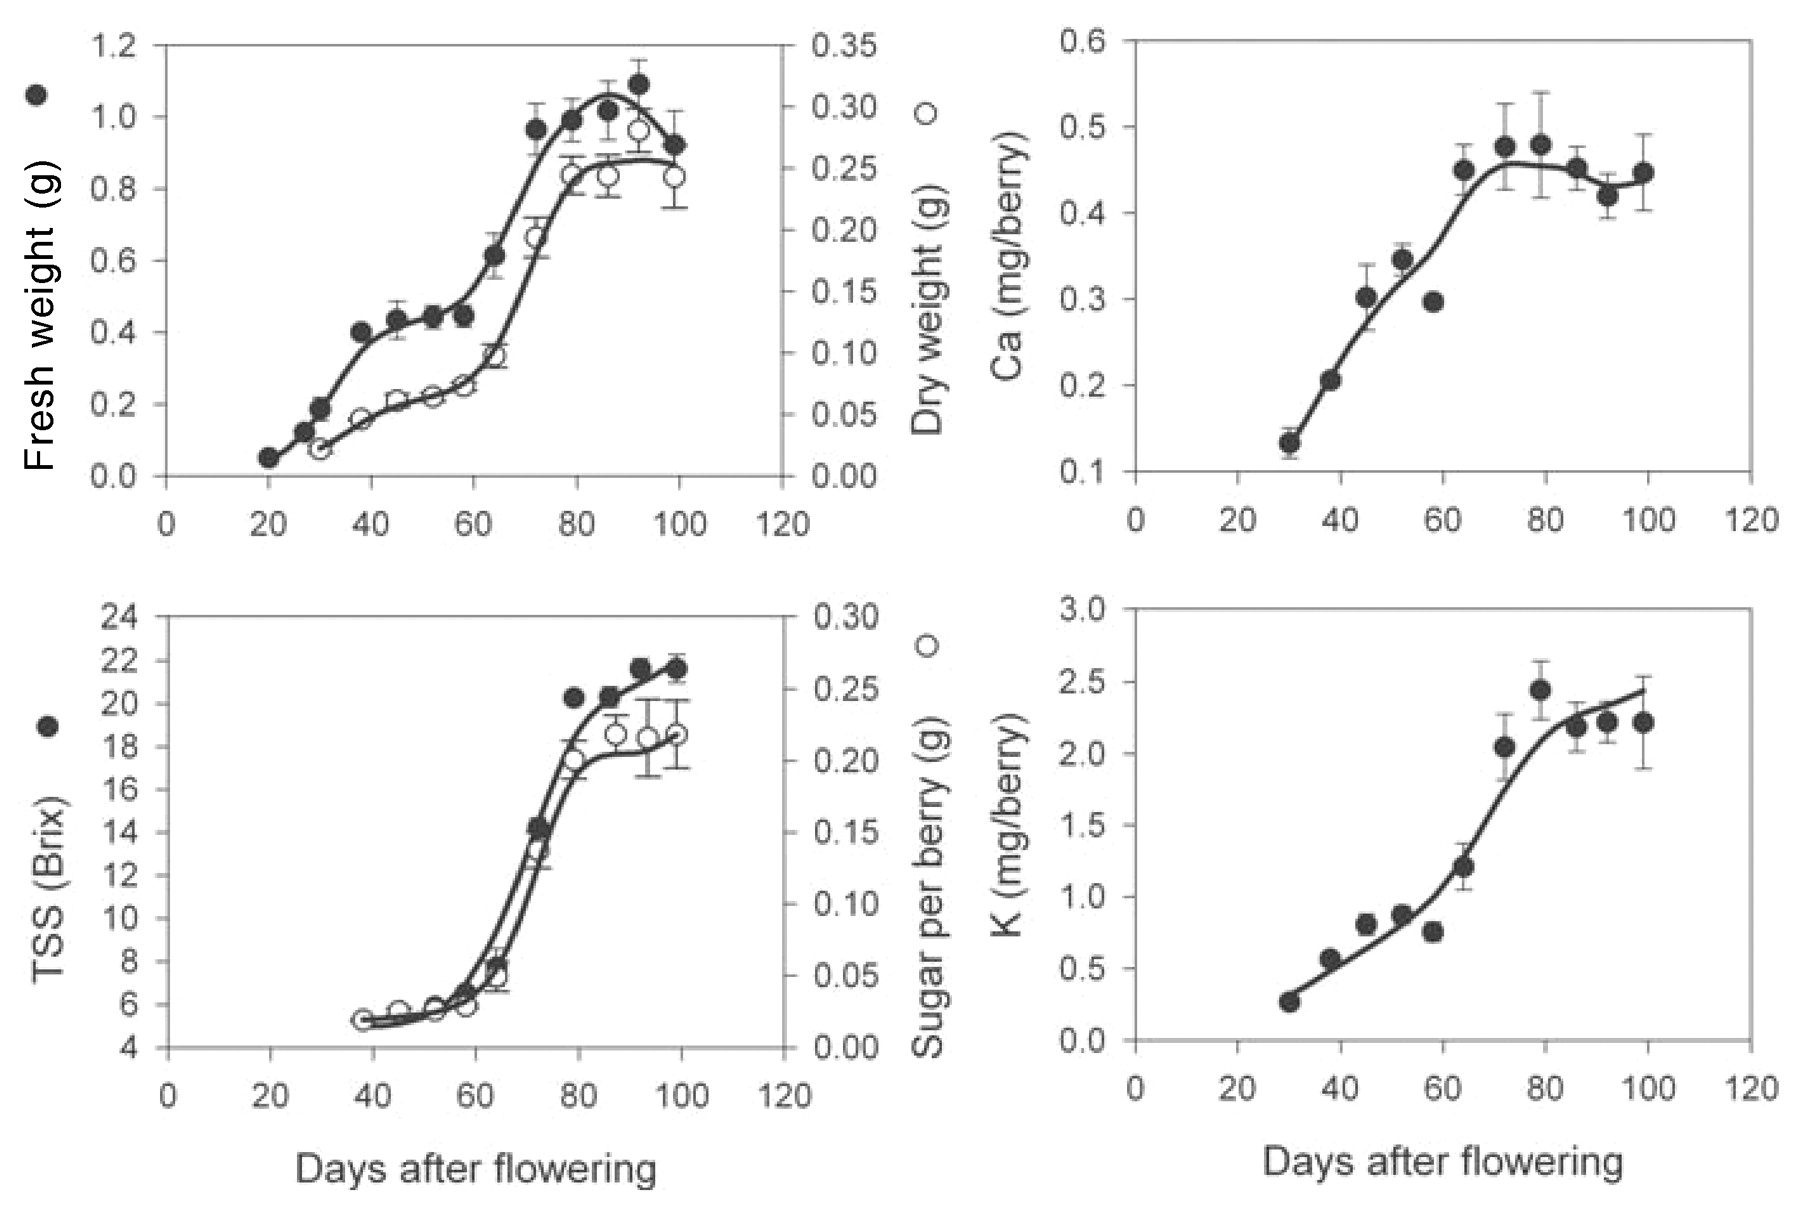
Increase in berry fresh and dry weight, TSS (Brix), Ca, and K during development and ripening of Shiraz berries from field vines of block A in 2000 to 2001. Veraison occurred at 55 DAF. Bars represent ± SE of the means.
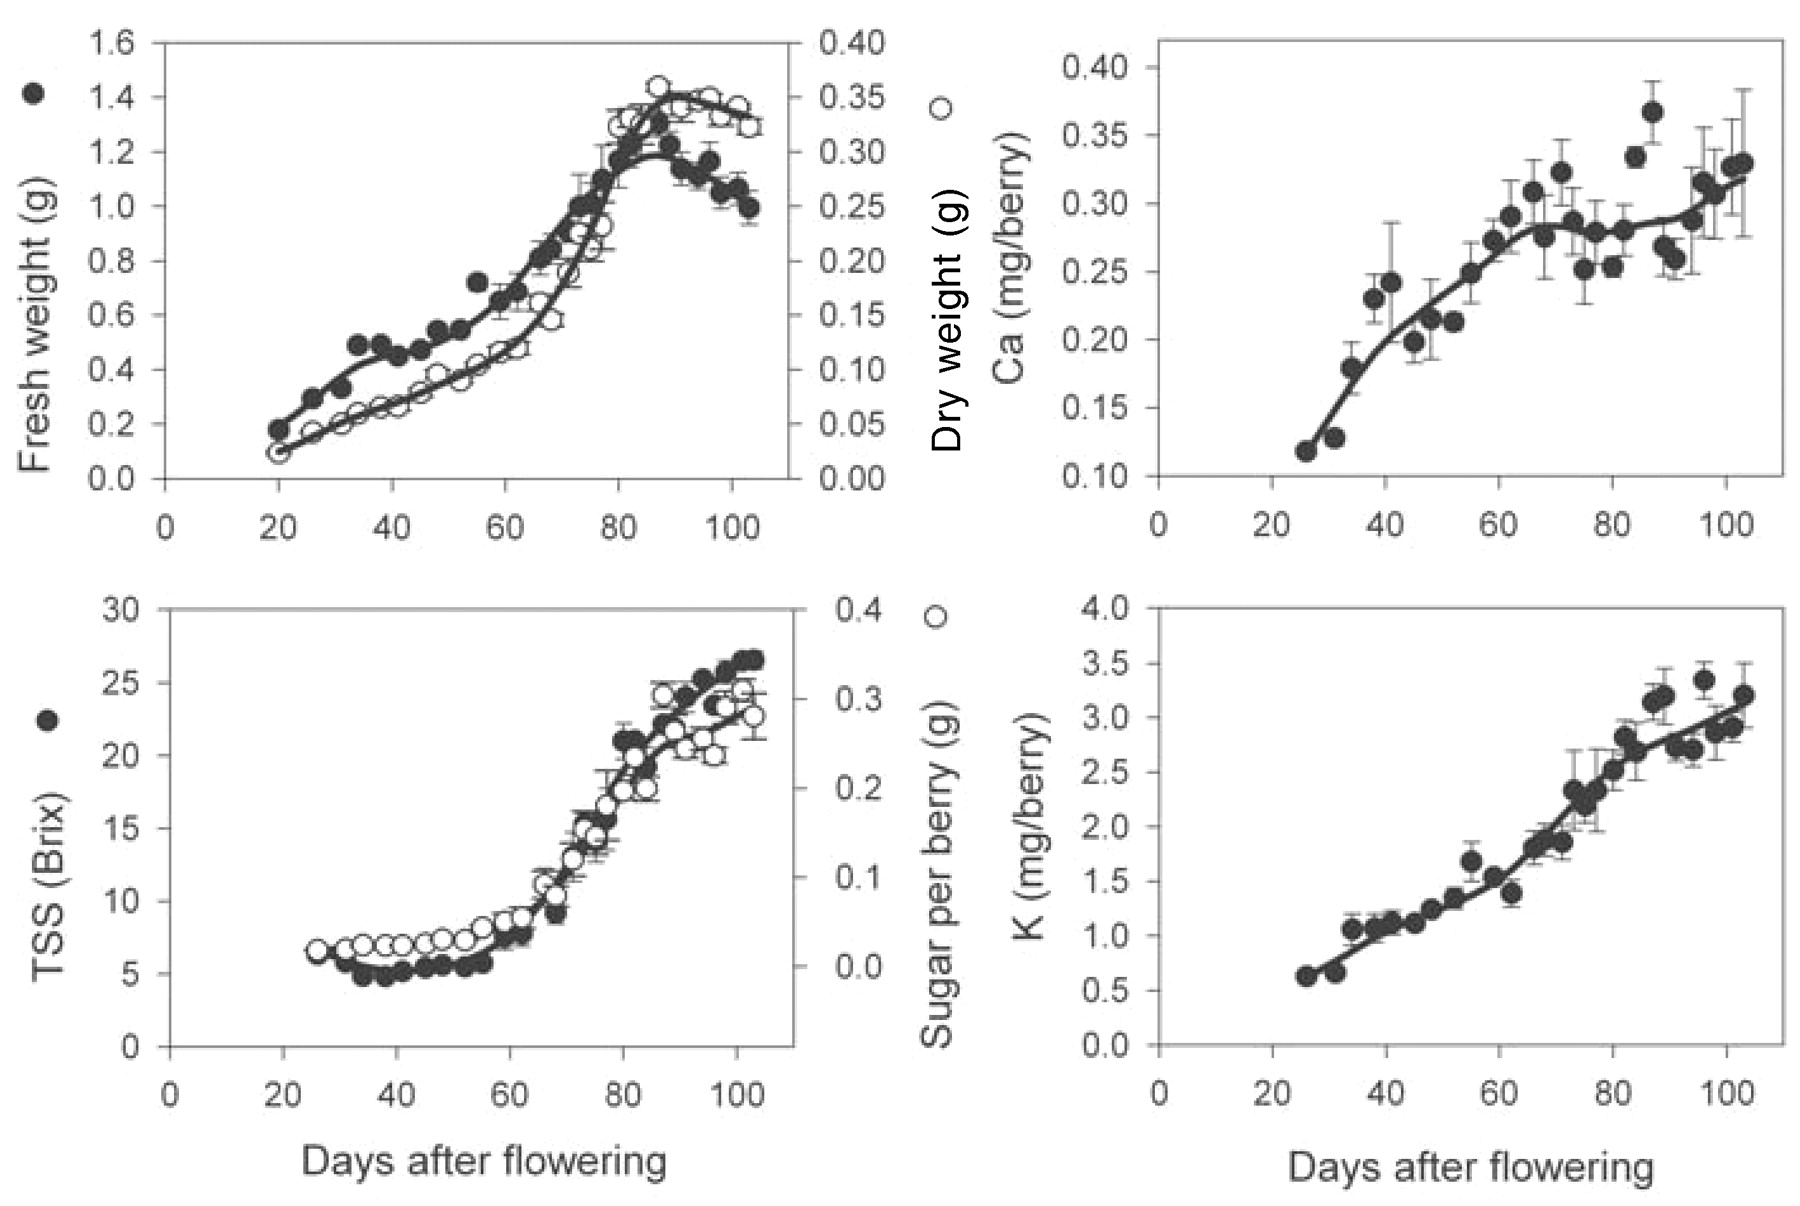
In the 2001 to 2002 season, berries from block A were 30% smaller than those in block B (Figures 2⇓ and 3⇓). In block A, 50% veraison occurred at 60 DAF and the berry fresh weight maximum was 1.06 ± 0.07 g at 87 DAF. Berry fresh weight decreased to 0.92 ± 0.09 g (14%) by harvest, while dry weight remained constant after the weight maximum at 0.24 ± 0.03 g. At harvest TSS was 21.6 ± 0.7 Brix, and there was 0.22 ± 0.02 g of sugar per berry. Berries from block B were harvested much later than block A (at 119 DAF), and the weight maximum (1.5 ± 0.1 g) was defined as occurring at 103 DAF, 36 days after 50% veraison. Fresh weight loss was 13% over the 16 days before harvest (1.3 ± 0.04 g). Dry weight remained constant at 0.39 ± 0.02 g. Trends in accumulation of berry TSS were not significantly different between blocks A and B. Sugar per berry was 0.33 ± 0.02 g at the weight maximum, which remained constant until harvest. However, because of the berry water loss, TSS increased from 22.5 ± 0.4 to 24.0 ± 0.4 Brix by harvest.
Increase in berry fresh and dry weight, TSS (Brix), Ca, and K during development and ripening of Shiraz berries from field vines of block A in 2001 to 2002. Veraison occurred at 60 DAF. Bars represent ± SE of the means.

Increase in berry fresh and dry weight, TSS (Brix), Ca, and K during development and ripening of Shiraz berries from field vines of block B in 2001 to 2002. Veraison occurred at 60 DAF. Bars represent ± SE of the means.
Berries from block B were 15% smaller during the 2002 to 2003 season compared with the previous season (Figure 4⇓). Veraison occurred at 62 DAF (3 Jan) and the berry fresh weight maximum occurred at 87 DAF (27 Jan). Berry fresh weight then declined from 1.30 ± 0.05 g to 1.00 g ± 0.06 (38%) over the subsequent 16 days before harvest (12 Feb). Berry dry weight reached a maximum of 0.359 ± 0.004 g at 90 DAF, which declined to 0.323 ± 0.007 g. Sugar per berry increased from 0.25 ± 0.01 g at the weight maximum to 0.29 ± 0.03 g at harvest, while TSS increased from 21.9 ± 0.05 to 26.6 ± 0.06 Brix.
Increase in berry fresh and dry weight, TSS (Brix), Ca, and K during development and ripening of Shiraz berries from field vines of block B in 2002 to 2003. Veraison occurred at 62 DAF. Bars represent ± SE of the means.
Accumulation of Ca and K during berry development.
In the four sets of vines examined, Ca accumulation was strong until 68 to 74 DAF (corresponding to 8 to 14 days after veraison); average levels per berry reached 0.28 ± 0.03 to 0.45 ± 0.04 mg (Figures 1⇑ to 4⇑⇑⇑). From this point, average Ca amounts in berries from block A remained relatively stable (Figures 1⇑ and 2⇑). Accumulation of Ca into the berries from block B resumed at 80 to 90 DAF to reach a final concentration of 0.47 ± 0.03 mg berry−1 (2001 to 2002) and 0.32 ± 0.05 mg mg berry−1 (2002 to 2003) at harvest (Figures 3⇑ and 4⇑).
Postveraison rate of accumulation of K was much stronger (up to 0.11 mg berry−1 day−1) compared with preveraison accumulation rates (up to 0.044 mg berry−1 day−1, corresponding to a 1.9 to 2.7-fold difference; Figures 1⇑ to 4⇑⇑⇑). However, a decrease in K accumulation rates (0.014 to 0.028 mg berry−1 day−1) occurred from time of the weight maximum across all vines. Final amounts of K ranged from 2.4 to 4.8 mg berry−1.
Girdling and excision study.
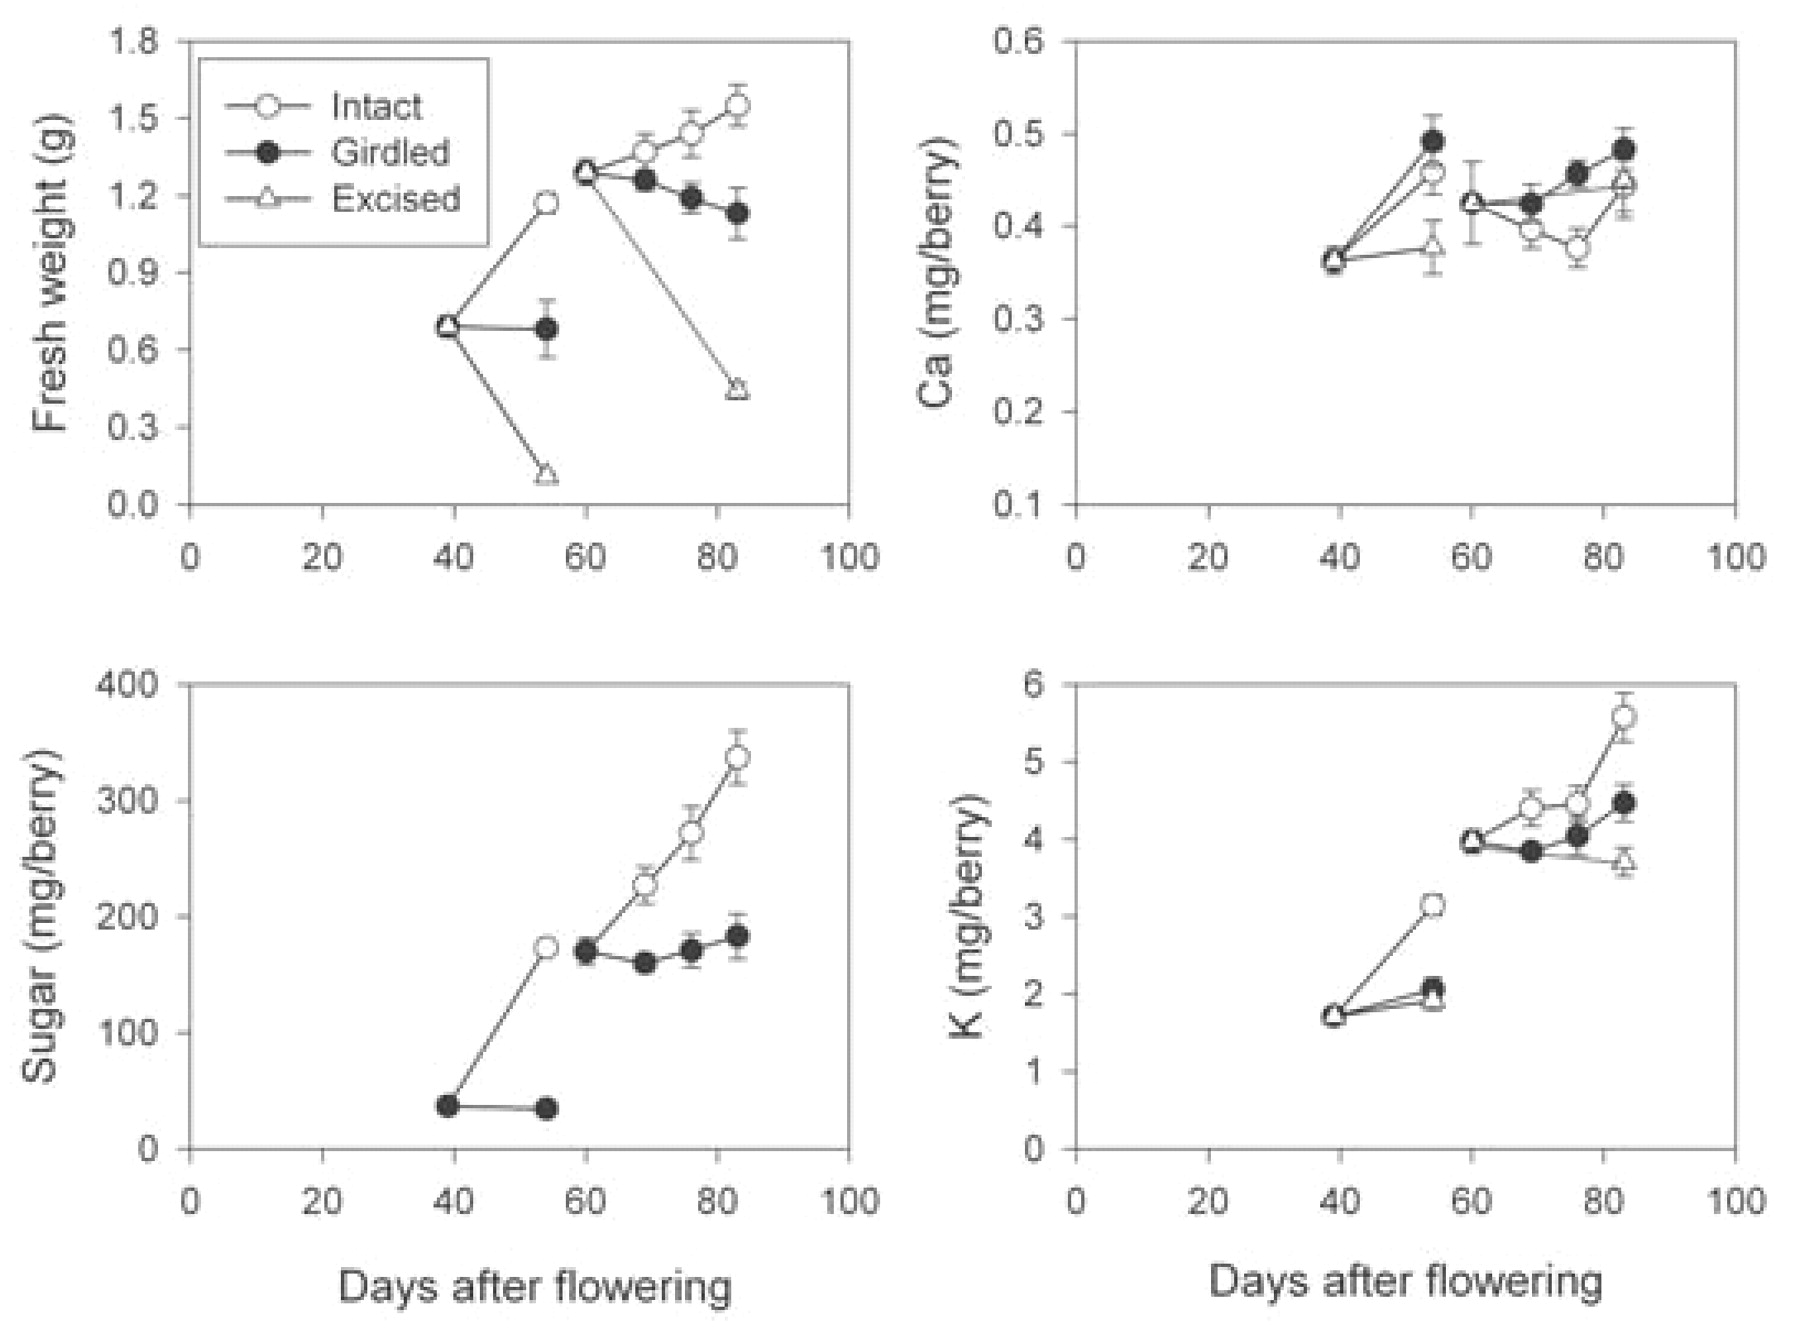
Both berry pedicel girdling and excision before and after veraison had significant impacts on the trends in berry growth (p < 0.001), sugar accumulation (p < 0.001), and K accumulation (p < 0.001) over time (Figure 5⇓). For example, berry growth was severely inhibited by preveraison girdling (Figure 5⇓). The fresh weight of control berries increased by 0.5 g, or 1.7-fold over the 15 days, whereas excised berries lost 0.6 g, or 84% of their weight. Girdling after veraison also inhibited growth markedly. The fresh weight of girdled berries remained constant while in control berries it increased by 0.25 g, or 1.20-fold, and excised berries lost 0.85 g, or 66% of their weight. Furthermore, those berries that were girdled preveraison did not undergo the same extent of colour change as control berries. Only 7% of girdled berries turned purple, while 90% of control berries turned purple over the subsequent 15 days (Table 2⇓).
Proportion (%) of Shiraz berries reaching a specific developmental stage 15 days after preveraison girdling in comparison with ungirdled control berries.

Change in berry fresh weight, sugar, Ca, and K after pedicel girdling or berry excision in field vines of block A in 2000 to 2001. The treatment by time interaction was significant for berry fresh weight, sugar, and K levels at p < 0.001 for both preveraison and postveraison girdling. The treatment by time interaction was significant for berry Ca levels at p < 0.01 for preveraison girdling, but was not significant for postveraison girdling. Note: the symbol for the excised treatment in the postveraison girdling data set for Ca is masked by symbols for other treatments. Bars represent ± SE of the means.
Sugar accumulation of girdled preveraison berries was inhibited for up to 15 days with sugar content remaining at ~35 mg (Figure 5⇑). During this period the control berries went through veraison, and their sugar content increased by 137 mg, or 4.7-fold over the 15 days. Sugar content of berries girdled after veraison remained at 160 to 180 mg, while the sugar content of control berries increased by 167 mg to 351 mg.
The pattern of K accumulation closely mimicked the sugar accumulation pattern at both girdling times. Fifteen days after girdling pedicels of preveraison berries, K accumulated 1.8-fold in the control berries but not to the same extent in the girdled berries (Figure 5⇑; p < 0.001 for the treatment by time interaction). Girdling the berries postveraison also resulted in a decreased rate of K accumulation compared to the control berries (p < 0.001 for the treatment by time interaction). In control berries, K increased 1.4-fold; however, in girdled berries K increased only 1.1-fold. Girdling and excision of pedicels before veraison also affected trends in Ca accumulation (p < 0.001). Over 15 days, Ca increased 1.25-fold in control berries, while Ca content of girdled berries increased 1.36-fold. However, there was no impact on Ca accumulation when girdling and excision were carried out after veraison (Figure 5⇑).
Berry water and solute potential.
Fresh weight and % soluble solids differed significantly (p < 0.01) between berries at the two stages of development (Table 3⇓), with fresh weight about 2-fold higher and soluble solids about 4-fold higher in the postveraison purple berries compared with the preveraison green berries. The total water potential was also about 50% more negative, whereas the solute potential was about 4-fold more negative in purple compared with green berries.
Fresh weight, soluble solids, water potential, and solute potential of Shiraz berries (mean ± SE, N = 12–13) at two selected stages of development on vines growing in greenhouse conditions.
Discussion
Phloem flow into berries.
The objective of this study was to determine which of the vascular tissues contribute to postveraison berry growth and to ascertain if the flows through these tissues change during shrinkage. The phloem-mobile element, K, moved into the berry in the vines from both blocks and in both seasons, both before and just after veraison, with stronger accumulation in the early postveraison period. This has also been reported elsewhere (Lang and Thorpe 1989, Creasy et al. 1993, Greenspan et al. 1994, 1996, Ollat and Gaudillère 1996, Rogiers et al. 2000). It is generally accepted in these studies that the strong phloem flow can be attributed to the high sink-strength of the berry. However, the rates of accumulation of both K and sugar slowed during the shrinkage phase of berry development. Concomitantly, berry dry weight accumulation either slowed or declined. Phloem sap contains a higher solute content than xylem sap (15 to 25% w/v, compared to <0.4% w/v; Pate 1975), and therefore provides most of the resources for dry weight accumulation by the berry. Thus, results for K, sugar, and dry matter accumulation all conform to a decrease in phloem flow occurring during the shrinkage phase of berry growth.
High K amounts after veraison may be required to drive the cell wall expansion required for berry growth. As protons are pumped into the apoplast from the cytoplasm by the membrane-bound ATP-ase (Hager et al. 1971), the plasma membrane potential is kept steady by the uptake of K ions (Mengel and Kirby 1987). Because it is the most abundant cation, K may also be involved in osmoregulation. The high concentration of K and sugar in the fruit maintains the water potential gradient to drive water entry (Mpelasoka et al. 2003). The accumulation patterns of K and berry sugar during development and ripening were almost identical, suggesting that they may load into the berry together (even if through different carriers). Possible mechanisms to account for the reduction in phloem flow during late berry ripening could include an inhibition of phloem unloading, for example, by down-regulation of the ATP-ase, sucrose (Davies et al. 1999) and hexose (Fillion et al. 1999) transporters, or K carriers (Pratelli et al. 2002).
Measurements of berry water relations indicated markedly negative total water and solute potentials (2- to 4-fold) occurred after veraison compared with preveraison Shiraz berries. These results are thus consistent with studies measuring water relations of grape berries (Greenspan et al. 1996, Tyerman et al. 2004). The solute potential is a measure of the predominant pericarp compartment and results suggested a high capacity by the pericarp cells for osmotically driven water transport from the vine to the berries. Consistent with these results, several studies (Lang and Düring 1992, Lang and Thorpe 1989) have shown a gradual breakdown in the symplast-apoplast compartmentation occurred with ripening of grape berries. More recently, Dreier et al. (1998) have shown that membrane integrity of berry mesocarp cells was gradually degraded during ripening of Thompson Seedless grapes, leading to enhanced water flow into the berries by phloem transport. However, shrinkage of Shiraz berries (that is, loss of water) occurred despite the strongly negative water potentials of the berries. As indicated above, reduced rates of import of the phloem mobile K and sugar during shrinkage conformed to reduced phloem flow. It may be that in Shiraz, berry compartmentation and membrane integrity were not degraded to the same extent as other varieties. Loss of phloem aquaporin and membrane hydraulic activity, as proposed by Tyerman et al. (2004), might explain the diminished phloem transport in Shiraz berries during shrinkage.
Xylem flow into and out of berries.
Flow through the transpiration stream is influenced by daily changes in water vapor pressure gradients between the plant and the atmosphere (Lambers et al. 1998). The greater variation in amounts of berry Ca between replicates within a year, and across seasons, compared with amounts of K (and sugar), was consistent with the accumulation of xylem-mobile elements being more responsive to environmental factors than the accumulation of phloem-mobile elements. Despite this variability, there was a consistent and strong trend of Ca accumulation before veraison. The rate of Ca uptake before veraison is consistent with high berry transpiration rates that occur early in berry development (Rogiers et al. 2004).
After veraison, in vines from block A, levels of Ca in the berry remained fairly constant until harvest, consistent with a cessation in xylem flow. Cessation in Ca accumulation has been reported in a number of varieties including de Chaunac (Hrazdina et al. 1984), Chardonnay (Possner and Kliewer 1985), and Pinot noir (Creasy et al. 1993). That xylem flow is impeded at or near veraison in Shiraz grapes is supported by changes in water-flow measurements. For instance, a 10-fold reduction in berry hydraulic conductance occurred between veraison and full ripeness in this variety (Tyerman et al. 2004). Furthermore, the hydraulic resistance through the brush region and distal part of the berry increased during development, again consistent with restricted xylem flow.
Loss of Ca from berries after veraison was highlighted in a study of five different varieties (Schaller et al. 1992) and was considered to be caused by backflow to the vine. Ca has a structural role in cell walls and is also involved in cell membrane stabilization (Christiansen and Foy 1979). During the early stages of fruit development, Ca is probably required for the production of cell wall material (Rigney and Wills 1981). However, after veraison, when cell walls loosen for cell expansion, the Ca becomes soluble (Chardonnet and Donèche 1995) and could escape the fruit either through the xylem or other apoplastic routes. Backflow apparently occurred because the turgor pressure of the berry was slightly positive whereas in the vine it was negative (Lang and Thorpe 1989), especially when vines were under high evaporative demand. Even though a significant loss of Ca did not occur in the present study, backflow may still have occurred since Ca influx may have equalled Ca efflux. Further studies on the contribution of back flow to the berry water status are, therefore, required.
The resumption of Ca accumulation late in ripening into the berries of the vines in block B suggested a second phase of xylem inflow occurred. This trend was also observed by Schaller et al. (1992). In the present work, the resumption of xylem inflow coincided with the apparent decrease in phloem flow. Perhaps the highly negative water potentials of the berry drew water through the xylem osmotically. However, this resurgence of xylem flow did not occur in block A in either season, and berries in block B continued to shrink despite the apparent resurgence in xylem flow, suggesting that the amount of water flowing into the berry through the xylem may be insufficient to match transpirational losses.
Postveraison xylem flow has been reported previously on Shiraz from block A, where Ca accumulation continued to increase (Rogiers et al. 2000). Studies on other grape varieties have also found postveraison Ca accumulation (Cabanne and Donèche 2003). Variation in postveraison xylem flow may be caused by seasonal differences in weather and cultural practices, such as irrigation regime, which may change vine water relations and lead to different patterns of Ca accumulation into the berry. Varying patterns of Ca accumulation from fruit set to harvest have also been observed in apple (Saure 2005). In Shiraz, regardless of the Ca accumulation pattern postveraison, berries continued to shrink during the late phase of ripening. Therefore, the occurrence of shrinkage in Shiraz berries does not depend on xylem flow; however, it may affect the rate of shrinkage.
Girdling effects on accumulation of sugar and elements.
Girdling the berry pedicel caused an immediate cessation in sugar accumulation, an expected response given that sugar is transported through the phloem (Pate 1975). Girdling also inhibited color formation, consistent with sugar being required for normal pigment development (Pirie and Mullins 1977). Additionally, accumulation of K was inhibited by the girdling of the berry pedicels. There was only a slight increase in the amount of berry K after girdling, consistent with movement predominantly through the phloem. Arrested berry growth, and even a decline in berry size, because of girdling also occurred, reinforcing the role of the phloem as the predominant route for water and solute uptake into the berry after veraison. However, some water appeared to enter the girdled berry through the xylem, because completely excised berries were much smaller and lost more fresh weight than girdled berries. These results do not necessarily imply that, during veraison, xylem flow occurred into berries that were not girdled. With their main source of water removed, girdled berries may have had increased flow through the xylem to compensate for the loss of phloem transport. Slightly higher Ca content in girdled compared with control berries was consistent with this possibility.
Onset of shrinkage.
Onset of shrinkage in Shiraz berries did not consistently occur on a particular day after flowering. In the present study, the weight maximum occurred at 87 DAF in each of three years, except in block B of the 2001 to 2002 growing season, when it occurred on 103 DAF. In this block, a weight-loss phase appeared to have started at 91 DAF, but subsequent rainfall at 99 DAF resulted in a 0.4 g increase in fresh weight. A similar increase also occurred in berries on vines of block A, but the fresh weight increased by only 0.1 g. Rain may have increased berry fresh weight presumably because direct absorption of water occurred through the berry skin. Low atmospheric vapor pressure deficits on rainy days would also decrease berry transpiration rates, such that even low water flows into the berry through the vascular tissues would allow some berry growth to occur. In the South Australian Riverland region, weight loss consistently occurred at about 91 DAF over several seasons and under a range of irrigation regimes (McCarthy 1997). However, deficit irrigation applied from fruit set onward delayed shrinkage by 11 days in potted vines (Rogiers et al. 2004). Deficit irrigation can influence the onset of shrinkage by limiting shoot growth and canopy size and, in turn, would decrease carbohydrate translocation to the berry and ultimately reduce berry maturation rates.
Conclusions
Evidence presented here from a xylem-mobile element, and both dye tracers and hydraulic conductance studies elsewhere, showed that strong xylem influx into the berry occurred before veraison, but this flow diminished during veraison and flow through the phloem then predominated. After the weight maximum, phloem flow into the berry also appeared to decline, as indicated by reduced rates of K, sugar, and dry weight accumulation and despite strongly negative berry water potentials. Under some conditions, reduction in phloem flow may be accompanied by renewed xylem flow into the berry. However, resumption of xylem activity appeared to be inadequate to match transpirational losses from the berries. Thus, weight loss occurred late in the ripening phase of Shiraz berries.
Footnotes
Acknowledgments: This research was supported by the Commonwealth Cooperative Research Centre Program and conducted through the CRC for Viticulture with support from Australia’s grapegrowers and winemakers through their investment body the Grape and Wine Research and Development Corporation, with matching funds from the Federal Government.
Technical assistance by Nicole Dimos and Robert Lamont is gratefully acknowledged.
- Received July 2005.
- Revision received November 2005.
- Copyright © 2006 by the American Society for Enology and Viticulture
Literature Cited
Vol 57 Issue 1


Jump to section
Related Articles
Cited By...
More from this TOC section
Similar Articles
