


Abstract
Four methods of regulated deficit irrigation (RDI), an irrigation technique whereby water is supplied at rates at or below the full evapotranspiration (ETc), were applied to Cabernet Sauvignon grapes. The grapes were thereafter processed with three winemaking techniques: control (10-day maceration), extended maceration (EM; 30-day maceration), and saignée (removal of 16% of must by volume at crushing). The 25% ETc treatment had higher concentrations (fresh weight basis) of skin anthocyanins and seed tannins. Overall, skin tannins showed increased biosynthesis in 100% ETc and 25/100% ETc, whereas seed tannins were mostly (positively) affected due to a reduction of fresh weight in 25% ETc. Extraction of anthocyanins and tannins during winemaking ranged from 40 to 73% and from 17 to 26%, respectively. During maceration, the extraction curves for both anthocyanins and tannins were unaffected by the RDI treatments; quantitative differences were caused primarily by the winemaking treatments and secondarily by the RDI treatments. Consistent with a higher content of anthocyanins, 25% ETc wines had higher concentrations of polymeric pigments and greater color saturation and a* (red color component) both at day 30 and after 120 days post-crushing. EM enhanced seed tannin extraction, which resulted in a 50% increase in wine tannins relative to control and saignée wines, but it lowered anthocyanins and color saturation. Saignée increased anthocyanins at day 5 by 22% and tannins by 24% (relative to control wines), resulting in higher concentrations of polymeric pigments after 120 days. Both saignée and control wines had a roughly equivalent proportion of seed- and skin-derived tannins, whereas EM wines had 73% seed-derived tannins.
Anthocyanins and tannins are phenolic compounds bearing a three-aromatic ring system defined by a C6−C3−C6 structure that possess specific hydroxyl and nonhydroxyl substitutions. Anthocyanins and tannins are responsible for the sensory features that distinguish red wines from other beverages (Cheynier 2006), including taste sensations such as bitterness (Robichaud and Noble 1990), tactile sensations such as astringency (Arnold et al. 1980), and visual sensations such as color saturation and hue (Somers 1978). Anthocyanins and tannins cannot elicit aromatic sensations due to restrictions imposed by their molecular weights, which are higher than the 300 Da limit for volatility (Rowan 2011). Nevertheless, they may affect the partitioning of aromatic compounds between vapor and liquid phases, ultimately modulating both ortho- and retronasal perceived aroma (Muñoz-González et al. 2014). Therefore, anthocyanins and tannins can modulate the whole sensory spectrum of red wines.
Anthocyanins are responsible for wine color and occur as vacuolar inclusions in grape skins (and in the mesocarp of the teinturier cultivars) as glycosylated monomers of malvidin, cyanidin, petunidin, peonidin, delphinidin, and pelargonidin (Cheynier 2006). Anthocyanins are highly reactive within the wine matrix and can undergo both nucleophilic and electrophilic substitutions (He et al. 2012). Anthocyanins can react with tannins during winemaking to form polymeric pigments, which can modulate astringency (Wollmann and Hofmann 2013).
Proanthocyanidins, also referred to as tannins, occur in seeds, skins, and stem/rachis as oligomers and polymers of four flavan-3-ol subunits: (+)-catechin, (−)-epicatechin, (−)-epigallocatechin, and (−)-epicatechin-3-O-gallate (Prieur et al. 1994, Souquet et al. 1996). Seed- and skin-derived tannins differ in their chemical compositions, which affect their sensory properties. Seed tannins have lower molecular weights than skin tannins and are composed of (+)-catechin, (−)-epicatechin, and epicatechin-3-O-gallate, with monomeric flavan-3-ols, dimers and trimers being the predominant species. Seeds are predominantly bitter because of their high content of monomeric flavan-3-ols (Thorngate and Noble 1995) and proanthocyanidin dimers and trimers, which tend to be more bitter than astringent. Moreover, as the percentage of galloylation of seed tannins increases (or in the wine made from them), it enhances their ability to precipitate with proline-rich-proteins (PRPs) found in human saliva, thus increasing astringency (Ricardo-da-Silva et al. 1991). Skin tannins, however, are composed of (−)-epicatechin, (−)-epigallocatechin, and (+)-catechin (Gagné et al. 2006). The molecular weight of skin tannins (known as mean degree of polymerization, mDP) can vary from two up to 80 flavan-3-ol subunits (Souquet et al. 1996, Gagné et al. 2006). Because skin tannins have comparatively higher mDP than seed tannins, skin tannins display a higher affinity for PRPs (Baxter et al. 1997). Thus, skin tannins may elicit more astringency than seed tannins.
Intriguingly, however, skin tannins have been described as “supple,” “riper,” and able to give a “fuller” mouthfeel relative to seed tannins (Kennedy 2008). There is to date no evidence to support this description of skin tannins. Nevertheless, association of high molecular weight tannins with polysaccharides and mannoproteins may positively modulate astringency (Scollary et al. 2012), thus adding some support to this anecdotal observation. Therefore, from a winemaking perspective, seed tannins are undesirable while skin tannins are desired.
The phenolic composition of wine can be manipulated “from vine to wine.” Vineyard irrigation practices such as regulated deficit irrigation (RDI), where water application is restricted below the full evapotranspiration (ETc) of a vineyard, can alter the biosynthesis of anthocyanins and tannins, impacting the chemical and sensory composition of the wines (Casassa et al. 2013d, 2015). The chemical and sensory effects of different RDI protocols have been reported (Santesteban et al. 2011, Shellie 2014, Casassa et al. 2015). However, it is not known how differences in fruit chemistries arising from RDI interact, and if so, to what extent with regard to specific winemaking techniques.
Winemaking practices such as extended maceration (EM) have been found to enhance tannin extraction from seeds and less so from skins (Casassa et al. 2013a, 2013b). EM is probably the most used technique when the goal is to increase wine tannin concentration. However, EM increases hue and reduces wine color saturation (Yokotsuka et al. 2000, Casassa et al. 2013d). If application of EM is logistically prohibited, other winemaking practices such as saignée (i.e., bleed-off) can be applied to alter several phenolic classes simultaneously (Sacchi et al. 2005). Saignée, which consists of removing a portion of the must prior to the onset of fermentation, can be regarded as a manipulation (i.e., reduction) of berry size because it increases the solid (i.e., skins plus seeds)-to-pulp ratio. An early study manipulated the impact of the pulp by removing and adding juice (10% by volume) at crushing. In wines with 10% saignée, the study reported roughly proportional increments (i.e., ~10%) of anthocyanins but less than proportional increments of sensory attributes such as “tannin perception,” aroma, and red color of the resulting wines (Singleton 1972).
In the present study, we sought to uncover interactions between a vineyard practice that impacts berry size, such as RDI, and a winemaking technique that is carried out to emulate a different berry size to that originally present in the berry population (saignée). Because EM is known to alter the concentration and partitioning of wine tannins and anthocyanins, it was also included in the experimental design. Thus, fruit lots obtained after application of four different RDI protocols in the vineyard (100% ETc, 70% ETc, 25/100% ETc, and 25% ETc) were processed in the winery by applying EM, saignée, and a traditional maceration protocol. Herein, we focus on grape chemistry as well as on the extraction and evolution of anthocyanins, tannins, and wine color components during winemaking.
Materials and Methods
Vineyard site, grapes, and experimental design
The vineyard site and experimental design have been previously described (Casassa et al. 2013c). Briefly, the experiment was conducted during the 2012 growing season in the Cold Creek vineyard of Ste. Michelle Wine Estates, southeast of Mattawa, WA. Own-rooted Vitis vinifera cv. Cabernet Sauvignon (clone 8) planted in 1981 were trained to a bilateral cordon and spur-pruned to 70 nodes per vine. The vineyard was dripirrigated using pressure-compensated emitters (flow rate 4 L/hr) spaced 1.14 m apart. The soil type was homogenous within the experimental plot and consisted of loamy sand and gravel with a caliche vein. Four irrigation treatments were imposed at fruit set (growth stage 27). The current industry standard for RDI was used as a control to replenish 70% of full vine evapotranspiration (ETc) from fruit set through harvest and is referred to as 70% ETc. This standard was derived from a reference crop (grass) evapotranspiration (ET0) provided by the Washington State University AgWeatherNet weather station in Desert Aire, WA, and a variable crop coefficient, Kc (from ~0.3 at the start of treatments to ~0.8 in early August to ~0.4 by harvest), developed for fully irrigated Cabernet Sauvignon vines in eastern Washington: ETc = ET0 × Kc (Evans et al. 1993). Three other RDI treatments were also imposed from fruit set to harvest to replenish 100% ETc, 25% ETc, and then 25% ETc from fruit set to veraison followed by 100% ETc from veraison to harvest (25/100% ETc). The total cumulative irrigation supplied (in mm) relative to the 100% ETc treatment was 27, 47, and 74% lower in the 70% ETc, 25/100% ETc, and 25% ETc treatments, respectively (Supplemental Table 1). The experiment was designed as a randomized complete block with four replicated blocks (n = 4) and the irrigation treatments randomly applied within each block (≥6 rows each, each having between 40 and 66 vines per row, giving a total of between 240 and 462 vines per treatment replicate). Midday stem water potentials (Ψs), yield components, and pruning weights (a measure of plant vigor) were obtained from two vines per treatment replicate (n = 8) and are reported in Supplemental Tables 1 and 2.
Winemaking
On 26 Sept 2012, 280 kg of fruit from each vineyard replicate was manually harvested for a total of 4,480 kg (4 RDI treatments × 4 replicates each) and transported to the Washington State University research winery. Three maceration techniques were applied on the fruit collected from each RDI treatment as follows: control wines with a 10-day skin contact period, EM wines with a 30-day skin contact period, and saignée applied at a rate of 16% by volume within two hours after crushing (Harbertson et al. 2009) with a 10-day skin contact period. Each of the three maceration techniques was evaluated in duplicate using one of the four field replicates as replicate 1 and a combination of the other three field replicates in gravimetric proportion as replicate 2 of each RDI treatment. The winemaking experiment consisted of individual fruit lots of ~185 kg of fruit each allocated to 24 tanks. The fruit was crushed and destemmed using a Gamma model 40 RM destemmer crusher (Toscana Enologica Mori) and pumped to 300-L stainless steel jacketed fermentors (Ghidi) with a positive-displacement pump (Francesca). Sulfur dioxide (SO2) was added at a rate of 50 mg/L during the fermentor filling process. Diammonium phosphate was added to raise the yeast assimilable nitrogen to 225 mg/L. Musts were inoculated 4 hr after crushing with selected dry yeast (Lalvin EC-1118, Lallemand) at a rate of 250 mg/L. Malolactic bacteria (Lalvin VP41, Lallemand) were added 48 hr after yeast inoculation at a rate of 10 mg/L. Both the selected dry yeast and malolactic bacteria were hydrated following the manufacturer’s recommendation. Sugar consumption during fermentation was monitored daily with a hand-held densitometer (DMA 35N, Anton Paar) and tank temperatures were maintained at 26 ± 2°C at the fermentation peak using a web-based fermentation system (TankNet, Acrolon Technologies). Cap management consisted of a whole-volume tank pump-over followed by a 5 min gentle punch-down twice a day during active fermentation. Alcoholic fermentation was completed (reducing sugars <2 g/L) after eight to nine days in all wines, with fermentation curves showing good reproducibility of the duplicate fermentation kinetics for all treatments (Supplemental Figure 1). During postfermentation, EM wines received one 1 min punch-down per day, after which the tanks were sealed and sparged with N2 (30 L/min × 3 min). After completion of the skin contact time allotted for each treatment, free run wines were transferred to 100-L stainless steel tanks (Ghidi). Malolactic fermentation was monitored by enzymatic analysis of l-malic acid (Unitech Scientific) and was considered complete when the wines reached <0.1 g/L of malic acid. After completion of malolactic fermentation, the wines were racked, adjusted to 35 mg/L free SO2 and cold-stabilized for 45 days at 0 ± 2°C. Prior to bottling, the wines were adjusted to 0.6 mg/L molecular SO2. The wines were bottled at room temperature (20 ± 1°C) in 750 mL bottles sparged with N2 gas before and after filling (20 psi × 5 s), immediately sealed with screwcap closures (Stelvin Saranex liner, Amcor Corporation), and stored at 10 ± 2°C.
Chemical analysis
Reagents for determination of protein precipitable tannins and total phenolics included bovine serum albumin (BSA, Fraction V powder), sodium dodecyl sulfate (SDS; lauryl sulfate, sodium salt), triethanolamine, ferric chloride hexahydrate, and (+)-catechin, all purchased from Sigma-Aldrich (Harbertson et al. 2003). Briefly, determination of protein precipitable tannins is based on protein precipitation with BSA and is used to quantify tannins, polymeric pigments, and iron-reactive phenolics. By combining protein precipitation and bisulfite bleaching to distinguish anthocyanins from polymeric pigments, two classes of polymeric pigments in wines can be measured: small polymeric pigments (SPP) that do not precipitate with protein and large polymeric pigments (LPP) that do. The combination of SPP and LPP is equivalent to the SO2 resistant pigments in wine and is referred to as total polymeric pigments (TPP) anthocyanins via pH shift. l-malic acid (97%), l-lactic acid (85%, 13 M), glucose, and fructose were purchased from Sigma-Aldrich. Acetic acid (99.7%, 17 M) and HPLC-grade solvents were obtained from Merck. Malvidin-3-O-glucoside was purchased from Extrasynthèse.
Fruit and wine basic analysis and pomace analysis
The protocols followed for fruit and basic wine analysis and pomace sampling and analysis are reported elsewhere (Harbertson et al. 2009, Casassa et al. 2013b, 2013c). For pomace samples, anthocyanins and tannins recovered in the skins and seeds collected from the pomace after maceration were analyzed in each replicate (Harbertson et al. 2009).
Spectrophotometric analysis
Must and wine samples were treated with 1 mM sodium azide to inhibit microbial activity, centrifuged (5000 g × 5 min), and filtered through 0.22 μm filters (Fisher Scientific) prior to analysis. All spectrophotometric measurements were carried out with an Agilent 8453 UV-vis spectrophotometer (Agilent Technologies). Anthocyanins, SPP, and LPP were measured as described above (Harbertson et al. 2003). Tannins in the fruit, pomace, and wines were analyzed by protein precipitation. Wine color was characterized using the Cie-Lab system (Pérez-Caballero et al. 2003) with MSCV software (Grupo de Color de La Rioja).
HPLC-DAD-ESI-MSn analysis in wines
An Agilent 1100 series HPLC-DAD system (Agilent Technologies) was used for all chromatographic separations. A 6410 Triple Quadrupole LC/MS system (Agilent Technologies) equipped with an electrospray ionization system (ESI) was used for the confirmation of peak identity. Samples were filtered through cellulose acetate 0.22 μm syringe filters (Fisher Scientific) prior to analysis.
Analysis of sugars and acids
Malic acid, lactic acid, acetic acid, glucose, fructose, and glycerol were determined using a Hi-Plex H column (300 mm × 7.7 mm, Agilent Technologies) protected with a guard column of the same packing material. The isocratic separation solvent was 4 mM sulfuric acid applied for 42 min, maintaining a flow rate of 0.4 mL/min, and the column thermostated to 75°C during the separation. Compounds of interest were detected with a refractive index detector (model G1362A).
Analysis of phenolic compounds
Monomeric anthocyanins were determined with a modification of a published method (Downey and Rochfort 2008). Briefly, filtered samples (0.22 μm syringe filters, Fisher Scientific) were transferred to HPLC-auto sampler brown vials and separation was carried out using a Unison UK C-18 column (150 mm × 4.6 mm, 3-μm particle size, Imtakt US) thermostated at 40°C and protected by a Unison C-18 guard column of the same packing material. Monomeric anthocyanins were identified by mass spectroscopy and quantified as equivalents of malvidin-3-O-glucoside. Mass scans were performed from m/z 100 up to m/z 1000 in the positive ionization mode. Other ESI-MS conditions included dry gas (N2) at a flow of 11 L/min, heated capillary and voltage maintained at 350°C and 4 kV, respectively, and nebulizer set at 60 psi.
Sampling protocol
Spectrophotometric analysis of anthocyanins and tannins were performed at two-day intervals during skin contact, at pressing (day 10 and day 30), and at day 60 and day 120 post-crushing. Analysis of anthocyanins by HPLC and all other phenolic and chromatic measurements were performed at day 30 and day 120.
Data analysis
Prior to analysis of variance (ANOVA), the variance of each treatment was examined and found to be similar within treatments. The harvest fruit comparison of the RDI treatments was analyzed by one-way ANOVA (df = 3). A fixed-effect two-way ANOVA with interaction (df = 11) and a 5% level for rejection of the null hypothesis was used to analyze the effects of RDI treatment, winemaking treatment, and their interaction for all the chemical parameters. Fisher’s least significant difference (LSD) test was used as a post-hoc comparison of means for all the ANOVA analysis. For anthocyanin and tannin extraction, LSD is given when differences between any treatments are significant (p < 0.05). For analysis of anthocyanins by HPLC-DAD-MS, a fixed-effect one-way ANOVA was performed considering the 12 treatments resulting from the experimental design (df = 11). Data analysis was performed with XLSTAT v. 2011 (Addinsoft). The data set was also re-evaluated by principal component analysis (PCA), using the correlation matrix without rotation, by employing the Infostat statistical package (version 2012).
Results and Discussion
Basic fruit and phenolic chemistry
Analysis of pre- and postveraison midday stem water potentials (Ψs) confirmed that the four RDI treatments worked as intended and reflected differences in the water status of the vines of each RDI treatment (Supplemental Table 1). Table 1 shows the berry basic chemistry of the grapes as well as skin and seed phenolics on a fresh weight (FW) basis. Relative to 100% ETc, berry weight was reduced by 25% in 25% ETc and by 16% in 25/100% ETc, but it was not affected in 70% ETc, which is consistent with previous results (Casassa et al. 2013c). However, reduction of berry weight only reduced yield components in 25% ETc. In this treatment, yields were reduced to 2.4 kg/vine relative to 100% ETc (8.3 kg/vine), 70% ETc (7.2 kg/vine), and 25/100% ETc (7.1 kg/vine) (Supplemental Table 2). There were differences in Brix and pH values within RDI treatments although these were unlikely to be of relevance from a winemaking perspective. Conversely, titratable acidity was ~1.2 g/L lower in 25% ETc, which was mostly due to a reduction in malic acid in the fruit of this treatment (data not shown). Skin anthocyanins, on a FW basis, were 38% higher in 25% ETc relative to 100% ETc; however, analysis of the same results expressed on a per berry basis to uncover a possible biosynthetic effect (beyond the concentration effect derived from a reduction in berry FW) showed no differences within the treatments (p = 0.281, data not shown). Skin tannins were higher in 100% ETc and 25/100% ETc, and this increase was also observed on a per berry basis (p < 0.0001, data not shown), suggesting a biosynthetic effect on skin tannins of both RDI treatments. Seed tannins on a FW basis were higher in 25% ETc relative to the 100% ETc (Table 1) but, once again, this effect disappeared when seed tannins were expressed on a per berry basis (p = 0.084). These results confirm that the biosynthesis of seed tannins is not affected by RDI (Roby et al. 2004, Casassa et al. 2013c, 2015).
One-way ANOVA showing mean separation for berry weight, basic fruit chemistry, and phenolic composition of cv. Cabernet Sauvignon grapes subjected to four different regulated deficit irrigation (RDI) treatments. Averages ± SEM (n = 4).
Basic wine chemistry
Table 2 shows the basic analysis of the wines at bottling. Results were analyzed by a two-way ANOVA to show interaction(s) between the RDI and the winemaking treatments. Titratable acidity and ethanol levels reflected differences previously observed in the fruit titratable acidity and Brix, but pH was equivalent in all wines. Ethanol concentrations were higher in 70% ETc, consistent with higher Brix in the 70% ETc fruit. Likewise, glycerol concentrations were also higher in 70% ETc.
Two-way ANOVA showing mean separation for basic analysis of cv. Cabernet Sauvignon wines subjected to four different regulated deficit irrigation (RDI) treatments (vineyard treatment) and three maceration techniques (winemaking treatment) and their interaction. Averages ± SEM (n = 4).
In the winemaking treatments, EM wines showed comparatively higher pH values and acetic acid content. This occurred in spite of minimizing oxygen exposure by purging with N2 under lids. Nevertheless, the higher acetic acid content in EM wines is unlikely to be of sensory relevance because it was below 0.5 g/L. The glycerol content was lower in EM wines, followed by the saignée wines and reached its maximum in control wines. There were very few interactive effects between the RDI and winemaking treatments for the basic wine chemistries; these were limited to the lactic acid and glycerol content.
Anthocyanin extraction during maceration and post-bottling evolution
Figure 1 shows the separate effects of the four RDI treatments and the three maceration techniques on the extraction and evolution of anthocyanins. Anthocyanins were measured by spectrophotometry (Figure 1A), and to gain a closer look at the extraction pattern of individual anthocyanins, they were determined by HPLC-DAD-MS and thereafter grouped as a function of the aglycone moiety (Figure 1B). At day 5 post-crushing, malvidin derivatives were the predominant anthocyanidin form, accounting for 50 ± 2% of the total anthocyanin content, followed by delphinidin and petunidin derivatives (16 ± 1% and 16 ± 2%, respectively). There was no effect of either the RDI and/or the winemaking treatments on the percent distribution of the different anthocyanidins (p = 0.3545, data not shown). However, there were quantitative differences among the RDI treatments and the winemaking treatments. Both spectrophotometric and HPLC analyses indicated that anthocyanins peaked at day 5 post-crushing. At this point, the differences among the RDI treatments were as follows: 25% ETc ≥ 25/100% ETc ≥ 70% ETc > 100% ETc (p = 0.035). Among the winemaking treatments, saignée increased anthocyanins (relative to control wines) by 11, 24, 25 and 26% in 100% ETc, 70% ETc, 25/100% ETc, and 25% ETc, respectively (Figure 1B), averaging a 22% increase across all four RDI treatments. No effect of EM was observed at day 5 because EM and control wines were under the same winemaking protocol.
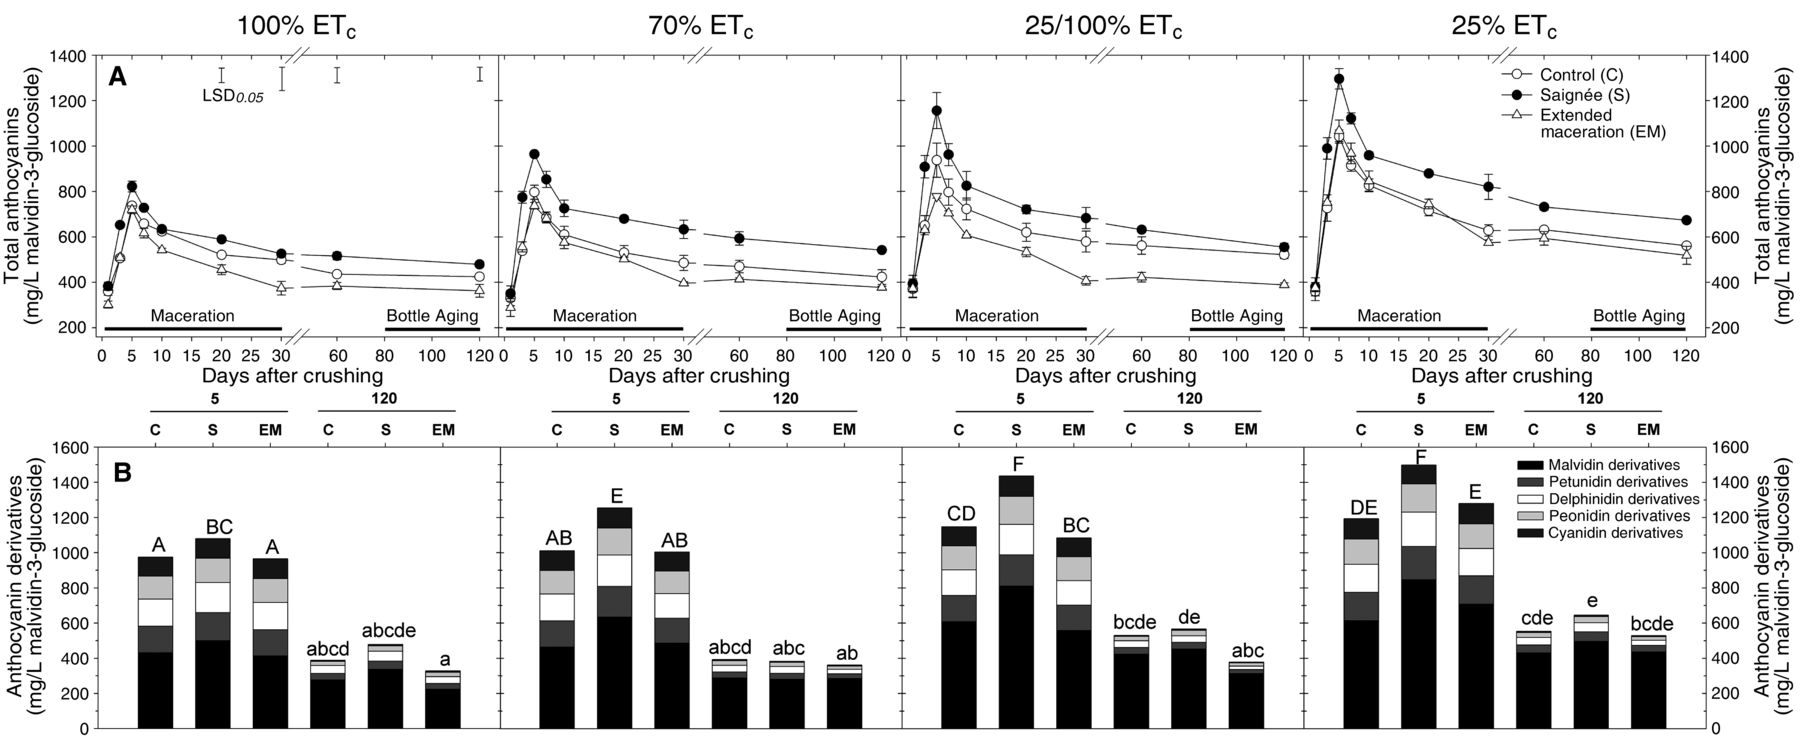
Extraction and evolution of (A) anthocyanins measured spectrophotometrically during maceration and bottle aging, and (B) monomeric anthocyanins grouped as a function of the aglycones moiety at day 5 (pressing) and day 120 post-crushing of cv. Cabernet Sauvignon wines subjected to four different regulated deficit irrigation (RDI) treatments (vineyard treatment) and three maceration techniques (winemaking treatment). Mean values ± SEM (n = 2). In (A), solid vertical bars in the top left of the figure represent the calculated LSD (p < 0.05) between any two given treatments. In (B), columns sharing one or more letters are not statistically significant for Fisher’s LSD and p < 0.05. C: control wines; S: saignée wines; EM: extended maceration wines.
From day 5 to day 120, anthocyanins (as measured by HPLC) decreased by 39% across the different wines, following a pattern of decrease that has been described as logarithmic (Dallas et al. 1995). There was no effect of the RDI treatments on the percentage decrease of anthocyanins during the post-maceration and bottle aging stage (p = 0.4753). Anthocyanins decreased by 32% after 120 days in control wines, but significantly more so in EM wines (41%) and in saignée wines (43%) (p = 0.0493). Although statistically indistinguishable from each other, the biochemical reasons that underpin these decreases in anthocyanins in EM and saignée wines relative to control wines are different. In EM wines, loss of anthocyanins occurred during the postfermentation period of extended skin contact, between days 10 and 30 post-crushing (Figure 1A). This decrease in anthocyanins during EM has been reported elsewhere (Harbertson et al. 2009, Casassa et al. 2013b, 2013c) and is attributed to a combination of factors, including adsorption of anthocyanins to fermentation solids, oxidative degradation, and formation of polymeric pigments (reviewed in Casassa and Harbertson 2014). Previous work showed that pyranoanthocyanins (vitisins A and B), which would be counted as polymeric pigments, were unaffected by EM (Casassa et al. 2013b). Saignée wines were produced with a 10-day skin contact period, and anthocyanin losses relative to control wines occurred from pressing onward. Notably, for 100% ETc and 25/100% ETc, these losses resulted in equivalent concentrations of anthocyanins in control and saignée wines at day 120 post-crushing. The HPLC analysis also showed an overall lack of difference in anthocyanins among winemaking treatments belonging to the same RDI treatment by day 120 (p = 0.1182) (Figure 1B). Inconsistent effects of saignée in increasing anthocyanin content have been credited to compositional differences in the fruit (Gawel et al. 2001), and this is consistent with the reported differences in phenolics among the four RDI treatments (Table 1). However, the reasons as to why a transient effect of saignée on anthocyanin concentration is observed remain speculative. For example, Sacchi et al. (2005) argued that anthocyanin extraction during saignée is not limited by solubility because should solubility set the limit for extraction, the effect of saignée would be counter to that (there would be less liquid to dissolve the anthocyanins). This was not observed in the present experiment during the maceration period in which more anthocyanins were initially extracted during saignée between days 5 and 10 (Figure 1A). Moreover, solubility of anthocyanins may be contingent upon factors that may have herein varied from day 5 onward. For example, the enhanced solubility of anthocyanins during saignée at day 5 may have been caused by temperature, which peaked at day 4 to 28.6 ± 0.2°C but quickly decreased thereafter by day 9 to 24 ± 0.2°C (Supplemental Figure 1). In addition, variations in ethanol content affect the extent of copigmentation (Hermosín Gutiérrez 2003), which in turn regulates the formation of polymeric pigments and overall anthocyanin stability. Last, control and saignée wines had different tannin concentrations, and this can modulate anthocyanin retention (Kilmister et al. 2014), perhaps by affecting the rate of polymeric pigment formation. It is likely that the comparatively greater decrease in anthocyanins observed in saignée wines may have been caused by the incorporation of anthocyanins into polymeric pigments. Indeed, polymeric pigments are covalent adducts formed by anthocyanins and tannins, which are not resolved under a standard HPLC procedure to measure monomeric anthocyanins (Jeffery et al. 2008). We further explored this possibility in the next section.
Pomace samples were analyzed for recoveries of anthocyanins after maceration in each treatment (Table 3). The proportion of extracted anthocyanin into wine was calculated factoring in the initial anthocyanin content of the fruit (determined on a FW basis), the anthocyanin concentration of the wines at the end of the skin contact period, and the anthocyanins that were recovered in the pomace after maceration. Overall extraction of anthocyanins ranged from 40 to 73%, and the proportion recovered in the pomace ranged from 8 to 11%, which leaves a portion of “missing” anthocyanins unaccounted for. We hypothesize that these “missing” anthocyanins are those that have been captured as polymeric pigments and/or are lost during maceration due to oxidation and/or electrostatic adsorption to other fermentation solids such as yeast hulls and bitartrate crystals and/or stem remnants. The RDI treatments had a minor influence on the proportion of extracted anthocyanins. However, quantitative differences in wine anthocyanins among RDI treatments were observed (Figure 1), suggesting that in the wines of each RDI treatment, extraction was roughly proportional to the initial anthocyanin content of the fruit of each RDI treatment.
Two-way ANOVA showing mean separation for the proportion of extracted anthocyanins, total tannins, skin, and seed-derived tannins and proportion of tannin bound at press of cv. Cabernet Sauvignon wines subjected to four different regulated deficit irrigation (RDI) treatments (vineyard treatment) and three maceration techniques (winemaking treatment) and their interaction. Averages ± SEM (n = 4).
The effect of the winemaking treatments on anthocyanin extraction was clear. Saignée resulted in increased anthocyanin extraction, whereas EM had the opposite effect. Interestingly, EM wines had the lowest anthocyanin content (Figure 1A and B), but also less anthocyanins were recovered in the pomace after EM. This suggests that re-adsorption of anthocyanins onto grape pomace cannot account for the missing anthocyanins in EM wines (Casassa et al. 2013b). Previous research has suggested that this portion of missing anthocyanins during EM would remain unaccounted for due to anthocyanins being covalently linked to tannins to form polymeric pigments (Casassa et al. 2013b). However, in the present work, neither SPP nor LPP were enhanced in EM wines (Table 3), suggesting that a true degradation of anthocyanins, probably oxidative in nature, may have taken place during the extended maceration stage in these wines.
Tannin extraction during maceration and post-bottling evolution
Figure 2 shows the extraction and evolution of protein precipitable tannins. Tannins peaked when each winemaking treatment was pressed and remained stable thereafter. Irrespective of the RDI treatment, EM wines showed enhanced tannin extraction relative to controls (p < 0.0001). At pressing of EM wines (day 30), tannins were 61, 33, 41, and 66% higher than in the controls of the 100% ETc, 70% ETc, 25/100% ETc, and 25% ETc treatments, respectively. The overall increase in wine tannins achieved by EM was 50% on average across the four RDI treatments.

Extraction and evolution of protein precipitable tannins during maceration and bottle aging of cv. Cabernet Sauvignon wines subjected to four different regulated deficit irrigation (RDI) treatments (vineyard treatment) and three maceration techniques (winemaking treatment). Mean values ± SEM (n = 2). Solid vertical bars in the top left of the figure represent the calculated LSD (p < 0.05) between any two given treatments.
Saignée also increased tannin content relative to the control wines (p = 0.0022) by 31, 33, 12, and 21% for the 100% ETc, 70% ETc, 25/100% ETc, and 25% ETc treatments, respectively. The average increase in wine tannins achieved by saignée was 24% on average across the four RDI treatments. In a previous experiment with Merlot, saignée (at 16% by volume) increased tannin content in an approximate proportional fashion (18%) relative to the amount of juice removed (Harbertson et al. 2009). In contrast, the relative increase in tannin content of the saignée treatment observed here occurred in a more than proportional fashion to the amount of juice removed in all but in the 25/100% ETc treatment. Indeed, the wines made from fruit with the higher berry weight (100% ETc and 70% ETc, Table 1) were those that benefited the most from the saignée treatment from the perspective of tannin extraction. Thus, the effect of saignée was more marked than the expected proportional response to the volume of must drawn (that is, 16%) in 100% ETc and 70% ETc. However, skin and seed tannin extraction was higher in 25/100% ETc, and seed tannin extraction was the highest in 25% ETc. In addition, berry weight was lower in these two RDI treatments, and consequently, the effect of saignée on wine tannins was less pronounced. This suggests that skin and seed tannins cannot be concentrated indefinitely and that there may be a limit to their extraction and retention into the wine matrix that may be set by solubility and/or modulated by interactions with other wine components such as anthocyanins.
Pomace samples were also analyzed for recoveries of tannins after maceration in each treatment (Table 3). The proportion of skin- or seed-derived tannins extracted into wine was calculated as the difference between what was found in either the skins or the seeds at harvest and the amount left in the pomace divided by the estimated amount of tannin extracted (Harbertson et al. 2009). The 100% ETc treatment extracted more tannins than the other RDI treatments. This higher extraction may explain why 100% ETc wines have equivalent absolute values of wine tannins relative to the other three RDI treatments even though 100% ETc fruit had the lowest seed tannin concentration (Table 1). Moreover, in 100% ETc wines, tannins were extracted mainly from the skins (56%). In the other three RDI treatments, seed tannin extraction was favored instead. As skin tannins are easier to extract than seed tannins (Harbertson et al. 2009), the comparatively higher tannin extraction in 100% ETc treatment can be assumed to be a function of a comparatively higher skin tannin concentration in the fruit of this treatment, a fact that was indeed observed (Table 1). It is not clear why this effect was not observed in 25/100% ETc, which also had comparatively higher skin tannins. The nature of these inconsistencies pertaining to tannin extraction and retention may be explained by other matrix effects such as interactions between tannins and cell wall components (Adams and Scholz 2008), polysaccharides, and/or mannoproteins (Rodrigues et al. 2012). The potential effect of the wine nontannin matrix on tannin retention is further explored toward the end of this section.
Regarding the winemaking techniques, the percentage of tannins extracted into wine was as follows: EM > saignée > control. In EM wines, tannin extraction was driven mainly by seed tannins, which accounted for 73% of the extraction. Conversely, control wines had an equivalent proportion of skin- and seed-derived tannin extraction. Similar results have been observed in previous experiments with EM in Merlot and Cabernet Sauvignon (Harbertson et al. 2009, Casassa et al. 2013c). Importantly, saignée also increased the proportion of extracted tannins relative to the control treatments, but, unlike EM, saignée maintained a balanced proportion of skin- and seed-derived tannins. Thus, while EM increased tannin extraction by favoring seed extraction, saignée favored an equivalent extraction from both skin- and seed-derived tannins.
Table 3 also shows the proportion of tannin bound for each RDI and winemaking treatment. These calculations were based on the theoretical extraction of wine tannins (based on what was found in the pomace after maceration), the observed or actual extraction measured in the wines, and the initial (total) fruit tannin content. The proportion of tannin bound by the wine matrix ranged from 12 to 20%, but neither the RDI nor the winemaking treatments affected it. A previous report on Cabernet Sauvignon indicated that ~22% of fruit tannins remained bound to the insoluble wine matrix (Hazak et al. 2005). A recent study found that the proportion of tannin bound was not affected by any of four RDI treatments applied to Cabernet Sauvignon grapes but was instead affected by seasonal differences within three years of study (Casassa et al. 2015). The results herein concur with these reports.
Polymeric pigments and chromatic properties
Observed differences in the anthocyanin and tannin content (Figure 1A and 1B) and in the extraction rates of anthocyanins and tannins caused by the RDI and winemaking treatments (Table 3) were expected to impact both the formation of polymeric pigments (Table 4) and the chromatic features of the wines (Table 5). The immediate and long-term effects caused by the RDI and/or the winemaking treatments on these variables were analyzed at the end of maceration of the EM wines (day 30) and at day 120 post-crushing, respectively. An overall 30% increase of TPP was observed in all wines from day 30 to day 120 and this occurred concomitantly with a decrease in wine color saturation of 8.4% and of the red color component (a*) (8%) (Table 5), together with the aforementioned decrease observed for anthocyanins (Figure 1A and 1B).
Two-way ANOVA showing mean separation for values of small polymeric pigments (SPP), large polymeric pigments (LPP), and total polymeric pigments (TPP) at day 30 and day 120 post-crushing of cv. Cabernet Sauvignon wines subjected to four different regulated deficit irrigation (RDI) treatments (vineyard treatment) and three maceration techniques (winemaking treatment) and their interaction. Averages ± SEM (n = 4).
Two-way ANOVA showing mean separation for Cie-Lab chromatic parameters at day 30 and day 120 post-crushing of cv. Cabernet Sauvignon wines subjected to four different regulated deficit irrigation (RDI) treatments (vineyard treatment) and three maceration techniques (winemaking treatment) and their interaction. Averages ± SEM (n = 4).
Both the RDI and the winemaking treatments affected the formation of SPP, LPP, and TPP, the latter resulting from the summation of SPP and LPP values. SPP are formed primarily by reaction of anthocyanins with miscellaneous compounds, including (but not limited to) acetaldehyde, pyruvic acid, and flavan-3-ol monomers or dimers, resulting in low molecular weight pigments that do not precipitate the BSA protein used in the method to assess tannins. Conversely, LPP are pigmented tannins that precipitate with BSA, and they reportedly contribute to perceived astringency. From this perspective, higher astringency is anticipated when a preferential formation of LPP over SPP is observed (Casassa et al. 2013c). Last, the combination of SPP and LPP is equivalent to the SO2 resistant pigments in wine and is referred to as TPP. The 25% ETc treatment had higher SPP, LPP, and TPP values than the other treatments at both day 30 and day 120 post-crushing. The formation of polymeric pigments is mediated by, among other factors, the molar proportion of anthocyanins and tannins. A recent study in Shiraz found that the fruit anthocyanin concentration correlated with wine tannin concentration, wine color, and polymeric pigment formation (Kilmister et al. 2014). This was hypothesized to occur due to the capacity of anthocyanins to form polymeric pigments with tannins, thereby favoring anthocyanin retention in wine. As shown in Table 1, anthocyanins were highest in 25% ETc fruit. Interestingly, wine color saturation was highest in 25% ETc wines as well, suggesting that a relative molar excess of anthocyanins in the fruit can lead to enhanced polymeric pigment formation and increase of wine color.
Significant effects were also observed as a function of the winemaking treatments. The formation of LPP was initially higher in saignée wines at day 30, but these differences were no longer apparent by day 120. From day 30 to day 120, saignée favored SPP and resulted in higher TPP formation than in controls and EM wines by day 120. Previous research has established the preferential formation of SPP over LPP whenever anthocyanins are in higher relative amounts than tannins (or with low relative amounts of tannins) (Casassa et al. 2013c), a condition herein observed in saignée wines. In these wines, the preferential formation of SPP may have implications for perceived astringency because, unlike LPP, SPP cannot precipitate proteins and thus would be unlikely to elicit astringency (Harbertson et al. 2003). Moreover, at day 120, saignée wines shared basically the same chromatic properties as the control wines. Thus, a higher relative reduction in wine color saturation occurred in saignée wines from day 30 to day 120, a situation often observed when the saignée technique is applied (Gawel et al. 2001). The EM wines, however, had equivalent polymeric pigment content and composition compared to control wines but had significantly lower color saturation and red color component, confirming previous reports on the negative impact of EM on wine color (Casassa et al. 2013a, 2013b, 2013c).
Individual and combined effects of the RDI protocols and the winemaking techniques
Figures 3 and 4 provide an overview of the percentages of increase or decrease of each phenolic family and chromatic measurements, using as a basis for comparison the RDI industry standard treatment for the vineyard experiment (i.e., 70% ETc) (Figure 3) and control wines for the winemaking experiment (Figure 4). Both at day 30 and day 120, 25% ETc and 25/100% ETc increased all phenolics (with only the exception of tannins) by a variable amount of 4 to 55% and by 2 to 17%, respectively. In 100% ETc wines, a decrease in all the measurements ranging from 2 to 18% was observed relative to 70% ETc with the sole exception of tannins, which were between 8 to 14% higher than in the other RDI treatments. To put these percentages in perspective, again using 70% ETc as a baseline, yields were 15% higher in 100% ETc, whereas yields were 1.5% lower in 25/100% ETc and 66% lower in 25% ETc relative to 70% ETc (Supplemental Table 2). Since 25/100% ETc did not cause a significant reduction in yields but generally positively impacted most phenolic and chromatic parameters, it emerged as the most favorable RDI treatment from the perspective of phenolic retention and wine color.

Percentages of increase/decrease of color and phenolic parameters in 100% ETc, 25/100% ETc, and 25% ETc relative to 70% ETc of cv. Cabernet Sauvignon wines at day 30 and day 120 post-crushing. SPP: small polymeric pigments; LPP: large polymeric pigments; TPP: total polymeric pigments.

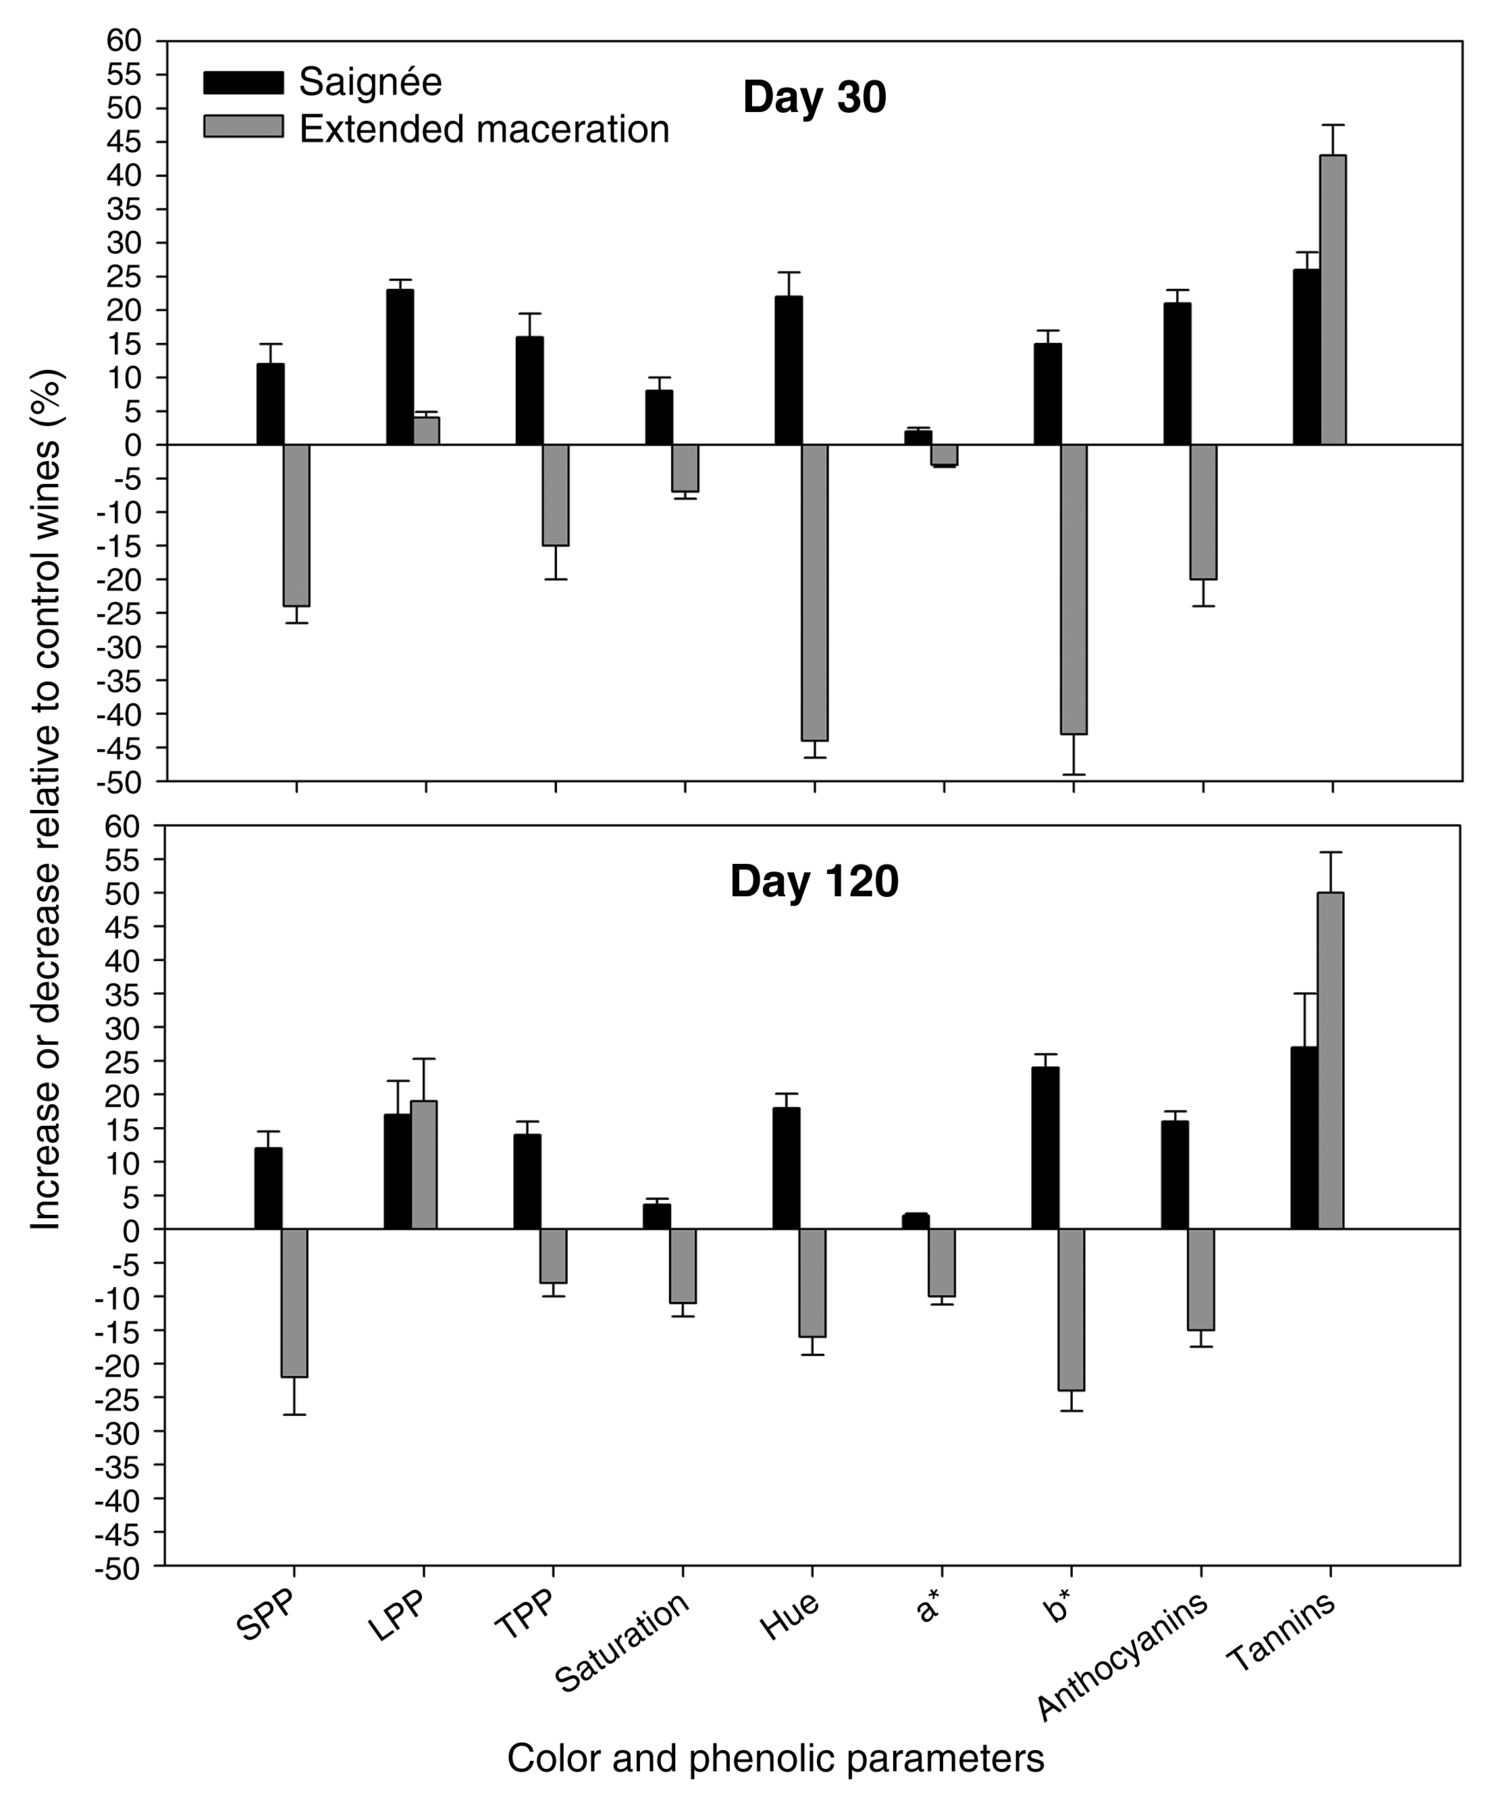
Percentages of increase/decrease of color and phenolic parameters in saignée and extended maceration cv. Cabernet Sauvignon wines at day 30 and day 120 post-crushing. SPP: small polymeric pigments; LPP: large polymeric pigments; TPP: total polymeric pigments.
EM caused a decrease of all the phenolic and chromatic parameters both at day 30 and day 120 (the only exception being that of tannins). However, at day 120 these differences were slightly diminished compared to the control. Tannins were between 47 to 53% higher in EM wines relative to control wines. Counter to what was observed for EM, saignée increased all the phenolic and chromatic parameters relative to control wines by 3 to 25%. Notably, even though saignée was applied at a rate of 16%, a higher than proportional increase was observed for LPP, TPP, hue, anthocyanins, and tannins relative to control wines.
Figure 5 provides an overview of the combined effect of the RDI and winemaking treatments at day 120 by means of a PCA in which all the phenolic and chromatic parameters were included. The PC1, which accounted for 67% of the variability of the data, separated the wines as a function of the winemaking treatments. EM wines were located on the negative side of PC1, almost solely related to protein precipitable tannins. Control wines shared the central location of the PCA together with the saignée versions of 100% ETc and 70% ETc. Moreover, the saignée versions of 100% ETc and 70% ETc were located in the proximity of the control versions of these same RDI treatments. The saignée treatments of 25/100% ETc and 25% ETc, together with the control of 25% ETc, clustered in the far end of the positive side of PC1. These wines were defined by attributes such as total anthocyanins, malvidin derivatives, SPP, TPP, wine color saturation, hue, and b*. The PC2, which accounted for ~17% of the variability of the data set, separated the wines as a function of the RDI treatments. As a trend, 100% ETc and 70% ETc were located in the positive side of PC2, whereas 25/100% ETc and 25% ETc were located in the negative side. Also of note was that control and saignée wines of each RDI treatment were clustered closer to each other than control and EM wines, suggesting that EM, unlike saignée, caused changes that persisted after 120 days, namely, the increased tannin content.

Principal component analysis of color and phenolic data at day 30 of cv. Cabernet Sauvignon wines subjected to four different regulated deficit irrigation (RDI) treatments (vineyard treatment) and three maceration techniques (winemaking treatment). SPP: small polymeric pigments; LPP: large polymeric pigments; TPP: total polymeric pigments; HPLC: anthocyanins measured by HPLC-DAD-MS; S: anthocyanins measured by spectrophotometer.
Conclusions
The present experiment explored the individual and combined effects of four RDI treatments and three maceration techniques. None of the four RDI treatments affected anthocyanin extraction: the amount of anthocyanins extracted into the wines was roughly proportional to the initial anthocyanin content in the fruit derived from each treatment. Thus, quantitative differences in anthocyanin extraction favored 25% ETc and 25/100% ETc wines. Likewise, there was no effect of the RDI treatments on tannin extraction. Saignée increased the anthocyanin content at day 5, but these differences subsided by day 120 irrespective of the RDI treatments, which translated into equivalent wine color saturation in saignée and control wines. Saignée also increased tannin content relative to the control wines and these differences were long-lasting. The results also suggest that from the perspective of tannin extraction, the effect of saignée was more pronounced when applied to fruit lots having larger berry weight (100% ETc:1.01 g/berry; 70% ETc:0.96 g/berry). The application of EM reduced anthocyanins and wine color saturation but increased tannin extraction from seeds. Conversely, control and saignée wines had equivalent proportions of skin- and seed-derived tannins. Overall, the effect on phenolic and chromatic measurements of the winemaking techniques applied in the winery was more evident and long-lasting than that of the RDI treatments applied in the vineyard.
Several practical implications can be established from these results. First, RDI treatments that supply 25% or less than the full ETc will be expected to significantly reduce crop yields. For treatments such as 25% ETc entailing a 66% reduction in crop yields, the differential gain in phenolics and color parameters did not outweigh the reduction in crop yields. Thus, less onerous winemaking practices (such as saignée, where the removed juice can be diverted to the production of rosé wines) applied to higher yielding fruit (which consequently may have higher berry weight) may achieve similar results without compromising yields in the vineyard. Alternatively, if the production goal is to reduce water usage while favoring phenolics and maintaining yields, treatments such as 25/100% ETc should be favored. Second, the results presented here suggest that the effect of saignée is contingent upon berry size, but the causal factors behind variation in berry size need to be put in perspective. In this experiment, differences in berry size occurred due to the application of different RDI protocols as opposed to other potential causes of berry size variation (such as seasonal variations or intracluster variations). For RDI protocols leading to a reduction in berry FW, a less pronounced effect of saignée would be expected during winemaking, although the same conclusion may not extrapolate to other agronomical situations leading to variations in berry size (e.g., buds/vine, cluster thinning, canopy exposure, etc.). Unlike saignée, the effect of EM seems to be insignificant with regard to berry size, but seed tannin concentration in the fruit (derived for reduction in FW) may accentuate its effects by bolstering tannin extraction. Moreover, different mouthfeel properties should be expected in saignée and EM wines, which may be due not only to differences in the total amount of tannin present in each wine, but also to the proportion of skin- and seed-derived tannins. Last, while saignée may be a valid practice to increase tannins, thereby circumventing logistic issues associated with EM, a decrease in anthocyanins over time, possibly related to enhanced formation of polymeric pigments, is to be expected. If polymeric pigments are unequivocally proven to be responsible for specific mouthfeel properties, then specific mouthfeel features may be obtained with this practice.
Acknowledgments
The authors are grateful to Ste. Michelle Wine Estates (SMWS) and particularly to Russ Smithyman and Bill Riley for the generous donation of fruit and labor for this project. The authors also extend their gratitude to Markus Keller, Pascual Romero, Alan Kawakami, and Lynn Mills for collecting weather data, yield components, and pruning weights and helping with the analysis of fruit data. Christopher Beaver and Maria Mireles are thanked for assistance with the collection of wine phenolic data. LFC is thankful to the Fulbright Commission and the Walter Clore scholarship for financial support. The Wine Advisory Committee, the Washington Wine Commission, the Washington Grape and Wine Research Program, and the WSU Agricultural Research Center are thanked for funding this research.
Footnotes
Supplemental data is freely available with the online version of this article at www.ajevonline.org.
- Received November 2015.
- Revision received March 2016.
- Accepted March 2016.
- Published online July 2016
- ©2016 by the American Society for Enology and Viticulture
Literature Cited
Vol 67 Issue 3


Jump to section
Related Articles
Cited By...
More from this TOC section
Similar Articles
