


Abstract
Until recently, the foliar forms of grape phylloxera have been absent or very rare in California, and nodosities have not been common on resistant rootstocks. Foliar phylloxera are now widely spread in the mothervine plantings of grape rootstock nurseries in Yolo and Solano counties. Nodosities on resistant rootstocks have also been frequently observed. To determine the genetic relationships within and among these seemingly new types of phylloxera, collections were made across California from 2009 to 2011. Foliar-feeding phylloxera strains were collected from rootstock mothervines at the National Clonal Germplasm Repository in Winters, CA; University of California, Davis (UCD), vineyards; and six commercial rootstock nursery plantings in Yolo and Solano counties. Root-feeding samples were collected from a rootstock trial at the UCD Oakville research station vineyard in Napa County, which had previously been sampled in 2006 and 2007. Root-feeding samples were also collected from commercial vineyards in Napa and Sonoma counties and UCD vineyards. All samples were tested and genotyped using simple sequence repeat markers, and the genetic structure of the populations was analyzed. The results identified four genetically distinct populations of phylloxera in California, which were named Davis, Foliar, Napa1, and Napa2. Davis, Napa1, and Napa2 were composed of root-feeding samples. Multilocus genotypes with identical DNA-fingerprint profiles were detected in the 2006 to 2007 samples from the Oakville research station. More genetic divergence was observed in the Davis, Napa1, and Napa2 populations, with evidence for sexual reproduction between members of Napa1 and Napa2. The Foliar population consisted of only foliar-feeding samples with multilocus genotypes that were not detected prior to 2009; asexual reproduction was clearly the primary reproductive mode.
Grape phylloxera, Daktulosphaira vitifoliae Fitch (Hemiptera: Phylloxeridae), has been a destructive viticultural pest since its accidental importation from North America to Europe and subsequent movement to almost all of the world’s grapegrowing regions (Granett et al. 2001). Grape phylloxera typically feed on three different grape tissues: pocket-like galls are produced when they feed on young leaf tissue, hooked galls (nodosities) form when they feed on young feeder roots, and swollen galls (tuberosities) form when they feed on larger structural roots. When tuberosities swell and crack, soil-borne fungi enter the roots, leading to the destruction of the structural root system and death of the plant (Omer et al. 1995). The roots of the European grape, Vitis vinifera L., are highly susceptible to phylloxera feeding at the tuberosity and nodosity levels. The North American Vitis species allow only leaf and root-tip feeding that does not normally result in destructive vine damage, allowing their use as rootstocks and cultivation of grapes in phylloxera-infested soils (Granett et al. 2001).
Inadvertent introduction of grape phylloxera from eastern states into California forced rapid use of rootstocks and research to determine which were most suitable. Extensive rootstock trials were initiated in the early 1900s at research stations across the state. Among 18 tested rootstocks, AxR#1 (V. vinifera ‘Aramon’ × V. rupestris ‘Ganzin’) was considered to be a broadly adaptable rootstock with consistently high vigor and yields. AxR#1 became the primary rootstock in the north coastal counties of California during the 1970’s vineyard expansion, despite reports of poor performance on low-vigor sites with heavy phylloxera infestations (Lider 1958) and knowledge of AxR#1 failing to phylloxera in France, Italy, and South Africa after ~15 years of use (Granett et al. 2001). In 1984, the first signs of AxR#1’s collapse to phylloxera feeding were noted. Over the next 10 years, ~50,000 acres of vineyards planted on AxR#1 were destroyed (Granett et al. 1985, 1987, De Benedictis and Granett 1992, De Benedictis et al. 1996). The blame was first placed on a new strain of phylloxera, Biotype B, which was presumed to have mutated from a strain incapable of feeding on AxR#1—Biotype A. However, research on Biotype B phylloxera revealed that it was not a single strain but instead a mixture of genetically different strains with the ability to damage AxR#1 roots (Fong et al. 1995). The existence of phylloxera strains with rootstock-specific feeding adaptation was first reported in Germany by Börner (1914).
The failure of AxR#1 in northern California led to extensive replanting of vineyards with alternative resistant rootstocks. Once a vineyard is removed, grape roots can survive for many years deep in the soil profile (Bell et al. 2009) where they could provide a food source for phylloxera by producing small rootlets and callus. Planting alternative rootstocks over remnant AxR#1 roots has the potential of exposing Biotype B phylloxera to new host-based selective pressures. These pressures could have had many impacts on existing phylloxera strains, including altered feeding behavior, changes in genotype frequency of existing types, and selection for new phylloxera genotypes, all of which would have created more genetic diversity. The role of host plants in increasing genetic diversity is well established in other aphid species (Via 1999, Peccoud et al. 2009, Jaquiery et al. 2012), and host specific phylloxera genotypes have been identified in Australia (Corrie et al. 2003). Phylloxera strains found in California vineyards have generally lacked the ability to form leaf galls (Granett et al. 2001). However, a recent outbreak of foliar phylloxera in California’s Yolo and Solano counties (M.A. Walker, personal communication, 2009) indicates that foliar strains with altered feeding behavior might have been the result of selection pressure or they were introduced to California from other regions. Australian studies have also found genotypes specific to foliar galls (Corrie and Hoffmann 2004). An examination of genetic and behavioral differences in the recently discovered foliar phylloxera might help explain how phylloxera adapt to new host tissues or host plants and clarify differences between root and foliar phylloxera genotypes.
Determining whether grape phylloxera’s reproductive mode contributes to genetic diversity is also important. Studies of aphid sexual/asexual cycles have led to a better understanding of their evolutionary and adaptive history and of the stimuli involved in inducing sexual reproduction (Simon et al. 1999, Delmotte et al. 2002). Previous studies of phylloxera’s reproductive mode found that in Europe (Vorwerk and Forneck 2006), Australia (Corrie et al. 2002), and California (Lin et al. 2006), the asexual life cycle predominates; although, sexual reproduction may still play a role in the introduction of new diversity (Forneck and Huber 2009). Previous studies investigated the reproductive mode of California phylloxera, but these studies used relatively limited numbers of samples (Lin et al. 2006, Islam et al. 2013).
The study presented here examined over 400 samples in an attempt to better understand phylloxera’s overall genetic diversity in northern California. This information will help determine if recently discovered phenotypic differences in California phylloxera are due to adaptation or new introductions. The study had two objectives: 1) to use simple sequence repeat (SSR) markers to determine the genetic diversity and relationships of both root and foliar phylloxera samples collected in California, and 2) to understand the genetic origin of recent infestations of leaf-galling phylloxera. Genetically differentiated strains can then be used in root assays to determine whether feeding behaviors are associated with observed genetic differences. This information may help predict outbreaks of new, more-aggressive strains and help rootstock breeders combat them. To achieve these objectives, root phylloxera samples were collected from vineyards across Napa and Sonoma counties. Samples of foliar phylloxera collected from Yolo and Solano counties were compared with the root phylloxera samples. The data were also evaluated to determine if sexual reproduction was a contributing factor to observed genetic diversity.
Materials and Methods
Sample collection
Foliar phylloxera samples were collected between 2009 and 2011 from the National Clonal Germplasm Repository (NCGR) located near Winters, CA; the Foundation Plant Services (FPS) vineyard located at the University of California, Davis (UCD); six commercial rootstock nurseries in Yolo and Solano counties (YSF1 to YSF6); and a 1103P rootstock shoot in Napa County, CA (NCS4). Three additional foliar phylloxera samples were collected from shoots of rootstocks in Napa (ONaF), Mendocino (OMeF), and Monterey (OMoF) counties in 1998 and 1999 (Table 1). The host plants for the foliar samples were 1103P, 101-14Mgt, St. George, 110R, several American species hybrids, and V. vinifera accessions maintained in the NCGR. From each sampling location, infested leaves from one or two shoots of each plant were harvested, placed in sealable plastic bags, and kept cool until further use. Foliar galls were opened under a 10X dissecting microscope (Leica EZ4D) using sterilized equipment. A preferred leaf-gall sample consisted of a single adult with 20 to 50 eggs. Both adults and eggs were taken from the galls and placed in 1.5 mL Eppendorf tubes. For some samples, two adults with 20 to 50 eggs, 30 to 50 eggs only, or 3 to 5 crawlers were used when the preferred sample was unavailable. Collected samples were stored at −20°C prior to DNA extraction.
Host-plant and collection location information of five reference phylloxera samples used in both study batches. WEO4802 was collected from a foliar gall; the other four were collected from root galls.
Root phylloxera samples were collected primarily from a rootstock trial at the south vineyard of the UC Davis Oakville research station (UCDORS). These samples were collected during summer 2006, winter 2007, and summer 2011. Samples were also collected in 2006 and 2007 from a nearby irrigation trial with 5C, 1103P, and 101-14Mgt rootstocks. In 2011, samples were collected from the irrigation trial, a block planted with St. George rootstock, and the rootstock trial. Additional phylloxera-infested root samples were obtained from three Napa County commercial vineyards (NCS1 through NCS3); two commercial vineyards in Sonoma County (SCS1 through SCS2); and from the UC Davis Viticulture and Enology vineyards (UCDV&E) (Table 1). Infested roots were collected by digging a 15 × 30 cm hole in the soil at the periphery of a drip emitter’s wetted zone. Roots were examined for the presence of galling. Samples containing root galls were placed in sealable plastic bags along with slightly moist soil to prevent the roots from drying during transport. Root samples were examined under a 10X dissecting microscope using sterilized equipment, and phylloxera samples were extracted from tuberosities (when available) or from nodosities. The preferred root phylloxera sample consisted of a single adult or a single adult with 10 to 15 eggs. When preferred samples were not available, galls with two adults, one to five crawlers, or 15 to 25 eggs were used. Samples were kept in 1.5 mL Eppendorf tubes and stored at −20°C prior to DNA extraction.
Four single-adult lineage lines were created and maintained in petri-dish culture (De Benedictis and Granett 1992, De Benedictis et al. 1996). These lines were sourced from phylloxera eggs found on the roots of four different hosts: V. vinifera Chardonnay, AxR#1, 101-14Mgt, and Freedom (Table 2). Eggs from each root host were transferred onto excised V. vinifera Colombard roots maintained in 15 × 100 mm petri dishes. During the initial generation, only one adult was allowed to develop per petri dish. Eggs from this single adult were transferred to new plates of excised roots and were allowed to develop multiple adults that were used to generate later generations. In this way, large populations of phylloxera originating from a single adult could be maintained.
Sampling locations, code names, and number of phylloxera samples collected for SSR genotyping and analysis. Samples were separated by host tissue (root versus leaf) and collection batch (A and B).
DNA extraction and genotyping
DNA extractions were carried out following Lin and Walker (1996). DNA samples were stored at −20°C prior to any genotyping work. Fifteen fluorescently labeled SSR primer pairs (6-FAM, HEX or VIC, and NED) were used to amplify phylloxera genomic DNA (Supplemental Table 1). The PCR amplifications were performed in 10 μL reactions consisting of 10 ng of template DNA, 5 pmoles of each primer, 2.5 mM of each NTP, 1 μL 10× gold PCR buffer (Perkin Elmer), 0.05 unit AmpliTaq Gold DNA polymerase (Perkin Elmer), and 2 mM MgCl2 solution. All SSR primers were amplified at 56°C annealing temperature, keeping all other conditions of the protocol constant: 10 min at 95°C; 35 cycles of 45 sec at 92°C, 45 sec at 56°C, 1 min at 72°C, and a final extension of 10 min at 72°C. Amplified fragments were separated and sized on an ABI 3130 Genetic Analyzer (Applied Biosystems). Amplifications for each SSR marker were carried out individually, and PCR products from up to three markers that differed in the fluorescent labels (6-FAM, HEX, and NED) or expected amplified fragment size were mixed and analyzed in one injection. PCR products were added to an 11 μL:0.2 μL mixture of HD-formamide and GeneScan HD 400 ROX (Applied Biosystems) as the internal size standard, respectively. The fragments were denatured for 2 min at 92°C, then injected into a 36 cm capillary filled with the polymer POP-7 (Applied Biosystems). Fragment sizes were determined using Genotyper 2.5 software (Applied Biosystems). The DNA from four single-adult lineage lines and one foliar sample, WEO4802, was used as a reference for consistent genotyping (Table 1).
Because the foliar- and root-sample collections were made in different years, the genotypic data was generated in two batches. Batch A consisted of two root and 170 foliar phylloxera samples. Ten fluorescently labeled primers (Phy_II_16, Phy_II_32, Phy_III_36, Phy_III_61, Phy_IV_4, DV4, DV7, DV17, Dvit4, and Dvit6) were used to genotype these samples. Batch B samples consisted of 231 root and 65 foliar samples. Based on the results of amplification and scoring from Batch A, three markers were dropped and five new markers were added for testing the Batch B samples, with seven markers overlapping between the two batches. Twelve fluorescently labeled primers (Phy_II_23, Phy_II_32, Phy_III_36, Phy_III_61, Phy_III_69, Phy_IV_4, DV3, DV6, DV7, DV17, Dvit3, and Dvit4) were used on Batch B. Further detail of the sample locations is presented in Table 2. A list of the primers, and their amplified-product size range, source, and fluorescent labels are detailed in Supplemental Table 1.
Data processing
Samples missing 20% or more data were removed from the study set. The microsatellite tool kit software (Park 2001) was used to find matching genotypes and to identify unique multilocus genotypes (MLGs) based on the SSR allele profile. Only one unique MLG was retained within each sample site. The following analyses were carried out separately on samples from both batches.
The STRUCTURE V2.3.1 program (Pritchard et al. 2000) was used to establish the number of clusters within the unique MLGs in each data batch and to assign a probability (q value) to each sample for association to a particular cluster. The membership of each MLG was run for a predicted range of genetic clusters (K) with K values of 1 to 8 using the admixture model; each K value was replicated 10 times. Each run was started with a burn-in period of 250,000 replicates followed by 500,000 Monte Carlo Markov Chain replicates. No prior information was used when assessing the population structure. The number of clusters was assessed by delta K (ΔK), as described in Evanno et al. (2005), and by assessing the value for K when the Ln P(D) value plateaued. A threshold q value of 0.9 or above was set for a particular MLG to be included in a cluster. MLGs with q values between 0.5 and 0.89 were considered to be associated with a cluster. MLGs with q values of less than 0.5 in any one cluster were considered outliers and not part of any identified cluster.
The DARwin program (ver. 5.0.158, CIRAD Research Unit) was used to calculate a dissimilarity matrix, construct a neighbor-joining tree, and carry out principal coordinate analysis (PCoA) (Perrier et al. 2003). The outputs from the neighbor-joining tree and PCoA were compared with the STRUCTURE results. Samples with a consistent placement across all three assays were considered part of a particular cluster, which we referred to as a population.
POPGENE software (ver. 1.31; Yeh and Boyle 1997) was used to calculate standard parameters of genetic variability: allele frequencies (AF), number of alleles (na), expected heterozygosity (He), observed heterozygosity (Ho), Nei’s genetic distance, and Hardy-Weinberg (HW) equilibrium. The overall inbreeding coefficient (FIS) for each group and the overall differentiation index (FST) were calculated with FSTAT software (ver. 2.9.3.2; Goudet 1995).
To determine the level of asexual reproduction in each population, clonal diversity (R) was calculated as (G-1)/(N-1) where G is the number of MLGs present inside of each population and N is the total number of samples in that population (Sandrock et al. 2011). A combination of STRUCTURE output (the assigned q values that indicated an admixture of two populations) and placement of samples in the PCoA was used to identify possible sexual offspring between the different populations, following Villate et al. (2010). Allele frequencies of these potential offspring were then compared with their parent populations to check for matches. Both batches were tested separately for na, Ho, He, FIS, and R.
Results
Identification of unique MLGs
Very little diversity was observed for the foliar samples in Batch A where 169 samples amplified and grouped into 14 MLGs (Supplemental Figure 1A). The largest subgroup, with 154 samples, consisted of foliar samples collected on different rootstocks and across multiple years from NCGR, FPS, YSF3, and YSF5, and matched the foliar reference sample WEO4802. MLGA1 through MLGA11 differed at one or two alleles from the reference foliar sample, and in most cases, that difference was due to the loss of an allele. Only MLG10 had a new allele with marker DV17. Two root samples (MLGA12 and MLGA13) from the YSF5 nursery site were also included in this subgroup and differed at three markers from each other. These root forms likely derived from foliar forms at that site. The four root-based reference samples were distinctly grouped and clearly separated from the foliar samples, suggesting that the foliar strain in California did not originate from the root forms of California’s phylloxera (Supplemental Figure 1B).
For Batch B, 224 out of 296 (76%) samples amplified cleanly. Fifty-eight of the foliar samples amplified and sorted into 30 unique MLGs. MLGB1 to MLGB4 had more samples within them and 26 MLGs (MLGB5 to MLGB30) consisted of one sample only (Supplemental Table 2). The foliar MLGs shared multiple alleles, even though the samples were collected from multiple sites over multiple years. For the root samples, 145 amplified clearly. Sixty-seven samples from the UCDORS grouped into 17 MLGs (MLGB31 to MLGB47; Supplemental Table 2), with significant fingerprint profile differences among them due to the occurrence of unique alleles. MLGB48 matched control sample Fre-R2 collected from NCS2 and one sample from UCDORS. MLGB49 matched a sample collected in 1999 from ONaF and a sample collected in 2011 from UCDV&E. The MLGs from B50 to B145 were collected from multiple sites over multiple years (Supplemental Table 2).
Genetic diversity of unique MLGs
The genetic diversity of the unique MLGs was evaluated with a neighbor-joining tree, the STRUCTURE program, and PCoA. STRUCTURE analysis for foliar phylloxera samples from Batch A resulted in two clusters. The first cluster was composed of all the foliar phylloxera samples and two root samples collected from the same location. The second cluster was composed of the four nonfoliar reference samples. This result was supported by both the neighbor-joining tree and PCoA, which strongly grouped the foliar samples and distinguished the four controls (Supplemental Figure 1).
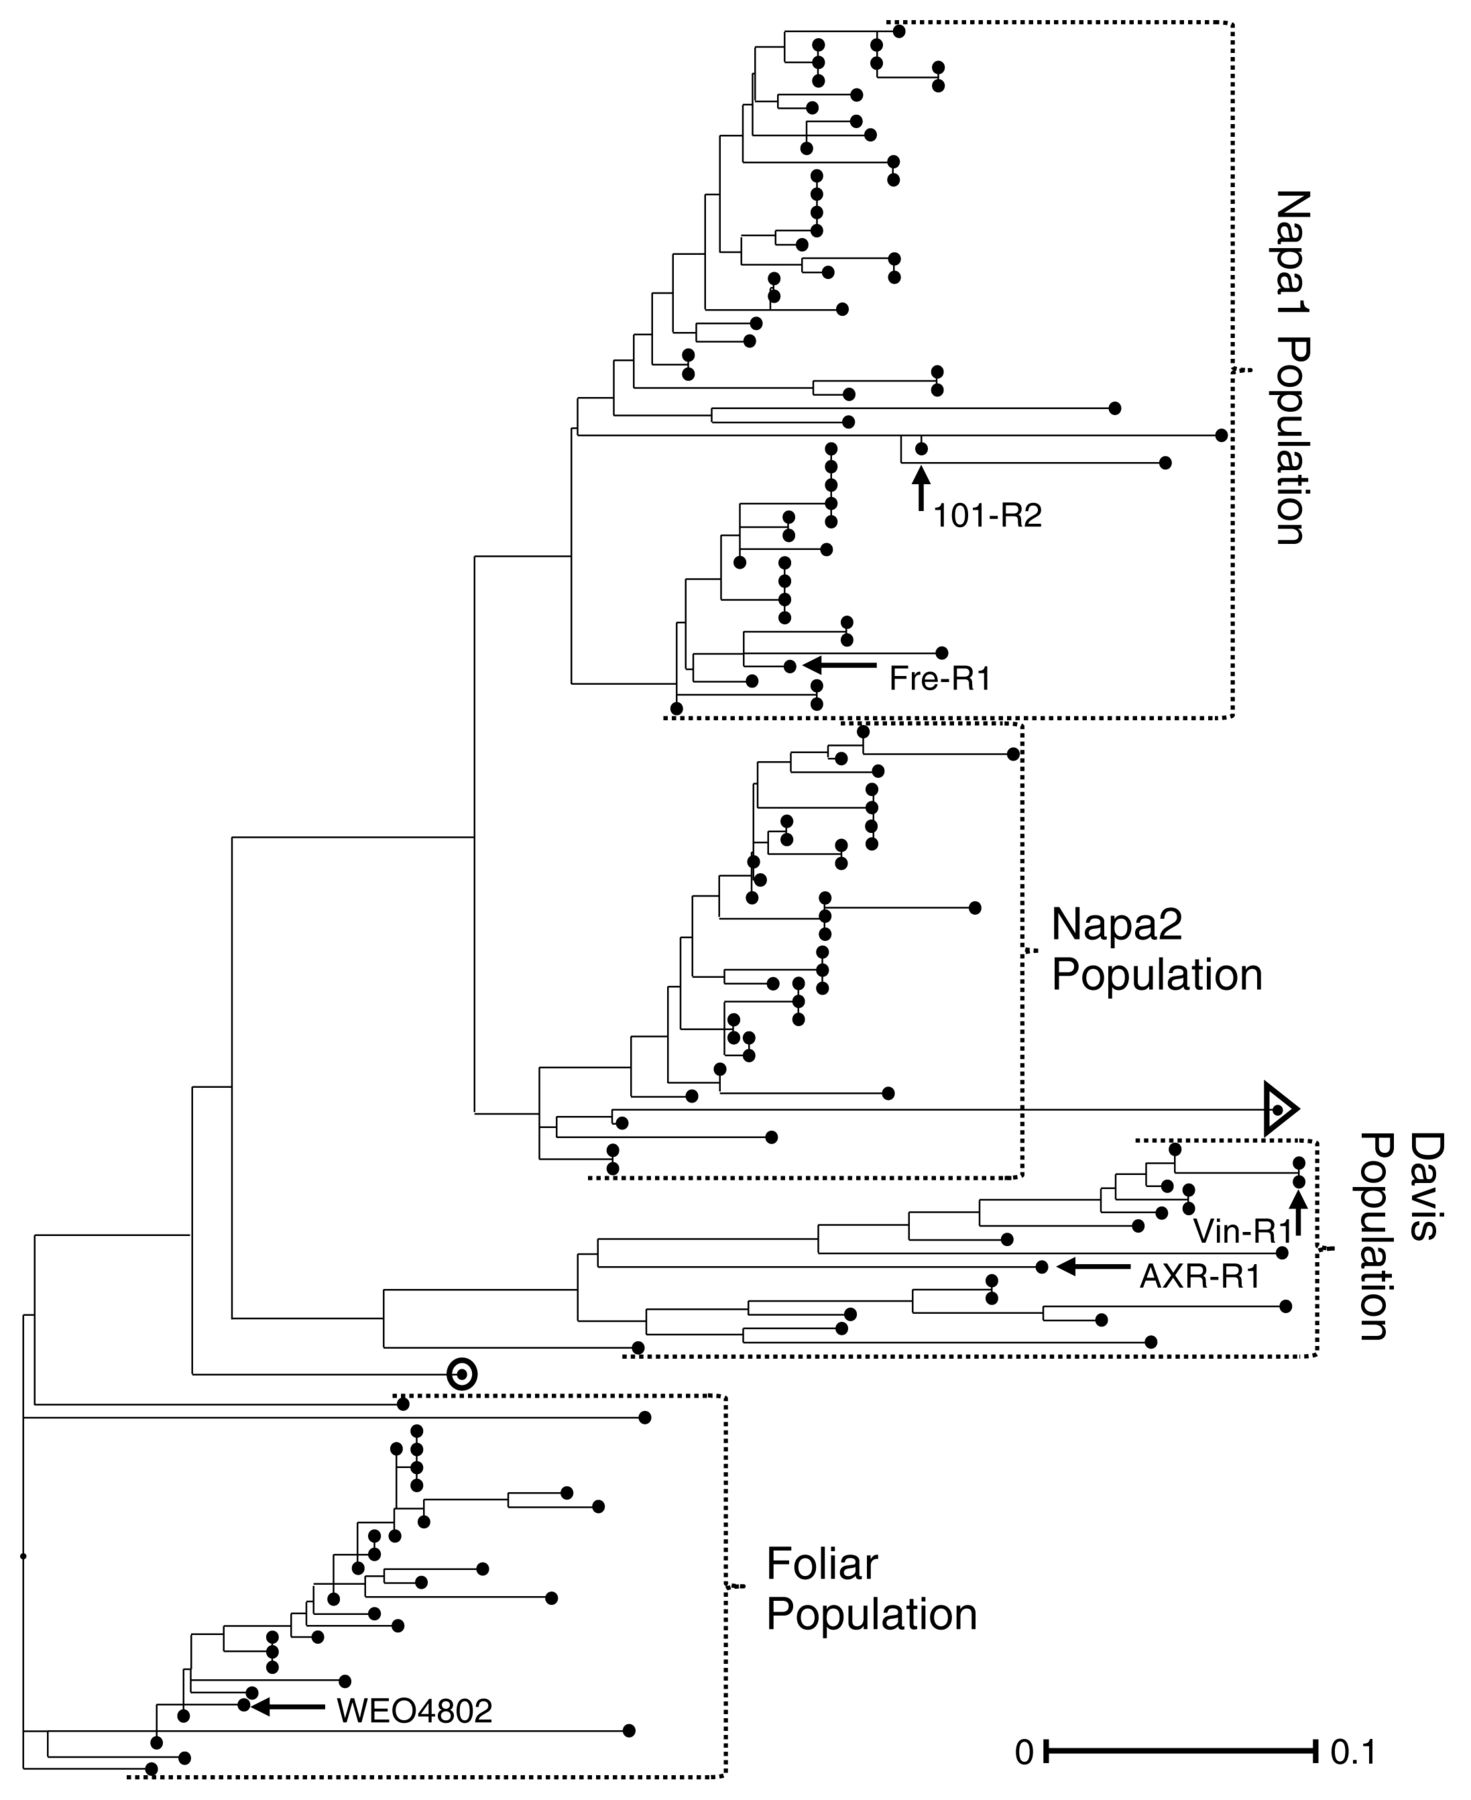
Four clusters were obtained for Batch B samples with the STRUCTURE and neighbor-joining tree methods (Figure 1), but only three clusters were identified by PCoA, likely because PCoA provides an overall representation of the diversity of the study set and not individual relationships among accessions. Further analysis revealed that one cluster from the PCoA consisted of samples that STRUCTURE divided into two clusters (Supplemental Figure 2). There were only two samples not assigned to the same group by STRUCTURE and neighbor-joining analysis. One of these samples, collected from UCDV&E, had a q value of 0.29 and was poorly associated with any of the four clusters. This weak association was the result of an admixture-model–based analysis in STRUCTURE (circled sample in Figure 1). One of the foliar phylloxera samples (collected from NCS4) was placed in a cluster with other foliar samples by STRUCTURE, but it was placed in the Napa2 subgroup by the neighbor-joining tree (sample identified by a triangle in Figure 1). These two samples were removed from further population analysis to avoid outlier effects. All other samples placed in a particular group by the three analyses were considered members of that population.

Neighbor-joining tree of the California grape phylloxera samples in Batch B. The four populations identified by the admixture-model clustering method employed in STRUCTURE are presented on the right. Two samples, marked by a circle and a triangle, were not placed by either STRUCTURE or the neighbor-joining tree method. The five control samples are named and indicated with an arrow.
Table 3 presents the distribution of samples from the four main populations based on the collection location and host. The Davis population consisted of 20 samples collected from UCDV&E, UCDORS, and NCS3, and two of the reference samples (AxRR1 and VinR1). The Napa1 population was the largest with 80 samples, including two of the reference samples (101R2 and FreR2); samples collected at UCDORS (2006, 2007, and 2011), NCS2, and both commercial vineyard samples in Sonoma County (SCS1–2); and one foliar sample collected in 1998 from OMoF. The majority of the samples in the Napa1 population were from the rootstocks 101-14Mgt, 1103P, and 5C (Table 3). The Napa2 population consisted of 65 samples collected from UCDORS (2006, 2007, and 2011) and NCS1, and a second foliar sample collected in 1998 from OMeF.
Distribution of phylloxera samples into the four populations determined in this study based on association with collection location or host plant.
The foliar population contained the control sample, WEO4802 (collected from St. George leaves), all samples collected from sites with foliar galls in Yolo and Solano counties (YSF1 to YSF6, FPS), and one sample collected from the roots at UCDV&E. The host range of the foliar population included 26 samples from 101-14Mgt, 20 samples from 1103P, eight samples from 110R, four samples from St. George, and a single root sample from a V. vinifera × American species hybrid (Table 3).
Samples collected from UCDV&E and UCDORS were placed in multiple populations by all three analyses, indicating that maximum divergence and diversity exists at these sites. The bulk of the UCDV&E samples clustered with the Davis population, while one sample clustered with the foliar population (Figure 1 and Supplemental Figure 2). This sample was collected from roots of a V. vinifera × American species hybrid at the periphery of the UCD vineyard. The UCDORS site samples were placed into three populations: Davis, Napa1, and Napa2. The Davis population accounted for all samples collected from 110R at the UCDORS rootstock trial block. The Napa1 population consisted of samples from the UCDORS irrigation trial block on 101-14Mgt, 5C, and 1103P. The Napa2 population was spread across all three sampled blocks and was on all hosts except 110R.
Population differentiation
Batch A samples were very similar, and all of the samples from foliar galls clustered into one population. Overall, there was little diversity, and variation was due to the loss of alleles. The foliar samples in both sample batches were collected from the same sites. However, the Batch A samples included a much wider host range because they included samples from the NCGR site where a foliar phylloxera outbreak spread across a diverse germplasm collection. The samples included foliar galls on American Vitis species, hybrids of these species, V. vinifera × American species hybrids, and pure V. vinifera cultivars.
The four populations found in Batch B were distinguished by both Nei’s genetic distance and by estimates of pairwise FST (Table 4). Nei’s genetic distance values ranged from 0.181 to 0.529 across the four populations. The pairwise FST values ranged from 0.392 to 0.582 overall. The Napa1 and Napa2 populations were most closely associated when analyzed by Nei’s genetic distance, while the Davis and Foliar populations were most closely associated based on FST values. Most of these populations were also distinguished by the presence of private alleles (not found in other populations). The Davis population had seven private alleles across four loci, the Napa1 population had four private alleles across two loci, the foliar population had three private alleles across two loci, and no private alleles were found in the Napa2 population (data not shown). Table 5 details the other diversity indices for the four populations. The mean number of alleles (na) across the four populations ranged from 1.58 to 2.58, with a mean value of 4.50 across all populations. Expected heterozygosity (He) ranged from 0.09 to 0.44 for the individual populations, with an average value of 0.39 across all populations. Observed heterozygosity (Ho) ranged from 0.08 to 0.56, with a value of 0.28 across all populations. The Foliar population had the highest Ho and the largest difference between Ho and He.
Nei’s genetic distance (below diagonal) and pairwise FST (above diagonal) for the four phylloxera populations identified in Batch A.
Sample size, number of multilocus genotypes (MLGs), clonal diversity (R), mean number of alleles (na), mean observed heterozygosity (Ho), mean expected heterozygosity (He), and FIS values for the four phylloxera populations identified in this study.
Reproductive mode
The large number of samples with matching fingerprint profiles and grouping these samples into a few distinct MLGs prior to population assignment suggests that asexual reproduction is the reproductive mode across all populations in Batch B. Clonal diversity (R) varied among the populations with a low of 0.48 and a high of 0.94 (Table 5). These values were much higher than the R-values obtained for foliar samples of Batch B (results not shown). The FIS values were calculated after removal of clonally identical samples. The Foliar and Davis populations had negative FIS values (−0.65 and −0.14, respectively) consistent with asexual reproduction. The Napa1 and Napa2 populations, however, had positive FIS values (0.11 and 0.17, respectively), which were unexpected given that phylloxera are considered to be primarily asexual (Table 5). HW results varied greatly per locus within the four populations, with at least 8 of 12 loci rejecting HW equilibrium per population (data not shown).
The q-value assignments from STRUCTURE were used to identify samples that were positioned between two populations, suggesting a potential sexual offspring. Five examples of possible sexual reproduction were identified within the Napa1 and Napa2 populations, with a probability between 0.4 and 0.6. The PCoA indicated that three of the five potential sexual-type samples clustered between the two populations (Figure 2). The comparison of allele frequencies between the two populations and the five samples with possible sexual reproduction indicated that only two loci (Phy_II_32 and DV3) were polymorphic (Table 6). Three of the samples (Sum03, Sum06, and Win22) had alleles at both loci that were found only in one population. Therefore, it was assumed that they could not be the result of sexual reproduction between phylloxera belonging to the two populations. The other two samples (Irr6426 and Irr6732) were heterozygous at both loci, with half of the genetic information coming from Napa1 and the other half coming from the Napa2 population, suggesting that they are the result of sexual reproduction (Table 6).
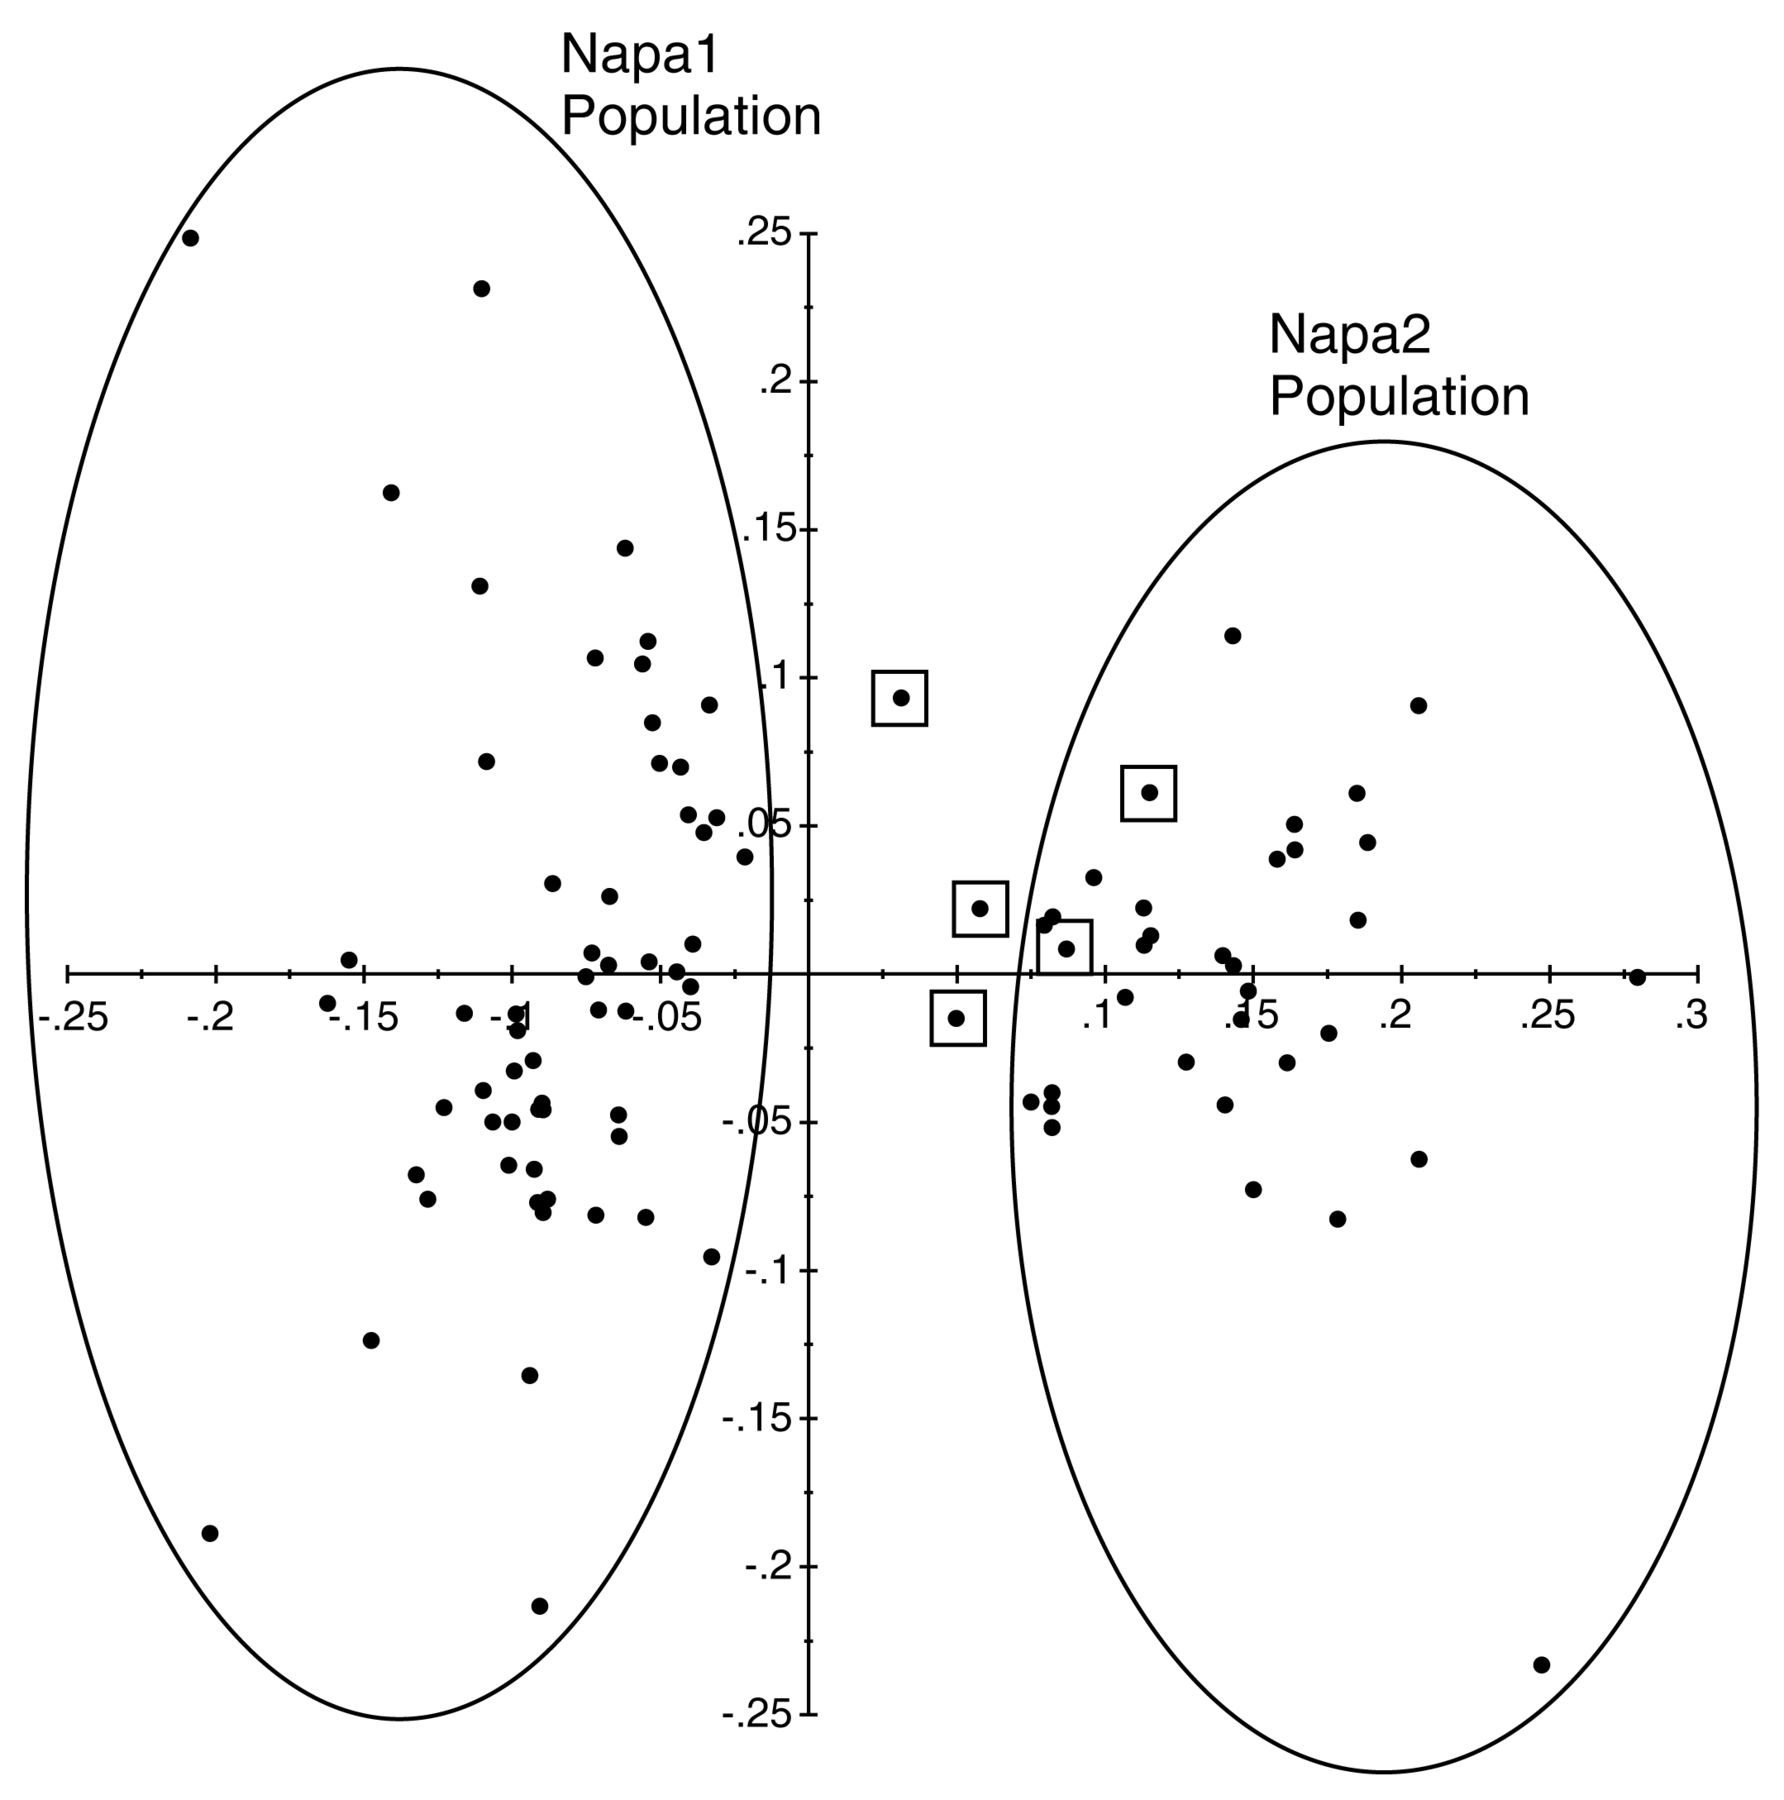
Principal coordinate analysis of phylloxera in the Napa1 and Napa2 populations to identify possible sexual offspring between the two populations. The samples marked by squares received q values between 0.4 and 0.6 for both populations in STRUCTURE. All remaining samples received a q value above 0.7 in STRUCTURE for one of the two populations. The x-axis accounts for 23.26% of the diversity, while the y-axis accounts for 10.41%.
Allele-frequency comparison of the Napa1 and Napa2 populations and five samples identified as being possible sexual offspring between the two populations.
Discussion
A large collection of grape phylloxera samples representing both foliar and root forms, collected at different time intervals and from different locations in California, were evaluated in this study. The key objective was to evaluate phylloxera genetic diversity and population structure using multiple genetic analysis techniques, STRUCTURE, neighbor-joining trees, and PCoA, to gain a high confidence in the results. Studies with aphids, which also have a predominantly asexual mode of reproduction, have used the STRUCTURE program to evaluate population structure (Cao et al. 2012, Ferrari et al. 2012, Jaquiery et al. 2012, Zhang et al. 2012), and neighbor-joining trees and PCoA have been used to elucidate phylloxera population structure and sources of genetic diversity (Downie et al. 2001, Downie 2002, Corrie et al. 2003, Corrie and Hoffmann 2004). In this study, STRUCTURE and neighbor-joining trees consistently generated comparable results. Only the PCoA grouped the two Napa populations as one population.
The second objective of this study was to determine whether a new outbreak of foliar phylloxera found in Yolo and Solano counties originated from within the existing phylloxera strains in northern California. The lack of genetic diversity in the foliar phylloxera samples both within and among vineyards, and the discovery of matching MLGs across multiple vineyards, supports the conclusion that the foliar samples from Yolo and Solano counties originated from a single source. The genetic distinctiveness of the foliar population was supported by Nei’s genetic distance, FST, and the number of private alleles within the foliar population, suggesting that these isolates are unique from root-feeding phylloxera collected in California. Genetic differentiation between root and foliar phylloxera feeding types has also been reported in Australia (Corrie et al. 2002). Overall, the results presented here strongly support the conclusion that the foliar phylloxera found in Yolo and Solano counties originated from a new introduction of phylloxera to the region and not a genetic variant from the local root-galling phylloxera. The fact that the foliar phylloxera samples had low levels of genetic diversity suggests that they originated from a single insect or an asexual colony of foliar phylloxera. In a separate study, we investigated the population structure of foliar phylloxera in its native range where a large collection of samples was obtained and genotyped with SSR markers (Lund et al. 2017). The California foliar sample, WEO4802, was identified by STRUCTURE as an admixture between the V. riparia and the V. vulpina populations and was similar to samples that were collected from Indiana where these two Vitis species overlap. This single introduction seems to have spread to a large number of grapevine plantings across two California counties. Unless the original source of the contamination can be found, it would be impossible to tell whether this foliar phylloxera were the result of infested plant material at a nursery source or the unregulated movement of grapevines within the United States. Also noteworthy is that California root-feeding phylloxera have been reported since the 1860s and yet, until now, the widespread incidence of foliar phylloxera has not been previously reported.
Phylloxera movement between different areas
Given the evidence presented here for the introduction of a foliar phylloxera strain into California, it seems important to consider how these insects were introduced and moved, and how their spread might be contained. This is particularly true given that foliar phylloxera strains were found at both the FPS (provider of certified grape germplasm to the grape nursery industry) and the NCGR (provider of grape germplasm to researchers). Adult phylloxera and crawlers have a limited capacity to move from the site of an infestation on their own. Previous work has found that phylloxera crawlers can move no more than 100 m outside of a vineyard through wind dispersal (King and Buchanan 1986). Shared farm equipment and contaminated nursery stock are probably the most common means of dispersal. Australian research has found that crawlers were able to survive several days submerged, up to eight days without food, and through the fermentation process, to be found in pomace at wineries (Powell 2008). The ability of phylloxera crawlers to survive for relatively long periods in adverse environments is important, and intensifies the need to follow strict procedures for cleaning clothes, shoes, and equipment to avoid accidental transfer of phylloxera between different sites. Strong north and south winds are common in Yolo and Solano counties and may be responsible for distributing this new foliar strain over what appears to be an ~75km north/south transect. Phylloxera may be capable of being spread by wind over much longer distances than previously reported. Previous work on wind-spread phylloxera was hampered by the need to visually identify the phylloxera nymphs (King and Buchanan 1986). Current molecular techniques allow specific phylloxera genotypes to be identified when visual identification is not possible. Phylloxera strains can easily be captured on a sticky trap and identified using PCR with phylloxera-specific primers. This technique could be used to more accurately demonstrate how far from an infested vineyard phylloxera nymphs are able to travel or be blown.
Distribution of root phylloxera populations
Host selection of adapted strains has been observed in grape phylloxera (Corrie et al. 2003) and is common among members of the closely related family, Aphididae (Dickey and Medina 2012, Jaquiery et al. 2012). In this study, different populations rarely occupied the same location, so it was difficult to separate geographic distribution from host-plant association. The UCDORS site did offer an opportunity to search for evidence of host adaptation, as all three of the root-feeding populations were found there. This site housed a 25-year-old rootstock trial with 24 rootstocks grafted with Cabernet Sauvignon, and samples from both the Napa2 and Davis populations were collected there. Five of the Davis population samples were collected from two 110R plants at this site. Twenty-two other samples were collected from 12 plants of four different rootstocks (including two plants adjacent to the sampled 110R), and all were members of the Napa2 population. It is unlikely that this finding was due to positional or row effects of sampled 110R host plants. Rootstocks that harbored samples of Napa2 population were positioned between the 110R rootstocks that supported Davis population samples. The Napa2 population was widespread in this rootstock trial block, while the Davis population was found only on the 110R plants. This observation suggests the Davis population samples prefer 110R as the host plant and the Napa2 population does not. This finding also raises the question of why 110R (V. berlandieri × V. rupestris hybrid) appeared to cause a greater preference bias in phylloxera than either 1103P (also V. berlandieri × V. rupestris hybrid) or 101-14Mgt (V. riparia × V. rupestris hybrid). The fact that 110R also selected for phylloxera that were genetically similar to phylloxera found on Chardonnay (V. vinifera) and AxR#1 (V. vinifera × V. rupestris hybrid) further complicates these host/pest interactions. The observations from this study clearly indicate that more work is needed to determine how, and if, phylloxera adapt to specific rootstocks. Such studies would require collecting samples and establishing lines from different rootstocks capable of allowing detailed comparisons of the interactions between different phylloxera populations and different rootstock hosts.
Reproductive mode
This study provided an opportunity to investigate the reproductive mode of California phylloxera. Previous studies in California (Lin et al. 2006), as well as in Australia (Corrie et al. 2002) and Europe (Vorwerk and Forneck 2006), have found that asexual reproduction is the primary, if not the only, mode of reproduction in these regions. Negative FIS values, Ho exceeding He, lack of adherence to HW equilibrium, and high levels of repeated MLGs were used to evaluate phylloxera’s reproductive mode in this study. The Foliar population produced the expected results for a population undergoing asexual reproduction, with a strongly negative FIS, a Ho value that was far above the He value, and matching MLGs that were found across multiple vineyards.
Overall, population statistics indicated that asexual reproduction was very common in the study sets. However, FIS values and corresponding Ho to He values for the Davis, Napa1, and Napa2 populations suggest that sexual reproduction also occurs in California. This finding was especially true for the Napa1 and Napa2 populations, which had positive FIS values. In addition, SSR allelic profiles from two offspring indicated that a mating may have occurred between individuals from the Napa1 and Napa2 populations. Further evidence for the occurrence of sexual reproduction was reported from Islam et al. (2013), who also evaluated samples collected from the UCDORS. A study on the dagger nematode (Xiphinema index), another primarily asexual grape-root pest, found that sexual reproduction could occur when two different asexual populations contact each other (Villate et al. 2010). The irrigation trial block at the UCDORS site provided these conditions for the Napa1 and Napa2 populations and may have resulted in the possible sexual offspring detected between them. However, the allele frequencies found in these two populations were very similar. Further efforts to confirm sexual reproduction are needed in the irrigation and rootstock trials at the Oakville research station.
Conclusion
This study was able to identify four northern California populations of phylloxera isolates, including a new foliar-feeding population that was not observed in the past. The Foliar population was found to be exclusively asexual and had a wide host range. Analysis of the three root-based populations, Davis, Napa1, and Napa2, suggested that strains were adapting to rootstock hosts. Interestingly, two possible examples of sexual reproduction were detected in these populations. Additional sampling is required to confirm host selection and sexual reproduction. A more detailed analysis of the interactions between phylloxera and their root hosts will be needed in the future to clarify the mechanisms of selection. If sexual reproduction can be confirmed, the selective pressures stimulating this alteration of phylloxera’s life cycle will also need to be examined.
Acknowledgments
The authors gratefully acknowledge research funding from the California Grape Rootstock Improvement Commission; the California Grape Rootstock Research Foundation; the CDFA Fruit Tree, Nut Tree, and Grapevine Improvement Advisory Board; the California Table Grape Commission; and the Louis P. Martini Endowed Chair in Viticulture.
Footnotes
Supplemental data is freely available with the online version of this article at www.ajevonline.org.
- Received November 2015.
- Revision received November 2016.
- Accepted December 2016.
- Published online December 1969
- ©2017 by the American Society for Enology and Viticulture
Literature Cited
Vol 68 Issue 2


Jump to section
Related Articles
Cited By...
More from this TOC section
Similar Articles
