


Abstract
Chaptalization and saignée-watering back were used to investigate the effects of modifying ethanol concentrations on sensory properties of Merlot wines made from fruit harvested at different maturities. Fruit was harvested on three dates with soluble solids concentrations of 20, 24, and 28 Brix. At each harvest, one-third of the must was fermented at the natural soluble solids concentration, and the other two-thirds were manipulated to match the other harvests’ Brix, leading to wine ethanol concentrations of 11.6, 14.0, and 16.2% for each of the three soluble solids concentrations. Both fruit maturity and ethanol concentration had significant effects on the chemical and sensory profiles of the wines. Wine physical viscosity increased with increasing ethanol concentrations, and wine color was positively impacted, with higher ethanol concentrations favoring the formation of polymeric pigments leading to darker wines. Wines made from unripe fruit (20 Brix) were characterized by green flavors and sour taste in the sensory analysis, whereas wines made from overripe fruit (28 Brix) were described as fruity and sweet. Manipulations targeting the adjustment of ethanol had a greater effect on wine sensory properties than fruit maturity: wines made from ripe (24 Brix) or overripe fruit adjusted to low ethanol concentrations were described similarly to wines made from unripe fruit, and wines made from unripe or ripe fruit adjusted to high ethanol concentrations were described similarly to wines made from overripe fruit. The results of this study demonstrate that both ethanol concentration and manipulations to achieve desired ethanol concentrations have a large influence on wine chemistry and sensory properties, and suggest that wine ethanol concentration is more important for the sensory profiles of wines than is fruit maturity at harvest.
Wine sensory properties depend on several factors, with grape maturity being of primary concern to most viticulturists and winemakers. As grapes mature, concentrations of sensory active compounds and their precursors change. The most abundant metabolites in grapes are sugars and acids. Glucose and fructose accumulate throughout ripening, while tartaric and malic acid concentrations decrease (Hornsey 2007). Total soluble solids concentration, referred to and measured as Brix, is the most widely used measure of grape maturity; however, studies have shown that wines made from grapes picked from the same vineyard at similar Brix over three vintages produce very different wines (Forde et al. 2011). Many other grape metabolites that may influence wine sensory properties accumulate or decline during ripening. These include free volatile metabolites such as alcohols, aldehydes, and methoxypyrazines, and low concentrations of esters, terpenes, and norisoprenoids, as well as nonvolatile glycosylated aroma precursors that can impart fruity, floral, spicy, or vegetative characters to wines (Lopez et al. 2004, Sánchez-Palomo et al. 2005, Canuti et al. 2009, del Caro et al. 2012, Dennis et al. 2012, Flamini et al. 2014, Hampel et al. 2014, Robinson et al. 2014). Vilanova et al. (2012) found that in some Spanish cultivars, the accumulation of volatiles and precursors was not proportional to the increase in sugar concentration, showing that sugar ripeness does not necessarily equal flavor ripeness. Anthocyanins, flavonols, and tannins also accumulate during ripening, influencing the color, taste, and mouthfeel of wines, but there is evidence suggesting that anthocyanin and flavonol concentrations may decline late in berry development (Kennedy et al. 2002, Kennedy 2008, Bindon et al. 2013, 2014b).
Fermentation reveals the full sensory impact of grape-derived metabolites and also produces other sensory active compounds via yeast metabolism and chemical reactions. Glycosylated volatiles undergo enzymatic or acid-catalyzed hydrolysis, esters are synthesized by yeast or as the products of condensation reactions, and volatile sulfur compounds are produced from precursor metabolites. In red winemaking, anthocyanins are extracted from grape skins during fermentation and may undergo reactions with tannins extracted from the skins and seeds to form polymeric pigments. Monomeric flavan-3-ols undergo condensation reactions to form oligomers (proanthocyanidins) and polymers (condensed tannins), which are the most abundant phenolic compounds in wine. New wines are typically more bitter than old wines, as monomeric flavan-3-ols such as catechin impart a bitter taste, whereas oligomers and polymers, which take time to condense, do not (Waterhouse 2002). The influence of grape maturity on the sensory profiles of wines has been the subject of several studies, with wines made from less ripe fruit (determined by sugar concentration as Brix) generally rated as more sour and vegetative, while wines made from riper fruit are rated higher in dark fruit flavors, sweetness, and bitterness, and exhibit a hot and viscous mouthfeel (Casassa et al. 2013a, Heymann et al. 2013, Bindon et al. 2014a). In a comprehensive study conducted by Bindon et al. (2014a) of the relationships among grape maturity, composition, and wine sensory properties in Cabernet Sauvignon, the authors reported clear shifts toward dark fruit attributes in wines made from later harvest dates from vegetative and red fruit characters in earlier harvest wines. Later harvest wines had higher concentrations of esters and lower concentrations of methoxypyrazines and C6 alcohols. Grape composition, and therefore wine composition, is heavily influenced by seasonal and viticultural factors, with researchers noting that grapes picked from the same vineyard at similar sugar concentrations across three vintages can produce wines with very different sensory properties (Forde et al. 2011). Winemaking practices can also heavily influence wine sensory profiles, with choice of yeast, fermentation temperature, maceration time, malolactic fermentation, and aging techniques all playing important roles.
Prefermentation sugar adjustment is another technique sometimes used by winemakers; these adjustments include chaptalization to increase Brix by adding sugar or saignée and watering back to decrease Brix. Sugar adjustments are used to alter the final wine ethanol concentration and may also alter fermentation dynamics (Wang et al. 2004, Bindon et al. 2013) and extraction of flavor and aroma precursors from grape skins and seeds (Canuti et al. 2009), although anthocyanin and tannin extraction efficiencies are reportedly unchanged (Casassa et al. 2013a, 2013b).
Ethanol concentration has a major influence on wine chemistry and sensory profiles. Villamor and Ross (2013) provide a comprehensive review on the influence of wine-matrix compounds, including ethanol, on the perception and chemistry of wine aromas. Increases in perceived body and sweetness with increasing ethanol concentration have been reported as well as decreases in sour perception (Gawel et al. 2007, Casassa et al. 2013a, Heymann et al. 2013, King et al. 2013). Detrimental effects of increased ethanol concentration have also been noted, with decreased partitioning of volatiles into the headspace leading to increased odor thresholds, as shown for several aroma compounds in model wine solutions (Villamor et al. 2013), which manifests as lower perceived intensities for fruity sensory attributes (Goldner et al. 2009, Robinson et al. 2009, King et al. 2013). Goldner et al. (2009) reported that the interaction between ethanol concentration and headspace partitioning of aroma compounds was not straightforward, with increased headspace concentrations in higher alcohol wines for some compounds. Escudero et al. (2007) found that in the absence of ethanol, a selection of fruity compounds formulated at maximum concentrations in wines was perceived intensely; however, in a 10% ethanol solution, the perceived intensity decreased significantly, and at 14.5% ethanol, the fruity aroma was not perceived at all. Nurgel and Pickering (2005) found that perceived viscosity, bitterness, and hot mouthfeel were enhanced in high alcohol wines, but Pickering et al. (1998) reported that viscosity reaches a maximum at 12% alcohol and is not significantly different at 14% alcohol. Interactions between ethanol and astringency perception have also been found (Smith et al. 1996). Heymann et al. (2013) found that the method of ethanol adjustment was important, with fortified wines being rated sweeter, more bitter, astringent, hot, and viscous than unadjusted and chaptalized wines; however, fortification is not an accepted winemaking practice in table wine production. Overall, most studies investigating the sensory impact of wine ethanol concentrations found that perceived fruity characters were depressed in high alcohol wines, hot and viscous mouthfeel perceptions were enhanced, and sweet and bitter ratings were increased. There was no clear influence on wine astringency, with some studies reporting a suppression effect (King et al. 2013), and some an enhancing effect (Casassa et al. 2013a, Heymann et al. 2013). There are clearly interaction effects involving both wine chemistry and human perception that make assessing the impact of grape maturity and ethanol concentration on wine sensory properties more complex. Wine alcohol concentrations have steadily risen over the last 10 to 20 years, and interest in decoupling grape sugar concentrations from flavor ripeness is increasing as well.
In this study, we evaluated the effects of grape maturity and ethanol concentration on wine chemistry and sensory properties by using a full factorial experimental design to unravel interactions between wine composition and sensory perception. Merlot grapes were harvested at three different maturities, and the resulting musts were divided into three lots. One-third of each must was maintained at, or adjusted to, the same Brix as the first harvest fruit (~20 Brix, unripe), one-third to match the second harvest fruit (~24 Brix, ripe), and one-third to match the third harvest fruit (~28 Brix, overripe). Subsequent chemical and sensory analyses of the produced wines demonstrated that both grape maturity and ethanol concentration (manipulated by changing preferment Brix content) significantly influence wine composition and sensory character.
Materials and Methods
Winemaking and experimental design
Vitis vinifera L. cv. Merlot (clone 3) grapes were harvested from the Paterson Ranch of Ste. Michelle Wine Estates, in Paterson, WA. The vineyard was planted in 2000 to 2003 with a vine by row spacing of 2.13 m × 3 m in a north-south orientation. The vineyard is located in the Columbia Valley American Viticultural Area and is drip-irrigated (two pressure compensated emitters per vine, 2 L/hr flow rate). The fruit was harvested on 5 Sept 2013 (average soluble solids 20.7 Brix), 26 Sept 2013 (average soluble solids 24.0 Brix), and 2 Nov 2013 (average soluble solids 27.4 Brix) (Table 1). On each harvest date, ~2700 kg of fruit was hand-harvested and transported to the Washington State University winery facility. The fruit was divided into three equal lots; two of the three lots were adjusted to the same soluble solids concentrations as the other two harvest dates by chaptalization or saignée (bleeding-off) and watering back (target soluble solids concentrations were 20, 24, and 28 Brix); the remaining portion was not adjusted. All treatments were fermented in triplicate. Details of the full factorial experimental design are shown in Figure 1. Chaptalized musts were adjusted using a 63 Brix sucrose solution, and saignée-watered back musts were adjusted using a 4.5 g/L tartaric acid solution while the original total volume was maintained.
Fruit chemistry.
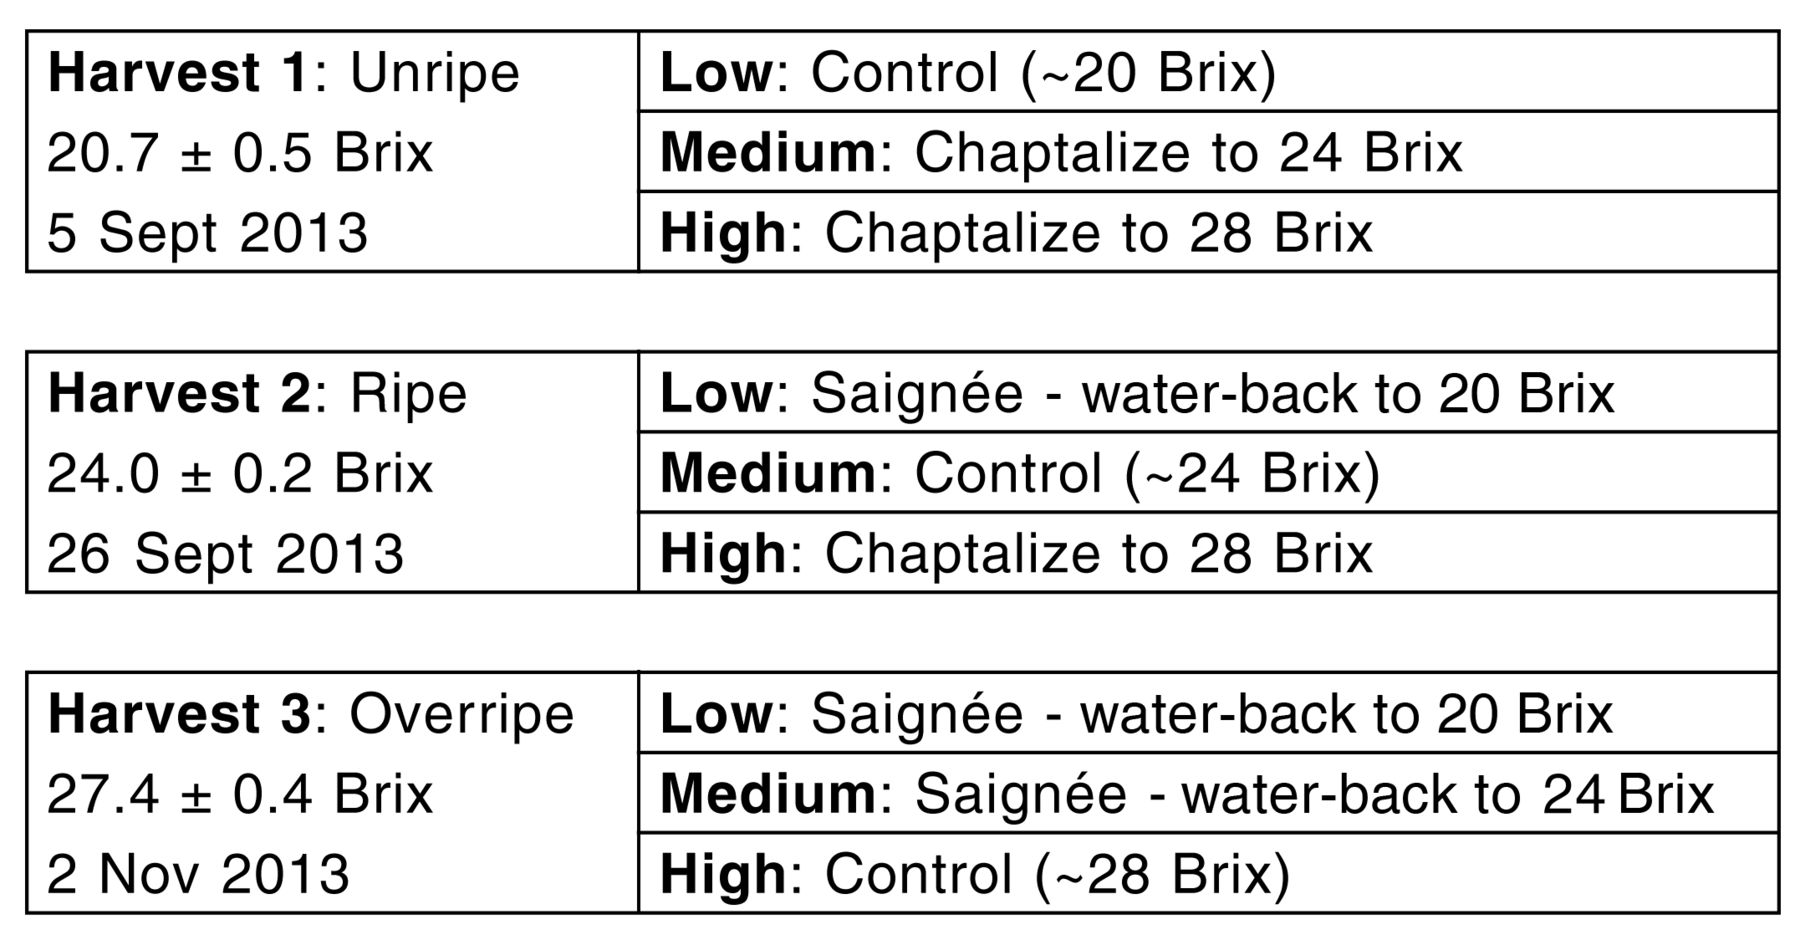
Full-factorial experimental design for fruit maturity by ethanol content (preferment soluble solids adjustment). Errors are reported as standard deviation.
The fruit was destemmed using a Gamma model 40 RM destemmer crusher (Toscana Enologica Mori) and pumped to 300 L stainless steel–jacketed fermenters fitted with mobile lids (Ghidi) with a progressive cavity pump (Francesca). Sulfur dioxide (SO2) was added at a rate of 50 mg/L during the tank-filling process. Musts were inoculated with dry yeast (Lalvin EC-1118, Lallemand) 7 hrs after crushing at a rate of 250 mg/L. Malolactic bacteria (Lalvin VP41, Lallemand) were added 48 hrs after yeast inoculation at a rate of 10 mg/L. Diammonium phosphate was added to raise the yeast assimilable nitrogen to 225 mg/L prior to fermentation. Sugar consumption during fermentation was monitored daily with a hand-held density meter (DMA 35N, Anton Paar), and tank temperatures were maintained at 26 ± 2°C at the fermentation peak using a web-based fermentation management system (TankNet, Acrolon Technologies). Residual sugars at the later fermentation stages were measured by the Rebelein method (Iland et al. 2004).
Cap management consisted of a whole-volume tank pump-over, followed by a 5 min punch-down twice a day during active fermentation. Most of the ferments completed alcoholic fermentation (residual sugars <4 g/L). Residual sugar concentrations are reported in Table 2. All wines underwent a 10 day postfermentation maceration, consisting of a single 1 min punch-down per day, after which the tanks were sealed and sparged under lid with N2 (30 L/min × 3 min). After completion of the maceration, free run wines were transferred to 20 L glass carboys fitted with airlocks and maintained under controlled temperature (22 ± 2°C). Malolactic fermentation was monitored by enzymatic analysis of l-malic acid (Unitech Scientific) and was considered complete when the wines reached <0.1 g/L malic acid. After completion of the malolactic fermentation, the wines were racked, cold-stabilized (45 days at 0 ± 2°C), and adjusted to 35 mg/L free SO2. Prior to bottling, the wines were adjusted to 0.5 mg/L molecular free SO2. Bottling was conducted at room temperature (20 ± 1°C) using 750 mL bottles sealed with screwcap closures (Stelvin Saranex Liner, Amcor), leaving a 16 mL headspace with a semiautomatic capper machine (TechnovinTVLV), and bottles were then stored at 10 ± 2°C.
Wine chemistry.
Wine analysis
Reagents
Tartaric acid, sodium hydroxide, sodium chloride, sodium azide, maleic acid, and acetic acid were purchased from VWR. Bovine serum albumin (BSA, Fraction V powder), sodium dodecyl sulfate (lauryl sulfate, sodium salt), triethanolamine, ferric chloride hexahydrate, potassium metabisulfite, and (+)-catechin were purchased from Sigma.
Fruit and wine chemical analyses
Seven 15-cluster replicates were randomly selected at each harvest. Berries were separated from each replicate and split into two sets of 30 berries at random. In the first 30-berry set, the juice was extracted using an IKA A11 analytical mill (Fisher Scientific), and the pulp solids and liquid were transferred to 50 mL tubes, centrifuged (5000 g × 6 min at 5°C), and the supernatant analyzed for basic fruit chemistry (Harbertson et al. 2009), while the second set of 30 berries was used for fruit phenolic analysis.
Fruit soluble solids, pH, titratable acidity (TA), and anthocyanin concentrations were measured as described by Iland (2004). Wine pH, TA, and anthocyanin concentrations were determined as for fruit analyses, and residual sugars were measured by the Rebelein method (Iland 2004). Ethanol concentrations were determined using a digital infrared spectrophotometer (Anton Paar USA, Inc.), and free and total SO2 concentrations were determined with a FIAstar system (Foss Analytical). Fruit tannins were extracted from skins and seeds and analyzed by protein precipitation with BSA (Harbertson et al. 2002). Wine small polymeric pigments (SPP), large polymeric pigments (LPP), tannins, and total iron-reactive phenolics were determined as reported by Heredia et al. (2006). Wine color was determined as CIELab coordinates using a colorimeter (CR-400, Konica Minolta Americas).
Descriptive sensory analysis
All wines and replicates were evaluated ~1 yr after bottling. Descriptive sensory analysis was performed in triplicate for aroma, flavor, taste, and mouthfeel as described by Lawless and Heymann (2010), and for color as described by Casassa et al. (2013a).
The sensory panel consisted of 14 volunteer participants (3 males and 11 females), aged between 21 and 60 years and recruited from the University of California (UC) Davis campus community. Nine of the panelists were students younger than 30 years, and the remainder comprised a mixture of UC Davis staff and students. Panelists were recruited on the basis of willingness to participate and availability, and no monetary compensation was provided. Five panelists had previously participated in descriptive sensory panels, and four had wine industry experience.
The panelists participated in five training sessions over three weeks, with sessions lasting 1 to 1.5 hrs. As a group, the panelists generated and refined a lexicon to describe the wines; references were formulated in consultation with panel members to match the attributes defined by the panel (Supplemental Table 1). Throughout the training sessions, the panel saw all wines at least three times. The final lexicon was composed of 16 aroma, 15 in-mouth flavor, three taste, and three mouthfeel terms. Aroma and in-mouth flavor terms were kept separate because panelists felt that the wine sensory profiles were quite different when evaluated orthonasally compared with retronasally. Although this division substantially increased the number of attributes the panelists were required to rate, the panelists felt it was necessary and within their capabilities. To familiarize panelists with the use of line scales in evaluating wine sensory attributes, paper ballots were introduced with 10 cm anchored line scales (“none” and “high” for all terms, except body, for which the anchors were “thin” and “thick”) in the later stages of training.
Wines were evaluated for aroma, flavor, taste, and mouth-feel attributes in individual tasting booths under white light and in pear-shaped black ISO glasses coded with three-digit, randomly generated blinding codes. Forty mL of each wine to be evaluated was poured, and the glasses were capped with plastic petri dishes 45 min before each tasting session to allow for equilibration in the glass. During a period of four weeks, panelists evaluated the wines over 12 sessions, each lasting 45 to 60 min. Prior to entering the evaluation booth, panelists could smell labeled aroma references to refresh their concepts of the attributes. They were then required to complete a reference test where the aroma references were presented in black ISO glasses with three-digit blinding codes. The references were randomized and placed in a separate tasting booth where panelists identified the references by selection from a list of possibilities, using a computer with FIZZ software (Biosystèmes). The panelists were required to refamiliarize themselves with any incorrectly identified references prior to entering the evaluation booth. Seven or eight wines were evaluated per session, with the first wine being a warm-up wine consisting of a blend of all wine treatments. Panelists were requested not to schedule more than one evaluation session per day. Wines were expectorated, and panelists rinsed and refreshed their palates between each sample with ambient temperature-filtered water and unsalted crackers during a forced 30 sec break. Between the fourth and fifth samples, panelists were asked to evaluate wine color in a separate tasting booth, enforcing a break of 3 min or more, thereby reducing palate fatigue. Computers with FIZZ software were used to collect aroma, flavor, taste, and mouthfeel data from the panelists, with line scales provided as per the paper ballots used during the training phase. Samples were presented in a Williams Latin Square incomplete block design calculated by the FIZZ software.
Wine color was evaluated using the laminated wine color poster Les couleurs du vin (Bouchard Ainé & Fils) as described in Casassa et al. (2013a). Panelists were screened for color blindness using an online version of the pseudoisochromatic testing plates (Waggoner 2014). During the training phase, the panelists practiced the assessment technique. Panelists were provided with an evaluation sheet and a pen, and compared 20 mL wine samples in clear Burgundy style glasses coded with three-digit, randomly generated blinding codes to 42 red wine color examples on the poster fixed horizontally in a tasting booth, choosing one color that matched the wine best. Panelists were asked to keep their eyes level and 40 cm away and hold the glass tilted next to the poster, comparing wine and poster colors side by side. Color evaluations took place in a booth separately from that for the aroma, flavor, taste, and mouthfeel evaluations, with a different set of three-digit random numbers. The booth was illuminated by two vertically mounted halogen lamps (1.4 m from the poster surface, 30 cm between each lamp, color temperature 3000 K) at a luminous intensity of 1580 candela (MR16 Superline Reflekto, Ushiro America). Poster colors were transformed into CIELab coordinates using a colorimeter (CR-400, Konica Minolta Americas).
Data analysis
Fruit composition was analyzed by one-way analysis of variance (ANOVA), and wine composition was analyzed by two-way ANOVA with interactions. The data analysis was performed with R (ver. 3.2.2; R Core Team), using the stats (R Core Team 2016), predictmeans (Luo et al. 2014), lsmeans (Lenth 2015), and multcompView (Graves et al. 2015) packages. Tukey’s honest significant difference (HSD) was used as a post-hoc comparison of means (p < 0.05).
Sensory data were first analyzed by four-way multivariate analysis of variance (MANOVA) of wine treatment, fermentation replicate, judge, and sensory replicate. The MANOVA was followed by univariate two-way ANOVA utilizing a linear mixed-effects model allowing for nested random effects for each attribute assessed. Harvest and ethanol level were considered fixed effects, and panelist was considered a random effect. Tukey’s HSD was used as a post-hoc comparison of means (p < 0.05). Data analysis was performed using R (ver. 3.2.2; R Core Team 2016), with the nlme (Pinheiro et al. 2015), predictmeans (Luo et al. 2014), lsmeans (Lenth 2015), and multcompView (Graves et al. 2015) packages. Principal component analysis (PCA) was performed on the significant (p < 0.05) sensory attributes using the correlation matrix. Confidence ellipses indicating 95% confidence intervals were constructed, and Hotelling’s T2 test was used to generate pairwise p values for the separation of treatments. PCA plots, confidence intervals, and significance testing were performed using the SensoMineR package (Le and Husson 2008). A Pearson’s correlation coefficients matrix for significant sensory attributes was generated using R software with the rcorr function from the Hmisc (Harrell 2015) package.
Results and Discussion
Fruit chemistry
Basic fruit chemistry and anthocyanin and skin and seed tannin concentrations showed significant differences among the three harvest dates (Table 1). The harvest dates were selected to target soluble-solids concentrations of 20, 24, and 28 Brix, corresponding to unripe, ripe, and overripe fruit, respectively. A one-way ANOVA with comparisons of means by Tukey’s HSD showed that fruit pH increased with increasing fruit maturity as expected, and that TA decreased between unripe and ripe fruit, then increased again in overripe fruit. This may have been due to the concentrating effect of fruit dehydration during the later stages of berry maturation, typically around 25 Brix for Merlot, when transport of water and solutes between the vine and berries via the phloem slows (Keller 2015). Average berry weight decreased by 16% from ripe to overripe fruit.
Total anthocyanin and skin tannin concentrations were not significantly different between unripe and ripe fruit on a fresh weight basis, but were significantly higher in the overripe fruit. These differences can also be explained by the concentrating effect of dehydration, but other factors may have also been at play. The total per berry anthocyanin and skin tannin concentrations increased across all harvest dates, indicating biosynthesis could still be occurring even after traditional harvest maturity had been reached. Moreno et al. (2008) found that Pinot noir berries subjected to a postharvest berry dehydration treatment had higher concentrations of anthocyanins expressed as mg/g fresh weight, but when expressed on a per berry basis, the control and dehydrated fruits did not significantly differ. The authors concluded that this observation demonstrated that the concentration effect was due to dehydration only, and that no anthocyanin biosynthesis had occurred during the postharvest berry dehydration treatment. The current study used fruit that had remained on the vine during any berry dehydration that occurred, which may account for continued anthocyanin and tannin biosynthesis. Seed tannin concentrations per berry remained constant, indicating seed maturation was complete prior to the first harvest.
Wine chemistry
Wine chemistry was heavily influenced by harvest date as well as by the preferment soluble solids adjustments, which generated significantly different ethanol concentrations (Table 2). A two-way ANOVA with interactions showed that the ethanol concentrations of the treatment combinations were influenced by an interaction effect between fruit maturity and preferment soluble solids concentration. This interaction was not significant when treatment interaction means were compared with a post-hoc Tukey’s HSD test (p < 0.05). There was a significant interaction effect on residual sugar concentrations, with the overripe control wines having an average concentration of 12 g/L, much higher than in all other treatments, indicating that these wines did not complete primary fermentation. Wine pH was influenced by both harvest date and ethanol concentration, with unripe fruit producing wines with lower pH as expected, while increasing ethanol concentrations led to higher-pH wines. The interaction effect was significant (p < 0.05), showing that ethanol adjustments had a greater influence on pH in wines made from overripe fruit than in wines made from unripe fruit. This effect was attributable to the method of preferment adjustment: the addition of acidified water during the saignée-watering back process would have decreased must pH because of the addition of the acid, whereas chaptalization using a sucrose solution may have diluted musts, particularly those that required large adjustments as in the early-harvest, high-ethanol treatment. TA was mainly affected by harvest date, with wines made from ripe fruit having lower acid concentrations than wines from unripe or overripe fruit.
Total anthocyanin concentrations in wines increased with increasing fruit maturity, but decreased with increasing ethanol concentration (Table 3). The means of all treatment combinations were compared using Tukey’s HSD. Both the significant interaction effect from the two-way ANOVA and the comparison of means indicated that wines made from unripe fruit had consistently low anthocyanin concentrations and wines from overripe fruit had consistently high anthocyanin concentrations. Wines made from ripe fruit displayed differences due to ethanol concentration, with the high-ethanol wines having significantly lower total anthocyanin concentrations than low- and medium-alcohol wines. The increased anthocyanin extraction in the lower-alcohol ferments could be attributed to the water-soluble nature of anthocyanins (Castaneda-Ovando et al. 2009). This effect was not significant in ferments from unripe and overripe fruit.
Wine phenolic chemistry.
SPP concentrations were highest in wines made from ripe fruit and lowest in wines from overripe fruit. Higher ethanol concentrations increased SPPs, though there was no difference between the low- and medium-ethanol treatments. A significant interaction effect was found, with SPP concentrations reaching a maximum in the 28 Brix ferments for unripe and overripe fruit, and SPP concentrations in wines made from ripe fruit were maximized in both 24 and 28 Brix ferments. The highest LPP concentrations were found in wines made from unripe fruit, while higher-ethanol wines had elevated LPP concentrations. Tannin concentrations were highest in wines made from overripe fruit with high ethanol concentrations (Table 3). Wines with the lowest tannin levels were made from ripe fruit, which may be a reflection of the fresh weight skin and seed tannin content in the fruit, as reported above. Iron-reactive phenolics also showed differences due to both harvest maturity and ethanol, increasing in wines made from overripe fruit and with higher soluble solids. The related measure of nontannin phenolics, calculated from the difference between total iron-reactive phenolics and tannins, showed a significant increase in overripe fruit but was unaffected by ethanol concentration.
The measurements described above were performed post-fermentation. Dynamic viscosity and density were also measured, along with color parameters at the time of sensory evaluation, ~1 yr after bottling. Ethanol, acid, and sugar concentrations were also checked with FTIR techniques (data not shown) which followed trends similar to those in the postfermentation analyses. The density of the wines differed among the treatments, but the differences were quite small and hence would not reflect important treatment effects (Table 2). Dynamic viscosity was also influenced by both harvest maturity and ethanol concentration. Surprisingly, wines made from unripe fruit had the highest measured viscosities, and wines made from ripe fruit had the lowest. Within the ethanol adjustment treatments, the highest ethanol wines also had the highest viscosity. Numerous studies have demonstrated the positive influence of ethanol on perceived viscosity (Nurgel and Pickering 2005, Gawel et al. 2007, Yanniotis et al. 2007, Bindon et al. 2014a, Heymann et al. 2013); therefore, it would stand to reason that physical viscosity would follow the same trend, and this was confirmed by Pickering et al. (1998) over ethanol concentrations ranging from 0 to 14%, but the maximum perceived viscosity was reached at 10%. The significant viscosity differences associated with fruit maturity indicate that there may be interesting chemistry to investigate that may help determine the underlying causes of wine body. However, a comparison of treatment means by Tukey’s HSD for the interaction of harvest maturity and ethanol content indicated that the ethanol concentration is the dominant treatment effect (Table 2). King et al. (2013) concluded that the influence of alcohol on the perception of viscosity was correlation rather than causation, as there is conflicting evidence from numerous other studies that determined alcohol concentration, but observed no influence of alcohol levels commonly found in table wines on wine body (Pickering et al. 1998, Nurgel and Pickering 2005, Gawel et al. 2007, Runnebaum et al. 2011). King et al. (2013) also noted that viscosity is positively correlated with other mouthfeel attributes, and Vidal et al. (2004) found that grape and yeast polysaccharides increase perceived viscosity in model wines, suggesting that other factors besides alcohol also influence wine body.
Wine color was significantly influenced by both fruit maturity and ethanol concentrations (Table 3). L* (lightness) was lowest in wines made from overripe fruit and high ethanol treatments, indicating darker, more intensely colored wines. Wines made from unripe fruit were significantly lighter than wines made from mature fruit, and increasing the ethanol concentration of these wines did not change the lightness, as seen by the comparison of the treatment interaction means (Table 3). Monomeric anthocyanin concentrations were negatively correlated with measured lightness, indicating that higher anthocyanin concentrations yield darker wines; these findings were in agreement with those of previous studies (Boulton 2001, Cliff et al. 2007, Bindon et al. 2013). The a* and b* coordinates, indicating color on the red–green and yellow–blue axes, respectively, were also influenced by the wine treatments and by the interaction of harvest maturity and ethanol concentration.
Wines made from more mature fruit were more red and yellow, while lower ethanol wines were more red and less yellow than high ethanol wines. A comparison of the means for the interaction between harvest maturity and ethanol concentration indicated that the influence of ethanol on wine color depends on fruit maturity, with wines made from unripe fruit adjusted to a high ethanol concentration being more red than the unadjusted low ethanol wines, whereas wines made from ripe fruit adjusted to a low ethanol concentration were redder than the unadjusted or high ethanol wines. The yellow hue of the wines was influenced only by ethanol adjustment in wines made from ripe or overripe fruit, while wines made from unripe fruit were not significantly different when adjusted to different ethanol concentrations. A significant positive correlation between b* and pH measurements suggested that color differences were also influenced by wine pH, which is a well-documented phenomenon (Waterhouse and Kennedy 2004).
Wine sensory analysis
The descriptive sensory analysis of the wines revealed differences in aroma, flavor, taste, mouthfeel, and color perception. A four-way MANOVA showed significant differences (p < 0.001) due to wine treatments (interaction of harvest maturity and ethanol content) with no interaction among treatments and ferment replicates, indicating no differences among the replicate ferments (data not shown). Interactions were found between wine treatment and panelist, indicating differences in panelist ratings; however, no interactions between treatment and sensory replicate were observed, which demonstrated that the panel was reproducible, but panelists probably used different portions of the line scales.
Two-way univariate ANOVAs with panelist as a nested random effect were performed for each attribute assessed. These tests showed that almost all descriptors chosen by the panel to describe the wine sample set were influenced by the wine treatments (Supplemental Tables 2, 3, and 4). Fewer significantly different aroma attributes were found, yet other researchers have reported good agreement between ortho- and retronasal evaluation with slightly better discrimination by nose (Aubry et al. 1999a, 1999b). Wine aroma, detected orthonasally (by smell), and wine flavor, detected retronasally (in-mouth), depend on sensory active volatile compounds being detected by olfactory sensors located in the nasal cavity (Thorngate 1997). Differences between orthonasal and retronasal perceptions can occur, depending on the chemistry of the aroma compounds and in the case of aroma, the partitioning of the volatiles into the headspace of the wine. The large influence of ethanol concentration is a likely cause of the disagreement between aroma and flavor perception, interfering with panelists’ orthonasal evaluation by altering the partitioning of volatiles into the wine headspace, particularly in high alcohol wines. Interactions among aromas may also influence wine perception; Hein et al. (2009) reported that fruity aromas can mask vegetative characters, but the intensity of the fruity aroma is reduced compared to fruity aroma solutions without added vegetal aromas. These interactions may explain why few fruity aroma attributes differed significantly in our sample set.
A PCA was performed on the correlation matrix of sensory attributes detected as being significant in the two-way ANOVA (p < 0.05) to visualize the sensory differences among the wines. The first four principal components (PCs) explained 88% of the total variance; the scores plots for the means of the treatments with 95% confidence ellipses and the corresponding loadings plots are shown in Figure 2. The sizes of the confidence ellipses are related to the variability of attribute intensity ratings within the sensory panel; where ellipses do not overlap, the panel was able to discern significant differences among the wines, and where they do overlap, the wines were determined as not differing from each other. Dimensions 1 and 2 show the wines were separated mainly by ethanol concentration, with the first and second PCs explaining 53 and 15% of the total variance, respectively. The corresponding scores plot (Figure 2A) showed significant overlap among wines from different harvests adjusted to the same wine ethanol concentration, whereas wines with different ethanol concentrations were well separated. Ellipses for low alcohol wines were primarily situated in the negative quadrant of dimensions 1 and 2, whereas ellipses for high ethanol wines were situated in the positive half of dimension 1, with high alcohol wines made from unripe fruit further separated in the positive direction of dimension 2. Ellipses for medium ethanol wines fell in the center of dimension 1, mostly in the positive half of dimension 2. The corresponding loadings plot (Figure 2D) shows that the separation of the wines in the first two PCs can be attributed to unripe green and sour characters negatively loaded in the first dimension, with alcoholic, ripe fruit, and spicy flavors, and astringency, body, and sweet taste positively loaded in that dimension, and white pepper flavor and bitter taste positively loaded in the second dimension. This observation agreed with previous findings where the first dimension of a PCA of a typical red wine generally explained the opposing vegetative-fruity characters within the sample set, with subsequent dimensions explaining variance among descriptors more specifically to the variety (Hein et al. 2009).
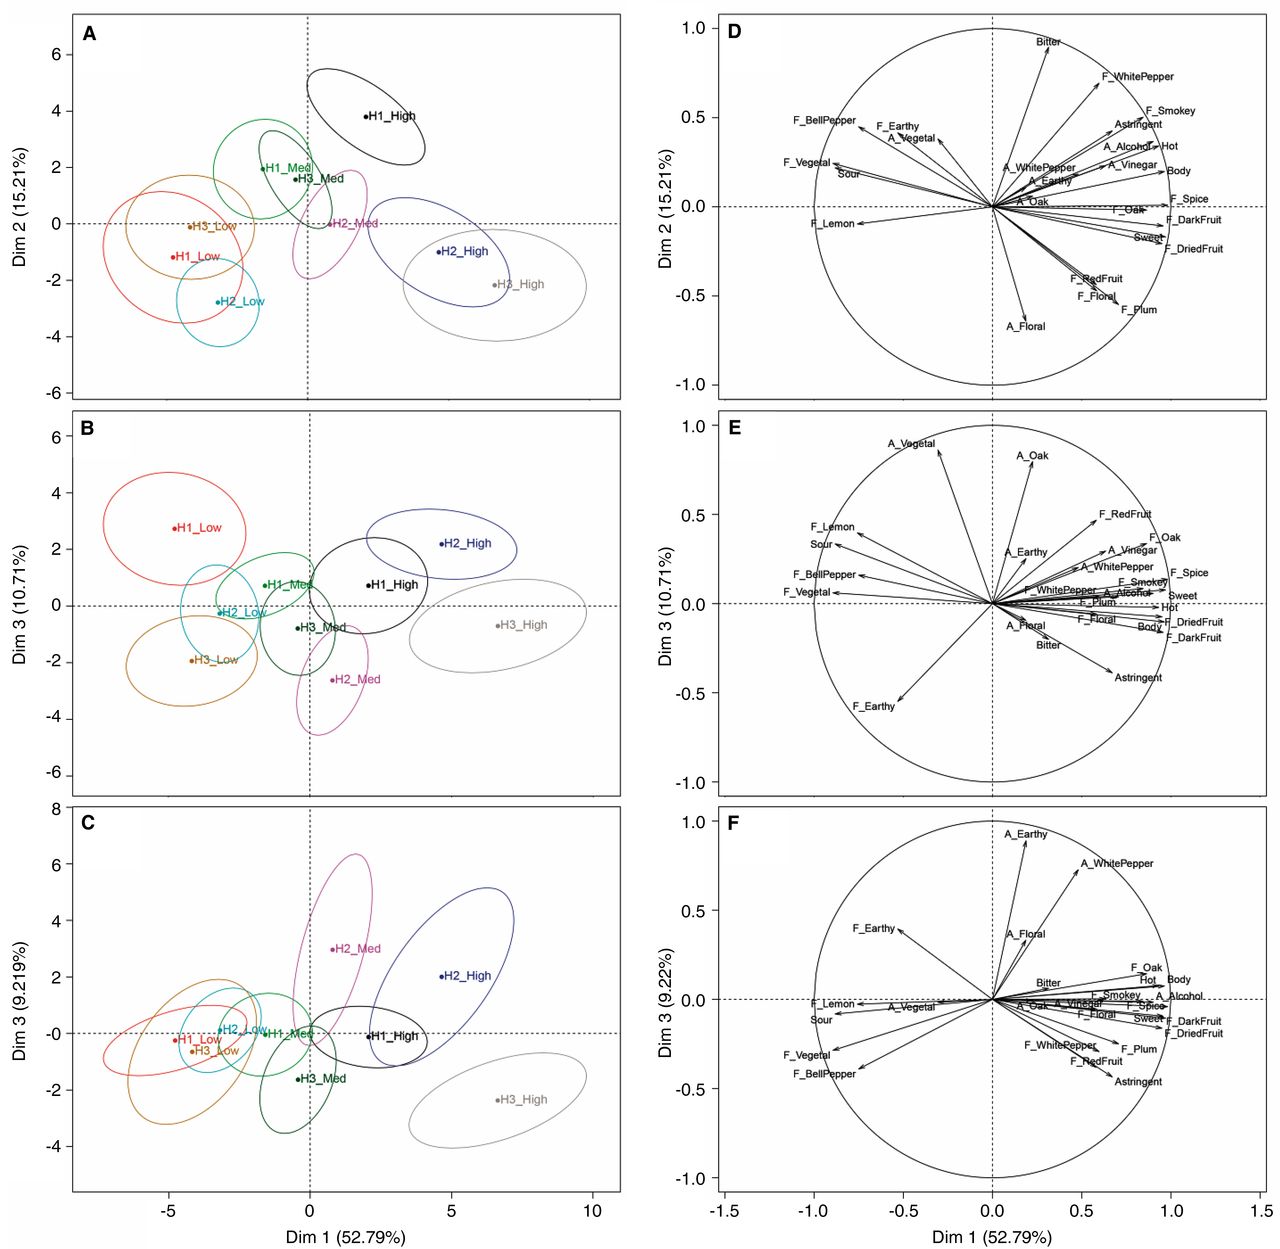
Principal component analysis of the correlation matrix of significantly different sensory attributes (p < 0.05). A, B, and C: wine factor maps with 95% confidence ellipses showing the relative positioning of the treatment means in two-dimensional space. D, E, and F: sensory attribute loadings; A_ denotes aroma attributes and F_ denotes flavor attributes. Wine treatment codes displayed as harvest (H) by ethanol content (Low, Med, and High).
Higher bitterness ratings in high ethanol wines made from unripe fruit are likely to be due to increased ethanol concentrations contributing to perceived bitterness, as described by Fischer and Noble (1994), with some contributions from lower residual sugar and lower concentrations of esters, known to increase as fruit ripens (Saenz-Navajas et al. 2010, Bindon et al. 2013). These factors would contribute to lower perceived sweetness ratings, as shown in Supplemental Table 4. Wines made from ripe or overripe fruit adjusted to high alcohol concentrations had higher perceived sweetness, possibly due to higher fruity ester concentrations in riper fruit and higher residual sugar concentrations, especially in overripe high alcohol wines. High ethanol concentration has also been shown to increase perceived sweetness in red wines (King et al. 2013), which may mitigate the perceived bitterness, as demonstrated by Smith et al. (1996). The overripe high ethanol wines were less bitter than the unripe high ethanol wines even though the overripe high-ethanol wines had higher phenolic concentrations (Table 3), which are known to increase perceived bitterness in wines (Thorngate 1997).
The second PC was also characterized to a lesser extent by the negatively loaded floral aroma, showing the elevated floral character in ripe control wines (medium ethanol). The third PC illustrated the differences among wines made from different-maturity fruit, particularly within the low ethanol treatment (Figure 2B). Ellipses for medium and high alcohol wines overlapped to some extent, and it therefore can be concluded that the third dimension explained very few significant differences among these wines. With the ellipse for low ethanol wines made from unripe fruit in the upper left quadrant of the scores plot, significant descriptors for these wines included vegetal, lemon, and sour. The ellipse for low ethanol wines made from overripe fruit was positioned in the lower left quadrant, and although these wines were still described by unripe characters loaded in the first dimension, they also had increased earthy in-mouth flavor (Figure 2E). The fourth PC explained only the differences among high ethanol wines made from overripe fruit and medium and high ethanol wines made from ripe fruit (Figure 2C). The corresponding loadings plot shows that the discriminating attributes were the positively loaded white pepper and earthy aromas, which tended to be lower in overripe high ethanol wines (Figure 2F).
Dimensions two and three of the PCA, explaining 15 and 11% of the variance, respectively, separated the wines to a certain extent by fruit harvest maturity (Figure 2A and 2B); however, the separation was not as clear as for the ethanol adjustments. Hotelling’s T2 test (data not shown) indicated that many pairwise comparisons among wines from different harvest dates adjusted to the same preferment soluble solids were not significantly different, corroborating the observations made from visual inspection of the PCA scores plots. This shows that the ethanol concentration adjustments had a greater influence on the sensory profile of the wines than harvest date. These results seemed at odds with previous findings, which concluded that harvest date was the prevailing influence on the sensory profile of a wine (Casassa et al. 2013a).
Pearson’s correlation coefficients between flavor, taste, and mouthfeel sensory attributes determined to significantly discriminate the wines from the two-way ANOVA (p < 0.05) are presented in Tables 4 and 5. Of the significant aroma attributes, alcohol was the only one to have a significant correlation with the corresponding in-mouth flavor/mouthfeel attribute (p < 0.05). This result supported the panel’s view that separate aroma and flavor terms were required to properly describe this sample set. Overall, the aroma terms did not correlate well with each other, except for vegetal and lemon (r = 0.74, not shown), earthy and white pepper (r = 0.74), and alcohol and vinegar (r = 0.73, not shown) (Table 4). Further interpretation of correlations among sensory attributes was undertaken with the aroma terms excluded (Table 5). Many highly significant correlations were found: green characters correlated with each other (vegetal and bell pepper, r = 0.93) and were negatively correlated with many ripe fruit and spice attributes (vegetal and dried fruit, r = −0.89).
Pearson’s correlation coefficients matrix for aroma and flavor attributes.a
Pearson’s correlation coefficients matrix for in-mouth flavor and taste attributes.a
Attributes that were highly correlated may have been used by panelists to describe the same flavor, which could be the case for dark fruit and dried fruit (r = 0.95), thereby making them redundant; however, there were some highly correlated attributes that clearly described different sensory characteristics. For example, body was highly correlated with fruity and spicy flavors as well as with sweet taste and hot mouthfeel. Panelists were trained to assess body using viscous mouthfeel standards at different concentrations in water, so there were no flavors or other mouthfeel influences such as alcohol heat to confuse them. Generally, wines rated high in body and hot mouthfeel were sweet with ripe fruit and spicy flavors, whereas wines rated high in green, lemon, and sour characters were low in sweetness, body, and hot mouthfeel.
Panelists used a color-matching technique to evaluate the color of the wines, which were then converted into CIELab coordinates for ease of data analysis (Supplemental Table 4). Significant differences were found for all color components, with both harvest maturity and ethanol concentration influencing wine color. Wines made from unripe fruit were perceived to have lighter color (higher L*) with more red (higher a*) and yellow (higher b*) hues, while wines made from mature or overripe fruit were perceived to be darker, less red, and yellow. Increasing ethanol concentrations produced wines perceived as darker, less red, and more yellow. The significant interaction found in the two-way ANOVA indicated that the influence of the ethanol adjustments on perceived wine color depends on fruit maturity. For example, increasing the ethanol concentration of wines made from unripe fruit did not change the perception of wine lightness significantly, while wines made from ripe or overripe fruit with high ethanol concentrations were perceived to be darker than wines with low ethanol concentrations. The difference in the influence of ethanol content on color perception among the three harvest dates may be attributable to the dilution effect of saignée and watering back: wines manipulated to low ethanol concentrations were lighter and less yellow than wines made from similarly mature grapes, as well as unmodified wines made from unripe grapes.
Data from actual measurements of the wines using a colorimeter agreed to a certain extent with panelist perception of wine color, particularly the influence of fruit maturity on the lightness of the wines; however, hue measurements indicated that the wines made from ripe or overripe fruit were actually more red and yellow than wines made from unripe fruit (Table 3). This result was completely opposite to how the wines were perceived by the panelists. The disagreement between perceived and measured color may have been due to illuminant differences where panelists observed the wine and poster colors under halogen light, while the colorimeter used standard illuminant C, which approximates daylight without UV radiation. The influence of ethanol concentration on the measured b* component showed some agreement with panelist perception, with higher ethanol wines found to be more yellow, although there was not a clear influence of alcohol on the red hue.
Conclusion
This study investigated the impact of the interaction between grape maturity and wine alcohol concentration on wine composition and sensory properties. By adjusting the preferment sugar concentrations of a must to match unripe, ripe, or overripe maturity fruit, the effect of wine ethanol concentration was found to be much greater than fruit maturity on wine sensory properties, while wine chemistry was influenced by both.
Preferment Brix did not influence the extraction of phenolics and anthocyanins as much as expected, but did increase physical viscosity and gave darker, yellower wines. Monomeric anthocyanins were actually higher in lower-alcohol ferments, leading to the conclusion that polymeric pigments are the prevailing influence on wine color. Tannins were extracted more in higher-alcohol ferments, which was expected, but these results did not differentiate between skin and seed tannin, which have been shown to be differentially extracted.
When considering the control wines that were maintained at their harvest Brix, later harvest dates produced fruitier, sweeter wines with less vegetal character and higher perceived body. This effect was mitigated by increasing the preferment Brix (and therefore ethanol concentration) of less mature fruit. Conversely, saignée and watering back higher Brix musts decreased the fruity character of the wines. This was counter to what was expected, as ethanol is known to suppress fruit character, and it was thought that reducing the alcohol of wines made from riper fruit would not change the sensory profile so dramatically. Reduced-alcohol wines from overripe fruit had more vegetal and sour characters, reminiscent of wines made from unripe fruit.
Based on these results, wine sensory properties may have been influenced by changing the preferment Brix, leading either to greater influence of compounds imparting vegetal characters due to dilution effects of saignée and watering back or to potential differential extraction of lipophilic aroma and flavor compounds and precursors from skins that impart fruity sensory character.
These findings show that increasing wine ethanol concentrations by chaptalization generally has a positive effect on wine chemistry and sensory attributes that can override grape maturity at harvest. Conversely, manipulating musts by saignée and watering back to achieve lower alcohol concentrations has a negative effect on wine chemistry and sensory properties.
Further investigations are required to assess the aroma and flavor chemistry aspect of the interaction between grape maturity and alcohol concentration. These findings indicate that winemakers and viticulturists may be able to base harvesting and processing decisions on grape sugar concentrations (potential alcohol), with flavor ripeness having a smaller influence on wine sensory properties.
Acknowledgments
Emma Sherman thanks Fulbright New Zealand for her Science and Innovation Graduate Award and gratefully acknowledges the New Zealand Institute for Plant & Food Research for their ongoing and generous financial support.
Footnotes
Supplemental data is freely available with the online version of this article at www.ajevonline.org.
- Received August 2016.
- Revision received January 2017.
- Accepted February 2017.
- Published online December 1969
- ©2017 by the American Society for Enology and Viticulture
Literature Cited
Vol 68 Issue 3


Jump to section
Related Articles
Cited By...
More from this TOC section
Similar Articles
