About the Cover
2020; volume 71 issue 2
Cover image

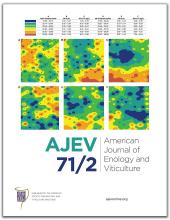
Maps of total soluble solids (TSS), pH, and titratable acidity (TA) for a Pinot noir vineyard in Ontario, Canada, in 2014 (top) and 2015 (bottom). Orange zones depict high TSS, TA, and pH, while blue zones depict lowest TSS, TA, and pH. Maps were created in ArcGis from data acquired by GreenSeeker technology. (See Kotsaki et al., pp. 114–131, and supplemental data).
AJEV encourages authors to submit images for possible inclusion on the AJEV cover that appears on the AJEV website. An image does not necessarily have to be a figure or table from the submitted manuscript, but it should be related to the topic of the paper. Pertinent photos or artwork would be welcome. Images submitted for consideration for inclusion on the AJEV cover must be in 4-color process (CMYK) and 8.75” (22.5 cm) wide x 6.5” (16.5 cm) tall, with a resolution of 300 dpi. Please send any images directly to editor{at}asev.org.

