


Abstract
Economic pressures in the New York Concord grape industry over the past 30 years have driven crop management practices toward less severe pruning to achieve larger crops. The purpose of this study was to investigate the effect of crop load on juice soluble solids and the seasonal change in vine pruning weight in New York Concord grapevines. Over a four-year period, vines were balanced pruned at two levels or fixed node pruned at two levels to give four pruning severities. For balanced pruning, vines were pruned to leave 33 or 66 fruiting nodes for the first 500 g pruning weight and an additional 11 nodes for each additional 500 g pruning weight. For fixed node pruning, vines were pruned to 100 or 120 fruiting nodes per vine. The 120-node vines were also manually cluster-thinned at 30 days after bloom to target 0, 25, or 50% crop removal. In a second study, the 120-node pruning with midseason fruit-thinning was repeated over 11 years to assess seasonal differences on the crop load response. Crop load was measured as the yield-to-pruning weight ratio (Y:PW) and ranged from 1 to 40 in this study. On average, the industry standard of 16 Brix was achieved at a Y:PW of 20, and no seasonal pruning weight change was observed at a Y:PW of 17.5. There was a positive linear relationship between seasonal growing degree days and the Y:PW needed to reach 16 Brix, as well as between seasonal precipitation and the Y:PW required to observe no seasonal pruning weight change. The results from this study were used to improve crop load management recommendations for New York Concord vineyards under current practices.
Commercial Concord (Vitis labruscana Bailey) grape production in the Lake Erie American Viticultural Area (AVA), which encompasses New York and Pennsylvania, aims to consistently grow the largest possible crop size that meets an obligate quality standard in any given season. Achieving this goal requires the understanding and management of vine crop load in a cool and relatively short growing region (Howell 2001). “Crop load” is the crop size relative to vine size (estimated as pruning weight or leaf area) and is a measure of the sink:source ratio (Keller 2010). In cool-climate Concord production, the dormant cane pruning mass of one-year-old wood, commonly referred to as “pruning weight,” is directly related to vine total leaf area (unpublished data derived from Bates 2008, total leaf area (m2/m) = 8.31 × pruning weight (kg/m) + 5.10, R2 = 0.90). Pruning weight is often used to represent leaf area in crop load calculations. The most common usage is in the Ravaz index, which is calculated as the yield-to-pruning weight ratio (Y:PW) (Ravaz 1911), and used to indicate if vines are “subjectively” overcropped, undercropped, or balanced. Crop load has also been measured more directly as the exposed leaf area to fruit weight ratio, rather than Y:PW. This is particularly true in studies that investigate additional canopy management, such as canopy division, with a need to account for changes in exposed rather than total leaf area (Shaulis et al. 1966, Smart and Robinson 1991, Kliewer and Dokoozlian 2005, Bates 2008). Therefore, Y:PW or leaf area:fruit yield are quantitative measurements of vine crop load; however, what constitutes “vine balance” is qualitative based on region, variety, viticulture production goals, and grape market destination (Howell 2001, Taylor et al. 2019).
Crop load management in commercial Concord vineyards is a function of manipulating crop size through practices such as pruning level and fruit-thinning or by influencing vine size through water and nutrient availability and uptake. This paper deals primarily with the former by investigating crop size management over a range of vine sizes; however, the importance of the latter in commercial Concord production cannot be understated. Water, nutrient, and rootstock management options have been addressed in other Concord studies and all show how increasing vine size supports larger crop size while maintaining fruit quality because of the importance of vine size in the crop load ratio (Pool 2004). Crop size management has been long studied in New York Concord vineyards, and practices have evolved in response to the economic pressures for maximum yield at a minimum acceptable juice soluble solids and the lowest production costs (see Bates and Morris 2009 for summary).
The effect of crop load, measured by Y:PW, on fruit quality and vine size has been characterized with mixed results in Vitis vinifera cultivars. A Carignane crop load study with an 8.0 to 19.6 Y:PW range, under warm climate conditions, showed delayed fruit maturity and reduction in vine size when Y:PW >10. Below a Y:PW of 10, yield was not a factor in wine quality (Bravdo et al. 1984). Crop load studies with Cabernet Sauvignon in Oakville, CA, (Y:PW range of 3 to 14) also supported Y:PW between five and 10 as being indicative of vines with balanced vegetative and reproductive growth (Kliewer and Dokoozlian 2005). Crop load values <5 were considered undercropped, did not respond to additional crop reduction, and were at risk of excessive canopy growth and cluster zone shading. Crop load values >10 were considered overcropped with delayed fruit maturation and retarded vegetative growth.
Several cool-climate crop load studies have questioned the appropriateness of these crop load indicators in regions where more leaf area per unit fruit may be needed to achieve optimum fruit maturity and vegetative growth (Howell 2001); however, these studies have provided little evidence to deviate from the general crop load response. Fruit-thinning studies with Pinot noir in Oregon and Merlot in Hawkes Bay, New Zealand, (Y:PW ranges 0.5 to 3.7 and 3.4 to 9.0, respectively) indicated excessive vegetative growth and canopy density in the fruiting zone as having a larger effect on fruit composition than crop load and questioned the need for fruit-thinning at these values (King et al. 2015, Reeve et al. 2018). Riesling crop load studies in New York and Washington (Y:PW ranges 2.9 to 9.9 and 8.2 to 11.4, respectively) both showed slight delays in fruit ripeness at the highest crop load levels but questioned if the minor improvement in fruit quality from fruit-thinning justified the economic cost in labor and crop loss (Keller et al. 2005, Preszler et al. 2013). Furthermore, differences in fruit composition and wine quality in these studies were attributed more to seasonal differences than to crop load at Y:PW between five and 10. Higher crop loads than those recommended (Y:PW >12) have been reported for some cool-climate V. vinifera and French-American hybrids without detrimental effects on fruit quality; however, these required canopy division to optimize leaf area exposure (Reynolds et al. 2009). This is similar for Concord on Geneva Double Curtain training but only on excessively large vines, which is not the norm for commercial Concord vineyards (Shaulis et al. 1966).
In New York Concord production studies, which evaluated different balanced pruning formulas or fruit-thinning to manipulate crop size in response to vine size, Y:PW ranged from five to 20 (Shaulis and Steele 1969, Shaulis 1980, Poni et al. 1994). Crop loads >10 had lower juice soluble solids than the maximum, eventually leading to the pruning severity recommendation that maintained crop loads between seven and 10. These crop loads in New York Concord vines ensured acceptable fruit maturity in any given season and tended to increase vine size over time. Under current production costs and market value for juice processing Concord, the economic breakeven point for producers is roughly 13.5 t/ha (6 tons/acre) and conservative balanced pruning only reaches those yields at large vine sizes, which is why historical recommendations for managing Concord vine size have targeted PW >1.2 kg/vine (~0.5 kg/m of trellis; Shaulis 1956). Commercial Concord producers, under current market conditions, consider Y:PW <10 as uneconomically sustainable because of low yields; however, consistently pushing high crop loads results in low, and possibly unmarketable, fruit quality while reducing vine size and return crop potential.
In a New York Concord study which measured the effect of pruning severity and yield on the harvest date for 16 Brix fruit (i.e., the industry standard), the harvest date was delayed at crop loads >11, but only by one week at crop loads as high as 20 (Bates 2008). Arguably, one week is an acceptable harvest delay for higher crop returns. In a Concord mechanization study which investigated mechanical shoot and fruit-thinning practices (Y:PW range 4 to 27), Y:PW values as high as 22 produced fruit with 16 Brix but with reduced vine size. However, crop loads between 11 and 14 have produced acceptable juice soluble solids and maintained vine size (Bates 2017). Recent spatial crop load mapping and variable-rate fruit-thinning studies in commercial New York Concord vineyards observed Y:PW from 15 to 45 in unthinned blocks. Mechanical fruit-thinning reduced mean Y:PW in separate management classifications from 30.1 to 19.8 and produced fruit above 16 Brix for the whole vineyard block (Bates et al. 2018, Taylor et al. 2019). The high crop load values, considered as substantial overcropping in other studies, and the wide range in crop load values under commercial Concord production illustrates the effect of market pressures on vineyard management.
Subjectively, vine balance for Lake Erie AVA Concord grapevines grown for the juice grape market is defined as growing the largest possible crop reaching 16 Brix by commercial harvest (30 to 40 days after veraison) and having no net change in vine size. Grower experience with crop-thinning also indicates a seasonal influence on the thinning level decision. The purpose of this study was to identify the Y:PW in Lake Erie Concord that matches a commercial definition of vine balance, determine if the method of crop size management (pruning or fruit-thinning) affects the crop load response on Brix and the seasonal change in PW, and understand how seasonal conditions change the target Y:PW for vine balance. Results will be used to improve seasonal pruning and fruit-thinning recommendations and give validation to spatial crop load vineyard maps.
Materials and Methods
This research investigated the response of Concord grapevines to crop load in two different but related studies. The first study compared the crop load response of Concord vines pruned to various levels against vines pruned to a relatively high node number and then fruit thinned midseason over a four-year period (2001 to 2004). The second study investigated the crop load response of midseason fruit-thinning over an 11-year period (1999 to 2009). These will be referred to as the “Pruning versus Thinning” and the “Thinning Response” studies, respectively.
Vineyard description
These studies were conducted in two neighboring 0.41 ha Concord vineyards planted in 1956 and separated by less than 70 m at Cornell’s Taschenberg Vineyard Laboratory in Fredonia, NY (42°27′N; 79°18′W). The experimental block elevation was 231 m asl with a 1 to 2% slope and a southeast aspect. The soil was well drained Chenango gravel-loam (USDA 1994) with a surface soil pH of 5.5 and 2% organic matter.
The Lake Erie grape production region is characterized by cool and humid conditions. The 92-year (1926 to 2018) average growing degree day (GDD) accumulation (base 10°C) from 1 April to 31 Oct recorded at the experiment site was 1532 GDD (Table 1). Average precipitation accumulation for the same time period was 630 mm, with rainfall being evenly distributed throughout the growing season. Supplemental irrigation was not used in these vineyards because it is rarely used for commercial Concord production in New York. The 39-year average budbreak was 3 May, and the 53-year bloom and veraison phenology dates were 13 June and 22 Aug, respectively. The seasonal GDD accumulations (1 April to 31 Oct, base 10°C) for the course of the 1999 to 2009 experiment ranged from 1343 to 1811. The warm 2005 season was the only year to be more than two standard deviations from the long-term GDD mean. The seasonal precipitation accumulation (1 April to 31 Oct) over the same period ranged from 390 to 950 mm. The dry 2007 season was the only year to be more than two standard deviations from the 92-year mean. Bloom and veraison were relatively consistent in 10 of the 11 years and were within six days of the long-term average. The exception to this was in 2003, when bloom and veraison were 11 and 10 days later than the long-term mean, respectively.
Weather and phenology from Cornell’s Taschenberg Vineyard Laboratory, Fredonia, NY, from 1999 to 2009. GDD, growing degree day.
The own-rooted Concord vines in both blocks were 43-years-old at the beginning of the experiment and were planted at a row-by-vine spacing of 2.7 × 2.4 m, with rows oriented in an east-west direction. Vines were cordon-trained to a trellis wire at 1.8 m. Floor, nutrient, pest, and disease management were done according to commercial standards for western New York Concord vineyards (Jordan et al. 1981). No-till weed management was used by maintaining a 1.2 mwide weed-free zone under the vines with pre- and postemergence herbicides, and treating row centers with one glyphosate application at bloom. Ammonium nitrate fertilizer was surface broadcasted at a rate of 56 kg/ha of actual N across the block in a single application near budbreak. Fungicide and insecticide materials and application rates were done according to the New York and Pennsylvania Pest Management Guidelines for Grapes (Weigle 2006) and varied annually depending on seasonal weather conditions.
Pruning versus Thinning study
For pruning treatments, two balanced pruning levels, 33 + 11 and 66 + 11, and one 100-node pruning level were used to achieve a range of crop levels over a range of vine sizes. For balanced pruning, vines were rough pruned to ~100 nodes, and the weight of one-year-old canes was recorded using a spring scale. The number of retained nodes was then adjusted to retain 33 or 66 nodes for the first 500 g of pruning weight and 11 additional retained nodes for each additional 500 g of pruning weight (imperial units = 30 + 10 or 60 + 10 per pound pruning weight). For the 100-node pruning treatment, vines were pruned to 100 retained nodes regardless of vine pruning weight. There were 36 count vines per pruning treatment grouped in six-vine plots in six randomized complete blocks; however, for this crop load response investigation, the individual vine measurements were used and the vine data regrouped for analysis based on crop load values rather than spatial location. The same vines received the same treatments for each of the four years.
For thinning treatments, 100 vines each year were pruned to have 120 retained nodes per vine, regardless of vine pruning weight. This was chosen to achieve a relatively high crop potential across a range of vine size classes. At 30 days after bloom, 25 individual vines were randomly selected from the original 100 vine population each year, and the fruit was removed and weighed. The mean crop size was used to calculate the weight of fruit needed to be removed to achieve 0, 25, and 50% crop reduction on the remaining 75 vines. On the vines to receive 25 or 50% crop removal, clusters were randomly removed at 30 days after bloom from individual vines and weighed until the target weight was achieved (Pool et al. 1993, Fendinger et al. 1996). Thinning treatments were assigned randomly to the vine population.
Different from the pruning treatments, the thinning treatments were applied on a new vine population each year. For example, vines pruned to 120 nodes and fruit thinned in 2001 were again pruned to 120 nodes but not thinned in 2002, to investigate the effect of altering crop load by fruit-thinning in year 1 on vine growth and the return crop size in year 2. A new set of vines, which were untreated in 2001, were pruned to 120 nodes and subjected to the thinning treatments in 2002. This process continued on a new vine population for each of the 11 experiment years.
Thinning Response study
The 120 nodes/vine pruning with midseason manual fruit (random cluster) thinning procedure described above was applied from 1999 to 2009. The number of vines used each year varied from season to season based on labor availability. From 1999 to 2004 and then again in 2006 and 2010, 100 vines (25 per crop level treatment) were used. In 2005, the vine number dropped to 24 (six vines per crop level treatment). From 2007 to 2009, 56 vines (14 vines per crop level treatment) were used in each year.
Vine measurements
Dormant vine pruning weight was measured on individual vines each year. Harvest date was determined when the juice soluble solids in the lower yielding treatments were between 16 and 17 Brix (Table 1). On average, this occurred at ~40 days after veraison and coincided with the first or second week of the commercial Concord harvest in the region. A 100 berry preharvest sample was randomly collected from two vertical planes transecting the east and west side of each vine. Juice soluble solids were measured with a hand-held refractometer (Leica model no. 10423, Leica, Inc.), and the clusters from each vine were manually harvested and weighed. Crop load was calculated as vine fruit weight divided by vine pruning weight at the end of a season (Y:PW).
Data analysis
The four-year relationship between pruning weight and yield at each pruning severity was done by binning observations for each year and pruning severity into groups at an interval of 0.1 kg/vine, and then calculating the mean for each year. Linear and exponential regression models were fitted in JMP (JMP Pro v13.1, SAS Institute, Inc., 2016). For the four-year Pruning versus Thinning crop load analysis, multiple linear regression was performed using standard least squares to investigate the effect of treatment (pruning or thinning), year, and Y:PW on juice soluble solids and the seasonal change in pruning weight. In both cases, year had an effect (p < 0.0001); therefore, within-year effects of treatment and Y:PW were further analyzed. To investigate the crop load response in each year, observations were binned into groups at intervals of Y:PW = 2, and linear regression was performed against harvest juice soluble solids and the seasonal change in pruning weight. The general crop load response was generated by calculating the mean for each bin (n = 4 years) and then performing linear regression analysis on the combined pruning and thinning data. Combining the data was done to understand the crop load response, regardless of whether it is achieved via altering the source (leaf) or sink (fruit) components. Different trials were plotted with different markers although, as hypothesized, the thinning and pruning treatments showed similar crop load response. For the crop load-juice soluble solids relationship, a segment linear regression (broken-stick) model was fitted. Observations from the 11-year thinning were similarly binned in intervals of Y:PW = 2 and the same linear and broken-stick regression fitting was performed for the general crop load responses (n = 11 years). The linear response equations for each year were used to investigate the effect of seasonal GDD and precipitation on the annual crop load response. Multivariate regression using standard least squares in JMP was used to investigate the effect of GDD and precipitation on the Y:PW to achieve 16 Brix or no seasonal change in pruning weight. To investigate the effect of year 1 Y:PW on year-two yield, the 11-year thinning observations, also binned in intervals of Y:PW = 2, were further grouped into small (0 to 0.6 kg/vine), medium (0.6 to 1.2 kg/vine), and large (1.2 to 1.8 kg/vine) vine size classes (roughly representing one-, two-, and three-pound vines, a common industry reference on standard commercial spacing) and subject to linear regression.
Results
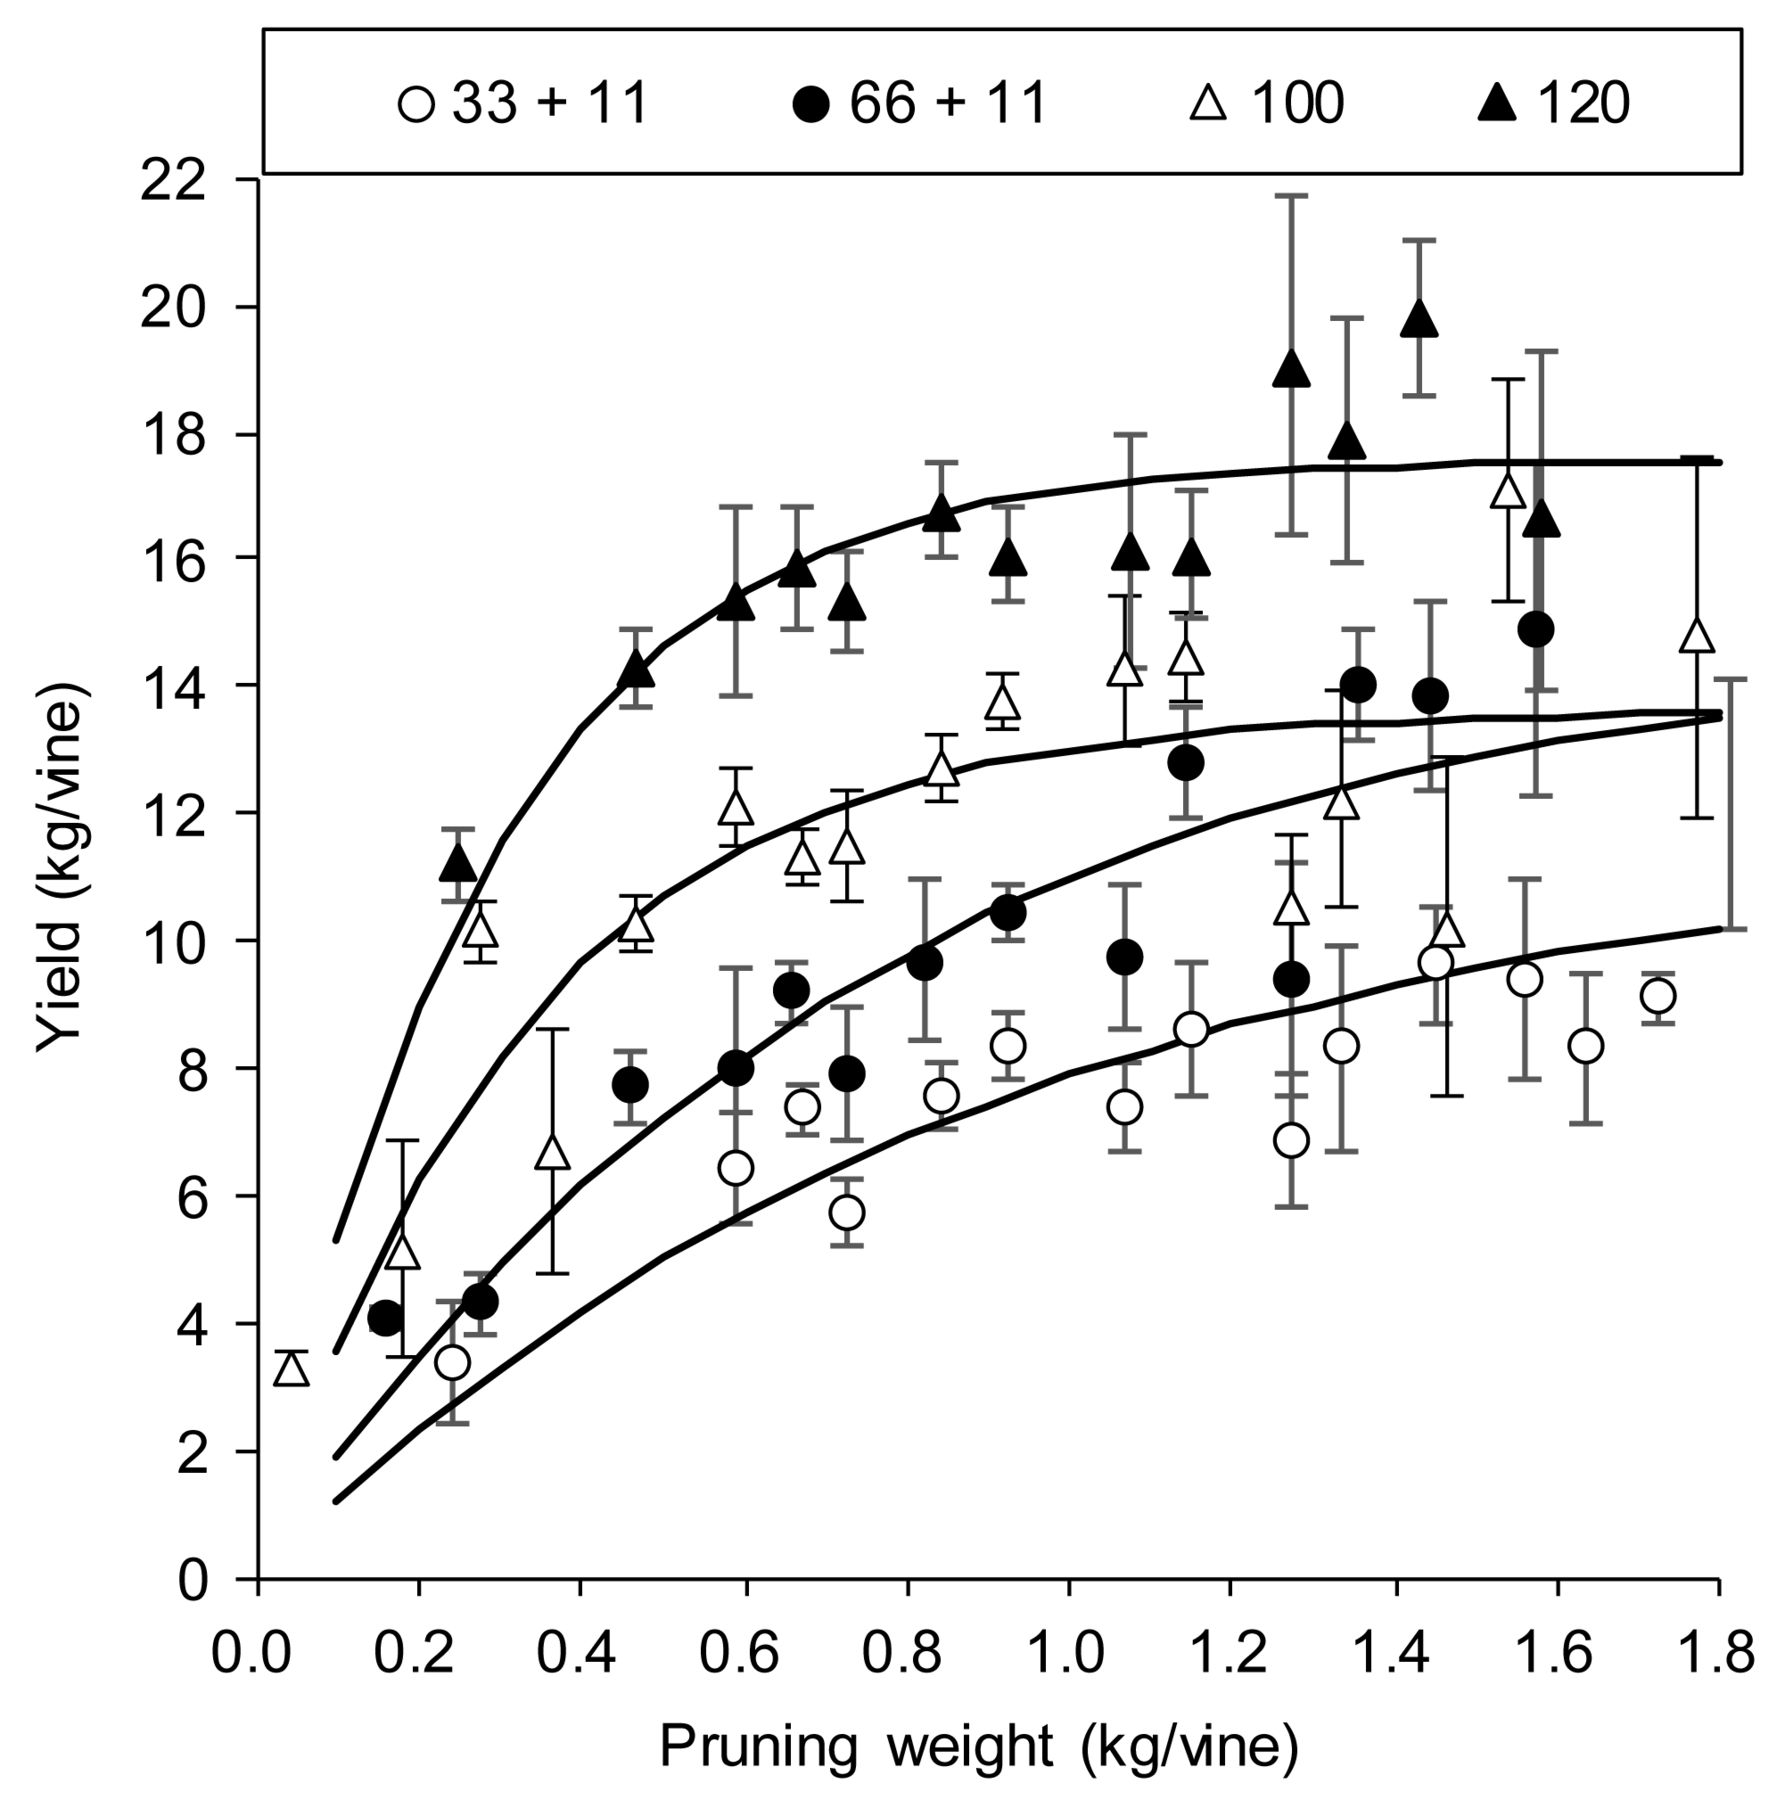
Pruning weight in the own-rooted Concord vines from 2001 to 2004 ranged from 0.2 to 1.8 kg/vine across all pruning levels (Figure 1). As expected, crop size increased as vine size increased, but the response was not linear and differed depending on pruning severity. Severe balanced pruning (33 + 11) had the lowest yield across all vine sizes because there were fewer retained nodes at any given vine size compared to the other pruning treatments. Balanced pruning retained more fruiting buds as vine size increased; therefore, shoot number, cluster number, and total fruit yield increased as vine size increased (data not shown). This was observed with 33 + 11 pruning; however, crop size did not fully plateau at the largest vine size, indicating that pruning had limited yield potential in this treatment. Balanced pruning at 66 + 11 had a similar vine size to yield response as the 33 + 11 treatment but with higher yields because of the less severe pruning formula. The 66 + 11 treatment also did not fully plateau but approached the same yield as the 100-node pruning at the highest vines size.

The effect of Concord pruning weight (PW) on fresh fruit yield at two variable node and two fixed node pruning severities. Vines were balanced pruned to retain 33 (open circles) or 66 (closed circles) nodes for the first 500 g pruning weight plus an additional 11 nodes for each additional 500 g or pruned to retain 100 (open triangles) or 120 (closed triangles) nodes per vine, regardless of pruning weight. Individual vine observations (n = 36 per year) from 2001 to 2004 were combined by pruning treatment and binned by 0.1 kg pruning weight (bars = ±SE). Fitted curves for 33 + 11: Yield = 11.8 - ([11.8] * EXP[-1.1 * PW]), R2 = 0.91; 66 + 11: Yield = 14.9 - ([14.9] * EXP[-1.3 * PW]), R2 = 0.94; 100 nodes: Yield = 13.6 - ([13.6] * EXP[-3.1 * PW]), R2 = 0.87; 120 nodes: Yield = 17.6 - ([17.6] * EXP[-3.6 * PW]), R2 = 0.88.
Less severe pruning at either 100 or 120 nodes/vine had higher yields than either of the balanced pruning treatments across the range of vine size. The shape of the vine size to yield response was slightly different for the fixed node treatments compared to the balanced treatments. In the fixed node treatments, there was a stronger positive response of yield to vine size at low pruning weight up to ~0.6 kg PW/vine. For both fixed node treatments, the response plateaued at ~1 kg PW/vine at a yield value of 13.6 kg fruit/vine and 17.6 kg fruit/vine for the 100 and 120 node pruning treatments, respectively.
Pruning versus Thinning study
The range of pruning severity and vine size created a population of Concord vines with crop loads (Y:PW) from 2 to 50 (Figure 2). Severe balanced pruning (33 + 11) tended to have the lowest crop load values, while 120-node pruning tended to have the highest crop load values. In addition to the pruning treatments described, 120-node vines were fruit thinned at multiple levels to adjust the crop load down and increase the crop load range. For comparison, the 33 + 11, 66 + 11, and 100-node pruned treatments were grouped to give a range of crop loads achieved through pruning severity. The 120-node pruned vines with and without fruit-thinning were grouped to give a range of crop loads achieved through fruit-thinning.

The effect of Concord yield:pruning weight (Y:PW) on harvest juice soluble solids from 2001 to 2004. Vines were grouped by pruning severity (33 + 11, 66 + 11, or 100 nodes: open symbols) or by 120-node pruning with midseason fruit-thinning (closed symbols). There were 108 pruning observations per year (36 per pruning level) and 75 thinning observations per year. Data was binned by crop load in intervals of 2 Y:PW (bars = ±SE).
There was a negative linear relationship between crop load and juice soluble solids for both pruning and thinning treatments in each year, except for thinned vines in 2001 (Figure 2). The mean gradient, excluding 2001 thinned vines, was -0.076, indicating that an increase in crop load by 13 decreased juice soluble solids by 1 Brix at harvest. There was an effect of Y:PW on juice soluble solids in every year, an effect of treatment in three of four years, and an interaction effect in 2001 and 2003 (Table 2). In 2001, the thinned vines had lower average yield and higher average pruning weight than the other three years, which compressed the crop load values to the lower end of the scale. In 2003, the response of juice soluble solids to crop load was greater for pruned vines than thinned vines. For the general response over four years, there was an effect of Y:PW on juice soluble solids but not a treatment effect nor an interaction effect on juice soluble solids (Table 2).
Multivariate analysis of yield:pruning weight (Y:PW) and treatment (pruning or thinning) on harvest juice soluble solids or the seasonal change in pruning weight in New York Concord from 2001 to 2004. Model used standard least squares and effect tests (Prob > F) are shown.
Similarly, there was a negative linear relationship between crop load and the seasonal change in vine pruning weight (Figure 3). The mean gradient for all years and treatments was -0.014, indicating that an increase in crop load by 7.1 decreased vine pruning weight by 0.1 kg. There was an effect of crop load on the change in pruning weight for each year and smaller effect of treatment in 2002 and 2004, where thinned vines had a greater increase in pruning weight (Table 2). There was neither a treatment effect nor an interaction effect on delta pruning weight when all years were combined.

The effect of Concord yield:pruning weight (Y:PW) on the seasonal change in pruning weight from 2001 to 2004. Vines were grouped by pruning severity (33 + 11, 66 + 11, or 100 nodes: open symbols) or by 120-node pruning with midseason fruit-thinning (closed symbols). There were 108 pruning observations per year (36 per pruning level) and 75 thinning observations per year. Data was binned by crop load in intervals of 2 Y:PW (bars = ±SE).
The four-year pruning and thinning data were combined to characterize a general Concord crop load response. A segmented regression (broken-stick) model was fitted to the Y:PW by harvest juice soluble solids relationship to capture the plateau at the lower Y:PW values (Figure 4A) as described by Equation 1. The general response indicated that maximum possible juice soluble solids occurred at or below a Y:PW of 7.2. The crop load to reach the industry standard of 16 Brix, however, occurred at a Y:PW of 20, on average.
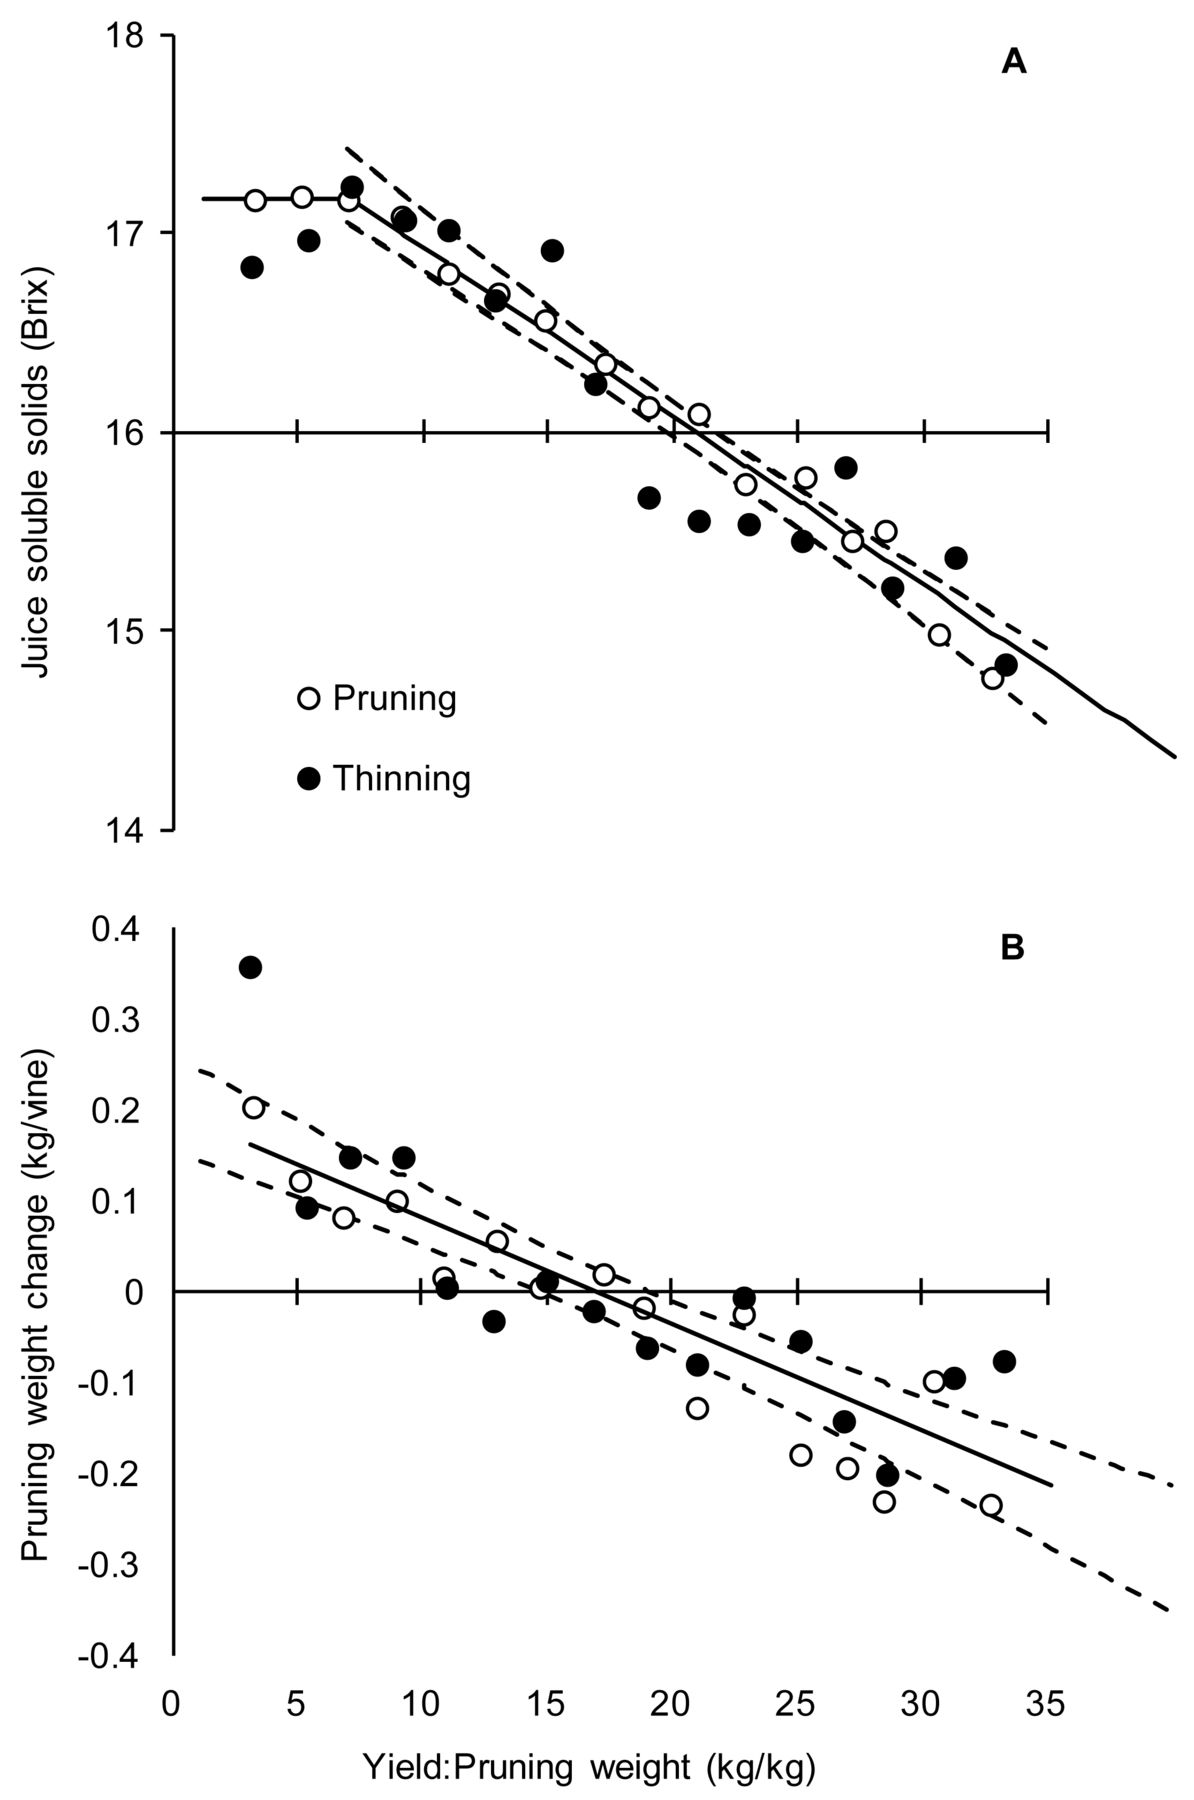
The general four-year Concord crop load response on harvest juice soluble solids (A) and seasonal change in vine pruning weight (B). Pruning severity (open circles) or midseason fruit-thinning (closed circles) was used to generate a range of yield:pruning weight. Each point is the mean of four years (n = 4). Pruning and thinning data were combined for the mean response. A broken-stick model was fitted to illustrate the inflection point on the juice soluble solids response (see Equation 1). For the pruning weight response, a linear model was used (see Equation 2). Dashed lines indicate 95% mean confidence limits.
 Eq. 1
Eq. 1The Y:PW by seasonal change in vine pruning weight did not plateau but exhibited a linear response across the full range of crop load values (Figure 4B) as described by Equation 2. On average, a Y:PW of 17.5 resulted in no net seasonal change in vine pruning weight.
 Eq. 2
Eq. 2The crop load response was very similar whether the crop loads were achieved through pruning or through thinning treatments (Figure 4).
Thinning Response study
From 1999 to 2009, crop load was calculated on vines pruned to 120 nodes and fruit was thinned to different crop levels. In each season, there was a negative linear relationship between crop load and juice soluble solids, and between crop load and the seasonal change in pruning weight (Figure 5). The mean gradient for the crop load to juice soluble solids response was -0.07 and the mean gradient for the crop load to pruning weight change was -0.016, both similar to the four-year Pruning versus Thinning study.

The effect of Concord yield:pruning weight on harvest juice soluble solids (A) and the seasonal change in vine pruning weight (B) from 1999 to 2009. Dashed lines are individual year trend lines and the solid lines are the mean response for all years. (n = 75 for 1999 to 2004, 2006, and 2010; 18 for 2005; and 42 for 2007 to 2009). The solid lines are the mean response (n = 11 years).
Using the average linear regression equations from the crop load versus juice soluble solids and versus pruning weight change (Figure 5), the Y:PW that achieved 16 Brix or no PW change in each season was calculated. The effect of seasonal GDD and precipitation on the predicted Y:PW to achieve 16 Brix or no seasonal change in PW was investigated by multivariate regression. There was an effect of GDD on the Y:PW to achieve 16 Brix, but no effect of precipitation or an interaction effect (Table 3). In contrast, the main effect in the multivariate model to predict the seasonal change in PW was precipitation, and GDD had no direct predictive power for the seasonal change in PW (Table 3). The univariate relationships between Y:PW for 16 Brix, Y:PW for no PW change, GDD, and precipitation are plotted in Figure 6. In general, in warmer seasons, 16 Brix could be achieved at a higher crop load (Figure 6A). The two warmest seasons, 2005 and 2007, achieved 16 Brix at Y:PW >40. In contrast, for the seasonal change in pruning weight, wetter seasons were able to attain no seasonal change in PW at higher crop loads (Figure 6D).
Multivariate regression effect tests of seasonal growing degree days or precipitation on the yield:pruning weight (Y:PW) needed to reach harvest juice soluble solids of 16 Brix or no seasonal change in vine pruning weight in New York-grown Concord from 1999 to 2009. GDD, growing degree days.

The effect of growing degree day (base 10°C) and precipitation (mm) accumulation on the yield:pruning weight (Y:PW) needed to achieve 16 Brix at harvest (A and B) or no seasonal pruning weight change (C and D) in New York Concord from 1999 to 2009. Data labels indicate year.
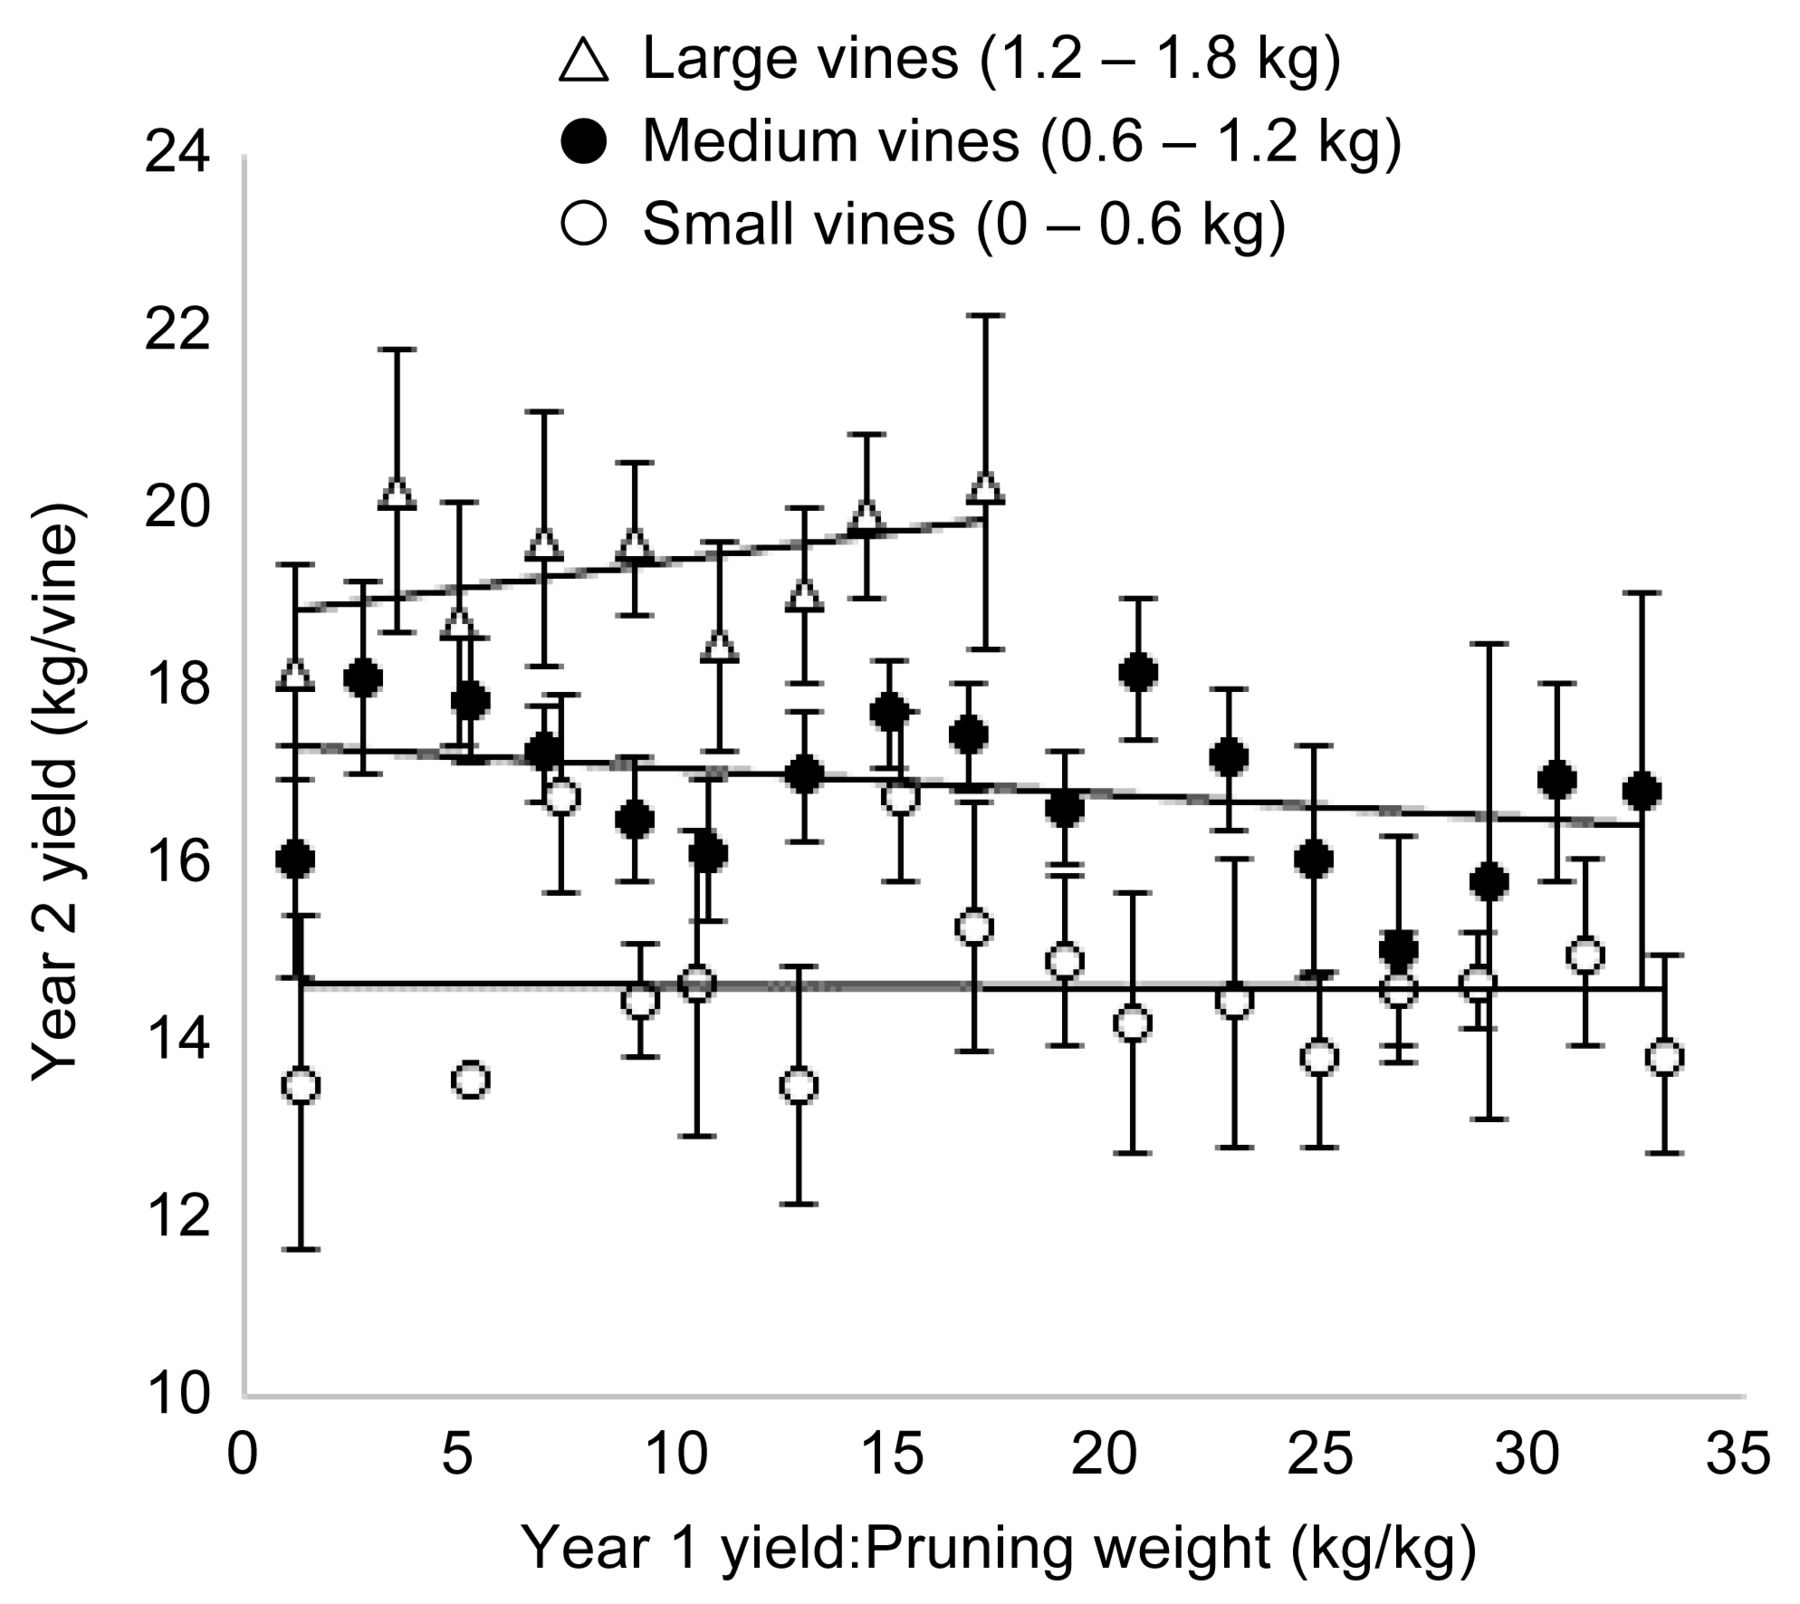
To investigate the effect of crop adjustment on return crop potential, vines in the thinning study were pruned to 120 nodes, fruit thinned in year 1, again pruned to 120 nodes, and received no other crop adjustment in year 2. Vines from the thinning study were further grouped into small (0 to 0.6 kg/vine), medium (0.6 to 1.2 kg/vine), and large (1.2 to 1.8 kg/vine) vine size classes to investigate the effect of year 1 crop load on year 2 crop yield. Within a vine size class, there was no effect of year 1 load on return crop yield over a wide range of crop load values (Figure 7). Year 1 crop load influenced the change in vine pruning weight in year 1 (Figures 3 to 5), but it was the absolute vine pruning weight at the beginning of year 2 which influenced yield potential in year 2.

The relationship of year 1 yield:pruning weight (Y:PW) on year 2 yield on small (0 to 0.6 kg), medium (0.6 to 1.2 kg), and large (1.2 to 1.8 kg) vine size classes in Concord grapevines. Data was pooled from an 11-year fruit-thinning study, grouped by vine size class, and binned in intervals of Y:PW = 2 (each point n = 10, bars = ±SE).
Discussion
The main objectives of this study were to characterize the crop load response in New York Concord grapevines, determine if the crop load response was influenced by pruning or fruit-thinning, and understand seasonal effects on crop load targets. The results from this study support the general Y:PW reported in accepted crop load theory (Bravdo et al. 1985, Kliewer and Dokoozlian 2005), but add details specific for Concord production for the juice grape industry in the Lake Erie AVA. Maximum juice soluble solids were achieved at Y:PW of ~7.2. Crop loads below 7.2 did not result in an increase in juice soluble solids but did continue to increase vine size. This is consistent with other fruit-thinning studies that showed little response of fruit maturation to crop load at Y:PW values below 10 and attribute fruit quality differences in this range to regional climatic conditions or seasonal variation (Keller et al. 2005, Preszler et al. 2013, Reeve et al. 2018). The crop load-Brix inflection point of 7.2 in this cool-climate study was slightly lower than the 10 to 12 reported in warmer climate studies (Kliewer and Dokoozlian 2005), supporting the theory that cool-climate grapevines need relatively more leaf area per unit fruit to reach maximum maturity. Given the wide range of Y:PW values, this slight difference does not practically change the accepted industry standard crop load range of five to 10 for high fruit maturity.
This study also supports the theory that vines become fruit sink limited at very low crop loads and extra vine photosynthates are diverted to vegetative structures. Conservative balanced pruning (33 + 11) consistently undercropped the vines (mean Y:PW = 7 and quartile range = 4.6 to 8.6) by limiting yields, even at large vine sizes. This is a possible pruning strategy for building vine size and improving the long-term productivity potential of young or stressed vineyards, but it is not a viable option for sustainable economic production. It is also consistent with other cool-climate crop load studies that describe excessive canopy growth and the need for canopy management at Y:PW <5.
The conservative to moderate balanced pruning formulas used by Shaulis and Steele (1969) promoted Concord crop loads that increased vine size each year. Because both vegetative and reproductive growth increased with vine size, the annual increase in vine size led to excessively large vines with increased leaf area, canopy density, and fruit zone shading. This led to the development and success of the Geneva Double Curtain divided canopy training and shoot positioning system to expose excessive leaf area to sunlight (Shaulis et al. 1966). However, the current economic pressures in the Concord industry has, in general, led to chronic overcropping and a reduction in vine size below the point where canopy division is beneficial.
Crop loads above 7.2 had a negative linear relationship with harvest juice soluble solids and seasonal change in vine size. In most other viticulture situations, where high fruit maturation is desired, this would be considered overcropping with incremental increases in Y:PW leading to greater reductions in juice soluble solids, or later harvest dates and decreases in vine size and return crop potential. Liberal balanced pruning (66 + 11) had a mean Y:PW of 11 (quartile range = 8.3 to 13.0) with juice soluble solids between 16.6 and 17.0 and a seasonal increase in vine size. This pruning management is appropriate for conservative producers who want to ensure a ripe crop in any given season and do not want to adopt fruit-thinning as a crop control strategy. Because retained nodes and yield increased with increasing vine size under this treatment, economic revenue is maximized at high vine size >1.2 kg/vine (0.5 kg/m of canopy).
Fixed node pruning at 100 nodes/vine without additional crop adjustment had a mean crop load of 17 (quartile range = 12.0 to 20.0) and tended to be on the high end with small vines and on the low end with large vines. In commercial Concord operations in New York, the term “grower pruning” typically refers to pruning standard spaced vines (2.7 m row × 2.4 m vine) to between 80 nodes on small vines and 100 nodes on large vines. This study indicated that 100-node pruning management reasonably satisfies the crop load goal for achieving 16 Brix fruit while maintaining vine size in New York Concord. The disadvantage of high node number “pruning only” crop management is that the crop potential is set during the dormant season and does not allow for in-season crop load adjustments. In the event of frost or poor fruit set, limiting bud number limits potential yield by limiting the number of secondary shoots, thereby undercropping the vines and limiting revenue. In contrast, high fruit set combined with a cool growing season, as experienced in 2003, results in overcropped vines with low juice soluble solids and a reduction in vine size. In this case, midseason fruit-thinning is an option to bring vines into balance.
Managing vines to a relatively high level of crop stress, together with the physical stress of fruit-thinning, makes high node number pruning a questionable treatment. In two of the four Pruning versus Thinning comparison years, and in eight of the 11 Thinning Response study years, vines pruned to 120 nodes without additional crop adjustment had Y:PW values >20 with reductions in juice soluble solids and vine size. In Lake Erie Concord production, there is a trend to retaining relatively high node numbers as a result of mechanized pruning and frost risk mitigation. Mechanized pruning reduces production costs but is less precise in managing retained node quantity and quality; therefore, producers err on the side of retaining too many buds. In this study, fruit-thinning one month after bloom reduced Y:PW, increasing harvest juice soluble solids and the seasonal change in pruning weight. The Concord crop load response was the same whether a given Y:PW was achieved through pruning severity or by retaining additional fruiting nodes followed by midseason fruit-thinning.
In practice, Concord crop estimation and adjustment are done by mechanical fruit-thinning with a harvester at approximately one month after bloom. The decision to fruit thin is primarily dictated by an assessment of vine crop load and vineyard goals for balance, as described in this study. Deciding how much fruit to thin, or retain, can be additionally adjusted by seasonal climatic conditions. The thinning data in this study indicated that warmer than average seasons achieved 16 Brix at higher Y:PW than cooler than average seasons. Assuming that GDD accumulation one month after bloom is reflective of total season GDD, high GDD accumulation at fruit-thinning means the vineyard can be managed to higher crop load levels and may require less thinning or no thinning at all. Low GDD accumulation at fruit-thinning would warrant more fruit-thinning to maintain higher sugar accumulation rates from veraison to harvest.
There was also an effect of seasonal precipitation on the change in vine pruning weight. Holding everything else equal, it is common to observe higher vine size in wet years and lower vine size in dry years. It raises an interesting question concerning the error associated with using pruning weight to estimate vine capacity. If a vine with a Y:PW of 17.5 has a vine size of 1.0 kg in an average precipitation year, 1.2 kg in a wet year, and 0.8 kg in a dry year, is the vine capacity different, possibly as a result of decreased photosynthetic capacity in dry years, or is it an artifact of growth habit, such as longer internode lengths in wet years?
On a broader scale, vine size did influence fruit yield potential at all pruning levels, as expected (Figure 2), but the return crop analysis in this study also showed that it did not matter how the vine size was achieved (Figure 7). For example, overcropping large vines in year 1, undercropping small vines in year 1, and balancing medium size vines in year 1, all resulted in medium size vines having the same yield potential in year 2 at a given pruning level. This illustrates the continual management interaction between crop load and the vine size-yield response, two concepts that are often confused. Crop load, managed as the Y:PW, influences if a vine will gain or lose pruning weight during a season; however, it is the absolute vine size (or vine capacity) during the dormant season that determines the next season’s yield potential.
Based on the crop load relationships and seasonal responses in this study, crop load ranges and recommendations were developed for NY Concord vine balance (Table 4). Climate change predictions for the northeast USA point toward warmer and longer growing seasons, longer spring frost windows, increased spring precipitation, and more frequent water shortages in the growing season (Wolfe et al. 2018). If managed properly, both warmer and wetter conditions indicate an opportunity to produce Concord grapes in the future at higher crop loads while maintaining high juice soluble solids and vine size. The potential increase in spring frost events is a risk that can be partially mitigated by retaining high node numbers, either manually or mechanically, and then adopting midseason fruit-thinning to balance vines if needed.
General crop load descriptions and management recommendations for Concord production in the Lake Erie AVA.
Conclusions
The response of Concord in New York to crop load, measured as Y:PW, was similar to previously reported studies with respect to harvest juice soluble solids and the seasonal change in vine pruning weight. There was a negative relationship between crop load and juice soluble solids, which reached a maximum at a Y:PW of 7.2 and with no further increase below 7.2. The seasonal change in vine pruning weight also increased with decreasing crop load but did not plateau. The crop load response to juice soluble solids and vine size was the same whether the crop load was adjusted through changes in pruning severity or by light pruning followed by midseason fruit-thinning. There was a positive linear relationship between seasonal GDD and the Y:PW needed to reach 16 Brix, as well as between seasonal precipitation and the Y:PW required to observe no seasonal pruning weight change. The results of this study were used to develop a crop load management model for NY Concord, which integrates the juice grape industry parameters for 16 Brix fruit, sustainable vine size and production, spring frost mitigation, seasonal environmental variation, and possible climate change effects. Annually, the Cornell Lake Erie Research and Extension Laboratory (CLEREL) research group tracks weather, Concord phenology, and Concord fresh berry weight on a set of sentinel vines and provides this information to the growers for crop estimation and management through the Lake Erie Regional Grape Program. The Concord crop load model developed here will integrate with this information to assist growers with midseason crop estimation and fruit-thinning management. The crop load response information from this study can also be used to provide viticulture context to spatial vineyard crop load mapping where normalized difference vegetation index and yield monitor spatial sensor data can be used to calculate spatial vineyard crop load maps.
Acknowledgments:
This research was supported by the Lake Erie Grape Processors, the New York Wine and Grape Foundation, and the USDA-NIFA Specialty Crop Research Initiative Award No. 2015-51181-24393. The authors thank the late Dr. Nelson Shaulis for establishing the pruning level research at the Taschenberg Laboratory in Fredonia, NY, and acknowledge the effort of laboratory staff members Ted Taft, Paula Joy, Kelly Link, and Madonna Martin in vineyard maintenance and data collection.
Footnotes
By downloading and/or receiving this article, you agree to the Disclaimer of Warranties and Liability. The full statement of the Disclaimers is available at http://www.ajevonline.org/content/proprietary-rights-notice-ajev-online. If you do not agree to the Disclaimers, do not download and/or accept this article.
- Received May 2020.
- Revision received August 2020.
- Accepted August 2020.
- Published online January 2021
This is an open access article distributed under the CC BY license (https://creativecommons.org/licenses/by/4.0/).
Literature Cited
Vol 72 Issue 1


Jump to section
Related Articles
Cited By...
More from this TOC section
Similar Articles
