


Article Figures & Data
Figures
- Figure 1
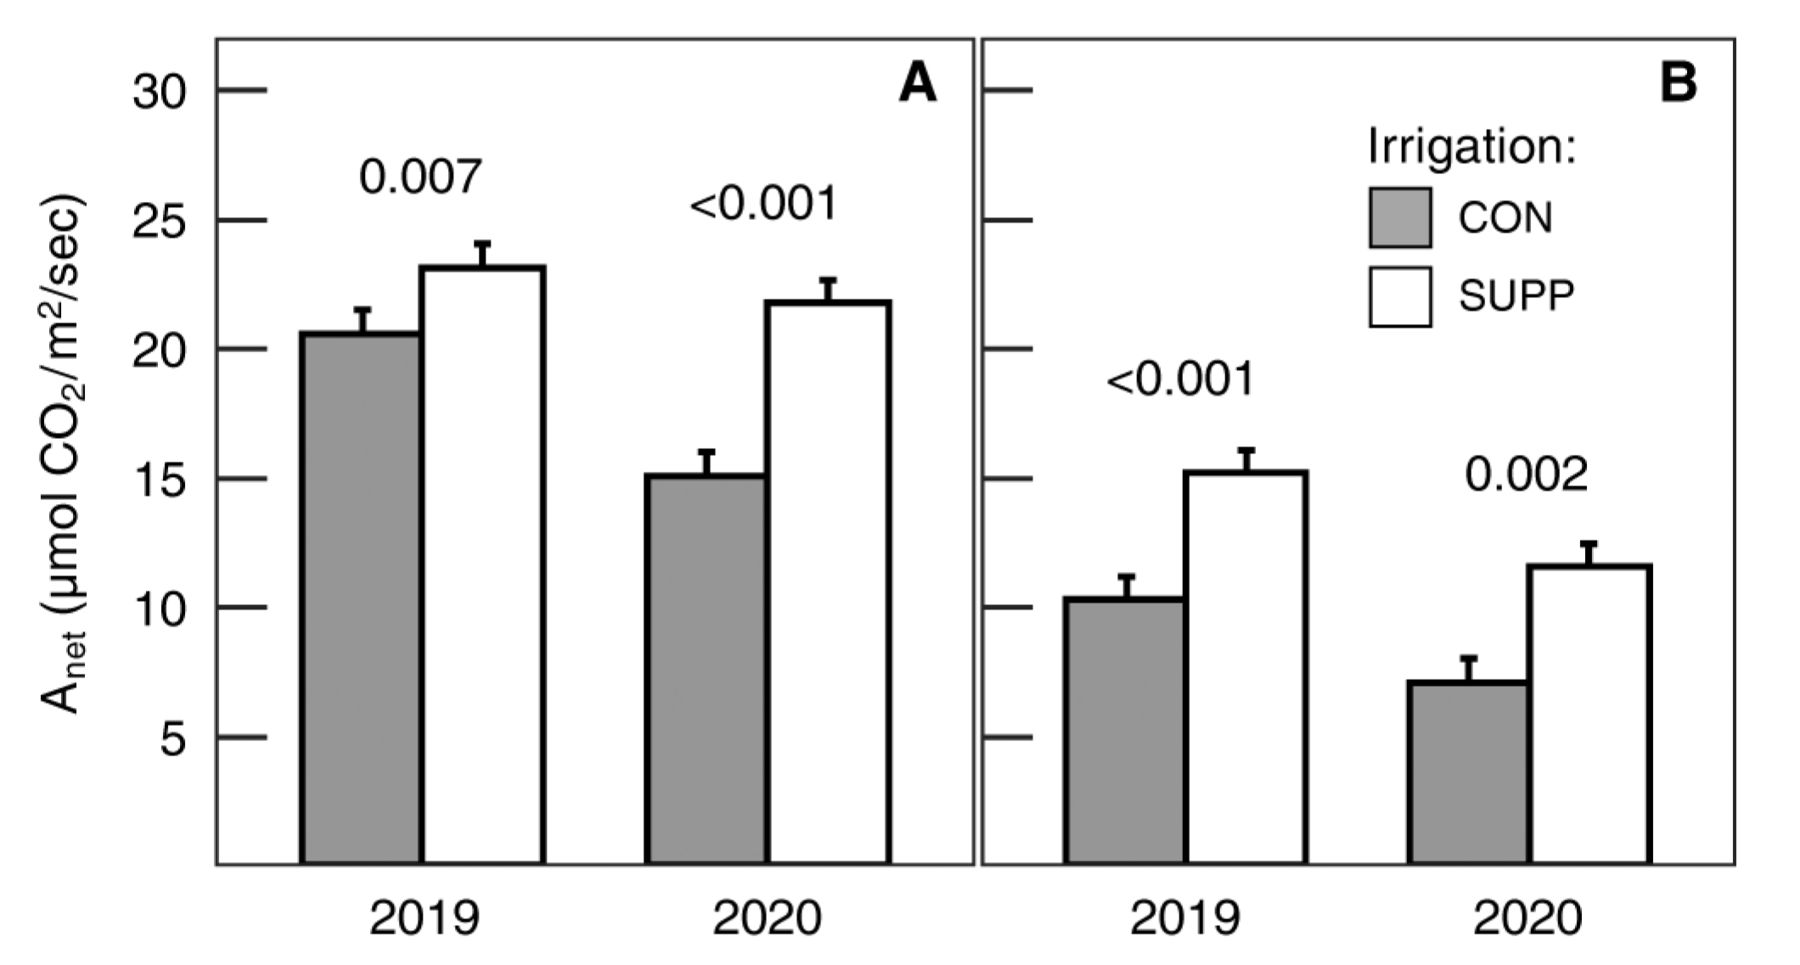
Response of photosynthesis to irrigation treatments preveraison (A) and postveraison (B). Data are means ± one standard error averaged across fertilizer treatments (n = 8). The p values in the figure reflect the contrasts between irrigation treatments within a given year. CON = Control (grower standard); SUPP = Supplemental (2× grower standard); Anet = net carbon assimilation.
- Figure 2
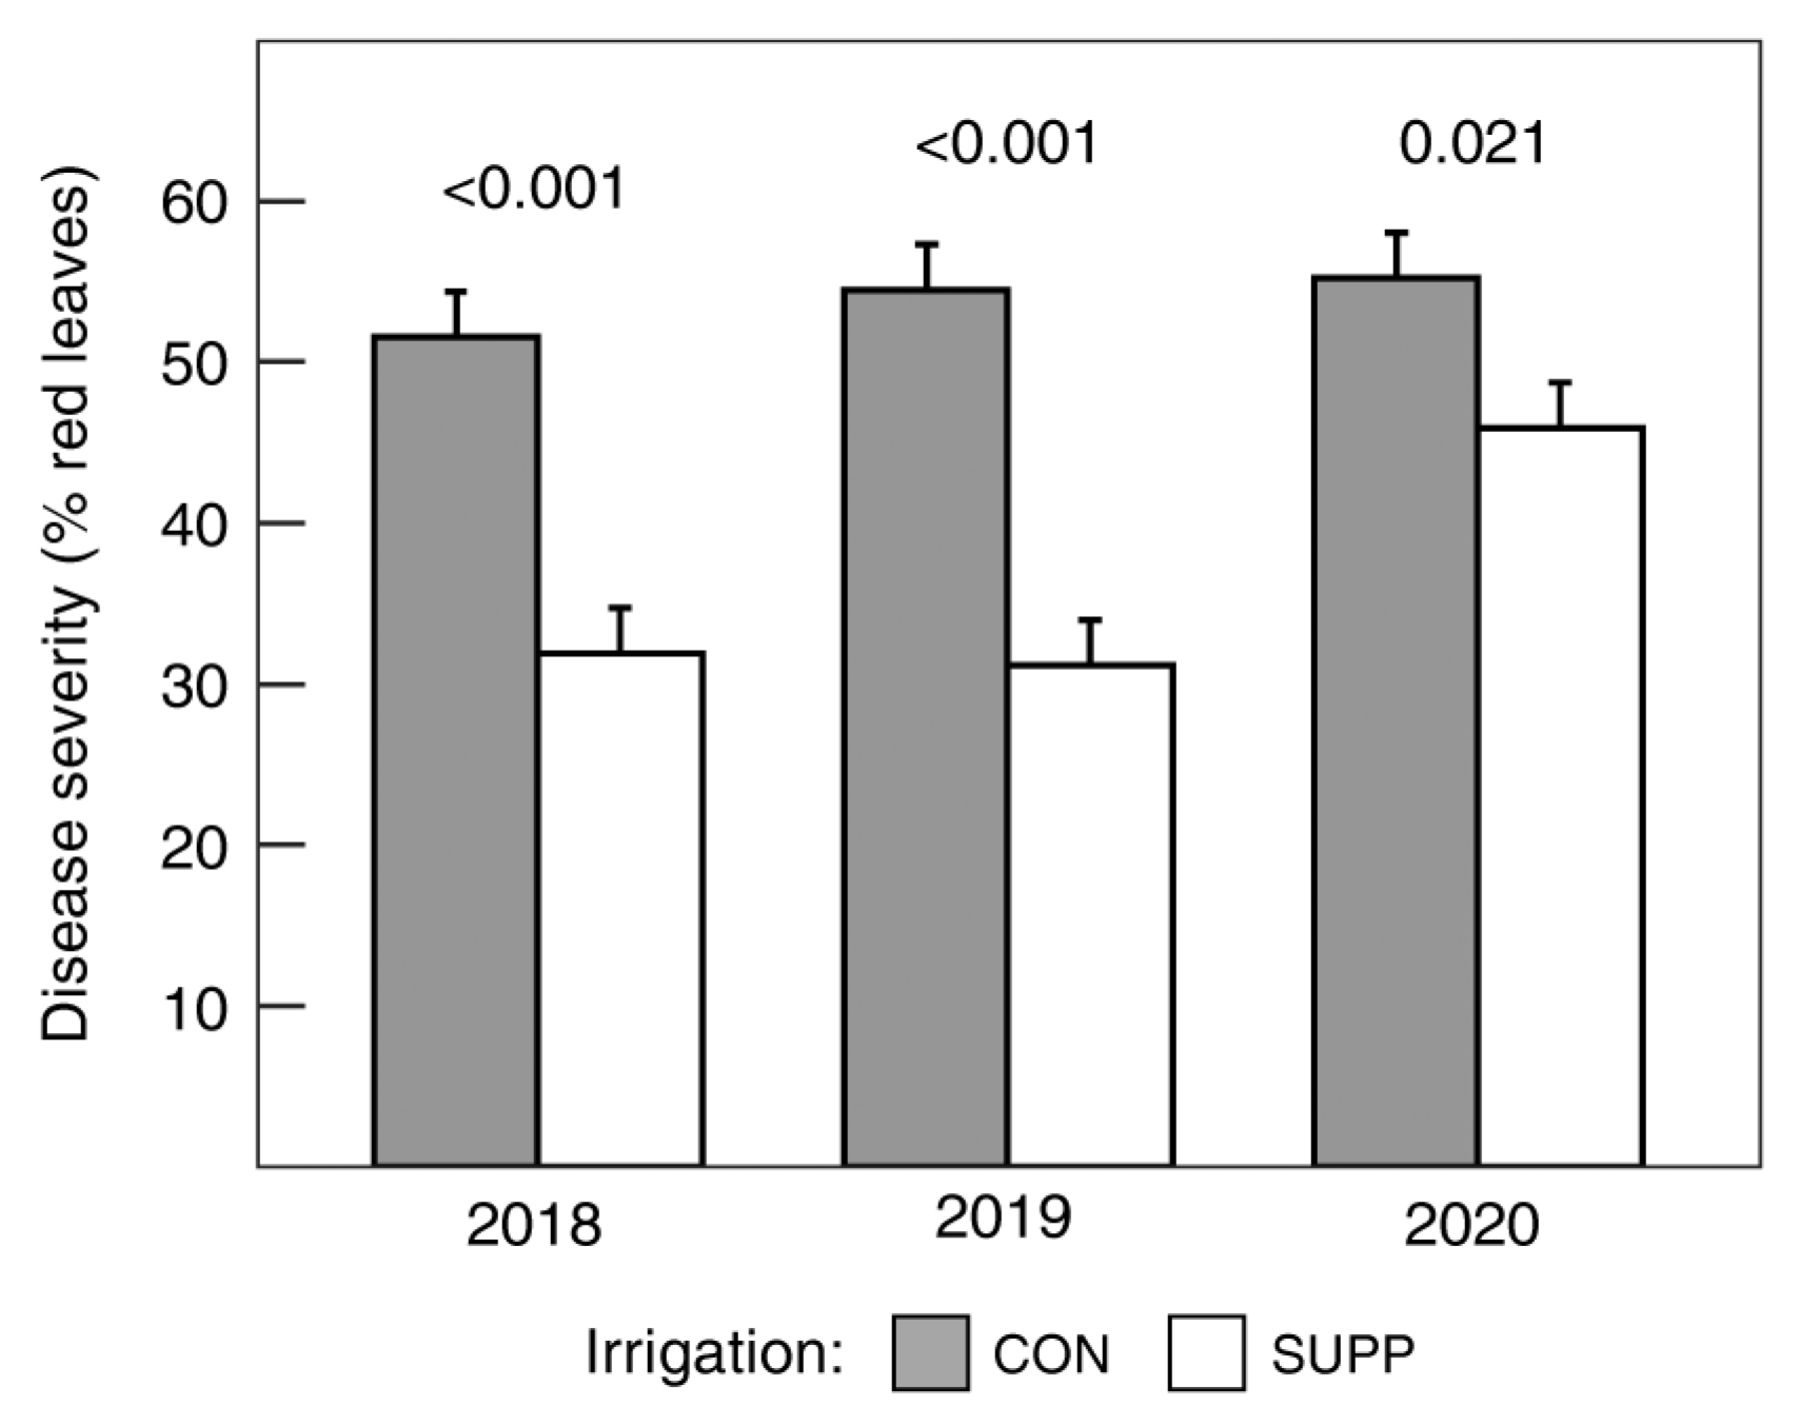
Response of disease severity to irrigation treatments at harvest, estimated as percent symptomatic leaves per vine. Data are means ± one standard error averaged across fertilizer treatments (n = 8). The p values in the figure reflect the contrasts between irrigation treatments within a given year. CON = Control (grower standard); SUPP = Supplemental (2× grower standard).
- Figure 3
Response of sugar per berry as a function of stem water potential (Ψstem) (A), net carbon assimilation (Anet) (B), pruning mass (C), and vine leaf area (D). Data are pooled from 2019 to 2020 and correspond to means averaged across fertilizer treatments. Ψstem data are averaged across the treatment period, from the commencement of irrigation to harvest. Anet and leaf area data are postveraison means. Leaf area data are only available for 2020 as plotted here using data from three weeks postveraison. Sugar per berry values as a function of Ψstem, Anet, pruning mass, and vine leaf area, respectively, were fit to the following asymptotic equations using nonlinear least squares:

Akaike’s Information Criterion values were -156, -146, -141, and -88 for Ψstem, Anet, pruning mass, and vine leaf area, respectively. CON = Control (grower standard); SUPP = Supplemental (2× grower standard).


Tables
- Table 1
Response of water status, photosynthetic rate, and stomatal conductance to treatments and year. Water status data are means ± one standard error (n = 4) from three and four sampling dates in 2019 and 2020, respectively, during the treatment period. Gas exchange data are means ± standard error (n = 4) for one and two sampling dates in 2019 and 2020, respectively.
- Table 2
Response of vegetative growth to treatments and year. Data are means ± one standard error (n = 4).
- Table 3
Response of yield and yield components at harvest to treatments and year. Data are means ± one standard error (n = 4).
- Table 4
Response of primary berry chemistry at harvest to treatments and year. Data are means ± one standard error (n = 4).
- Table 5
Response of secondary fruit composition per unit fresh weight (FW) at harvest to treatments and year. Data are means ± one standard error (n = 4).


Supplemental Table 1 Evaporative demand and water supply. Growing degree days (GDD), reference evapotranspiration (ET0), and growing season precipitation are accumulated from 1 April to 30 Sept. Dormant season precipitation is accumulated from 1 Oct of the prior year to 31 March. Applied irrigation quantities are shown for the control (CON) irrigation treatment and are accumulated from irrigation onset to harvest.
Supplemental Table 2 Phenology by date and accumulation growing degree days (GDD). GDD are accumulated from 1 April.
Supplemental Table 3 Total applied nutrients per fertilizer treatment for each year. Quantities are expressed as total elemental mass.
Supplemental Table 4 Nutrient status at veraison per treatment and tissue type.
Supplemental Table 5 Response of secondary fruit composition per berry at harvest to treatments and year. Data are means ± one standard error (n = 4).
Supplemental Table 6 Response of wine composition to treatments and year. Data are means ± one standard error (n = 4).
Supplemental Figure 1 Response of stem water potential (Ψstem) to irrigation treatments. Data are means ± one standard error averaged across fertilizer treatments (n = 8). The p values in the figure reflect the contrasts between irrigation treatments. CON = Control (grower standard); SUPP = Supplemental (2× grower standard).
Supplemental Figure 2 Response of yield to irrigation treatments at harvest. Data are means ± one standard error averaged across fertilizer treatments (n = 8). The p values in the figure reflect the contrasts between irrigation treatments. CON = Control (grower standard); SUPP = Supplemental (2× grower standard).
Supplemental Figure 3 Response of berry mass to irrigation treatments at harvest. Data are means ± one standard error averaged across fertilizer treatments (n = 8). The p values in the figure reflect the contrasts between irrigation treatments. CON = Control (grower standard); SUPP = Supplemental (2× grower standard).
Vol 72 Issue 4


Jump to section
Related Articles
Cited By...
More from this TOC section
Similar Articles
