


Abstract
Background and goals Differential thermal analysis (DTA) is a popular semi-automated method to determine the temperature at which plant tissues freeze. It is used to evaluate effects of environmental variables, genotypes, and agronomic practices on cold hardiness, and as an Extension tool to monitor cold hardiness and provide decision support for growers of many specialty crops.
Methods and key findings This study evaluated common approaches in sampling and preparation of dormant grapevine compound buds for DTA to provide a reference point as to which adjustments might cause excessive variation in subsequent data. Common adjustments in sample preparation, such as using foil packets, moistened tissue paper, or bud orientation, had no consistent effects on DTA values, typically resulting in a variation of <1°C. The same was true for storage (or shipping conditions) of 24 hrs or less, provided samples were maintained at low, but above-freezing temperatures (1.6 to 4°C). Finally, influence of bud position along the length of the cane was also inconsistent.
Conclusions and significance The robust nature of DTA for estimating grapevine cold hardiness offsets the potential impact of variation introduced from different sample preparation methods. These results can help those wishing to develop DTA protocols or expand their capacity to conduct DTA analysis to design protocols to best suit their individual program needs. Consistency in DTA approach is likely more important than the specific methods used, especially when comparing relative differences in observed lethal temperatures.
Introduction
Low-temperature injury to dormant grapevines (Vitis sp.) is a common occurrence in cool and continental climate viticulture regions (Clark 1936, Clore et al. 1974, Fennell 2004, Zabadal et al. 2007, Davenport et al. 2008, Dami et al. 2012, Londo and Martinson 2015). This injury occurs in multiple forms, from phloem damage that is repairable (Esau 1948), to damage to overwintering compound buds, which triggers management responses to mitigate crop loss, to permanent damage to the xylem and vine death, which results in vine retraining or vineyard replanting (Wolfe 2001). Given the potential economic impact cold damage has on commercial grape production, there have been concerted efforts to develop methods of estimating cold hardiness and to understand acclimation and deacclimation in grapevine (e.g., Pellett 1971, Clore et al. 1974, Stergios and Howell 1977, Wolf and Pool 1987, Wolf and Cook 1994, Ferguson et al. 2014, Dami et al. 2016, North et al. 2021).
Central to these efforts has been the advancement of cold hardiness monitoring techniques and technologies, from visually assessing damage after naturally occurring cold events (Clark 1936, Zabadal et al. 2007, Davenport et al. 2008, Moyer et al. 2011, Dami et al. 2012), to controlled freezing of tissue and visual damage assessment (Clore et al. 1974), to a semi-automated procedure with controlled freezing and measurement of the temperature at which intra- and intercellular water freezes (Wample et al. 1990, Wolf and Cook 1994, Mills et al. 2006). The advancement of cold hardiness evaluation approaches has also seen an increase in the number of studies using these tools to evaluate the influence of genetic, environmental, or horticultural factors on cold hardiness of grapevines (Wolpert and Howell 1984, Wample et al. 1993, Davenport et al. 2008, Zhang and Dami 2012, Ferguson et al. 2014, Shellie et al. 2014, Londo and Martinson 2015, Buztepe et al. 2017, Londo and Kovaleski 2017, Yilmaz et al. 2021), and many other specialty crops. These include fruit crops such as peach (Prunus persica; Liu et al. 2019), sweet cherry (Prunus avium; Kose and Kaya 2022), apricot (P. armeniaca; Kovaleski 2022), blackberries and raspberries (Rubus spp.; Warmund and George 1990); ornamental crops such as Eastern redbud (Cercis canadensis), flame azalea (Rhododendron calendulaceum), and forsythia (Forsythia spp.) (Kovaleski 2022); and forest species such as balsam fir (Abies balsamea), red maple (Acer rubrum), and sugar maple (Acer saccharum) (Neuner et al. 2019, Kovaleski 2022).
The increased interest in evaluating cold hardiness has also increased the number of methods for sample collection and processing for cold hardiness evaluation. Many of these alternative approaches have been devised to overcome some regional or resource limitation that would otherwise prevent the intended study. Whether or not it is necessary, this has also led to scrutiny over protocol approaches with the concern that different approaches are likely to introduce error in the accuracy of results obtained by differential thermal analysis (DTA). All evaluations of DTA are estimates of freezing resistance and cold hardiness. The principle of DTA is direct measurement of the low temperature exotherm (LTE), a measure of intracellular ice formation when the mechanism of supercooling fails (Graham and Mullin 1976). Measuring LTE allows more rapid assessment of bud cold hardiness than the laborious task of visual assessment of internal bud oxidative browning following low temperature events (Andrews et al. 1984, Wolf and Pool 1987, Wample et al. 1990, Wolf and Cook 1994, Mills et al. 2006, Dami et al. 2016, Londo and Kovaleski 2017, North et al. 2021). However, estimating bud cold hardiness from a collection of dormant buds using DTA is simply that – an estimate. While the absolute cold hardiness may never be known, knowing what an LTE value is relative to a treatment of interest (i.e., result of a viticulture practice, time in season, or another variety) can provide both useful scientific evidence for understanding a physiological process, or a practical guide for developing cold-response strategies. Most studies evaluating cold hardiness compare treatments or contrasts between varieties, rather than determining the absolute value of cold hardiness. DTA is frequently presented as the mean of a population subsample (Mills et al. 2006, Londo and Kovaleski 2017), demonstrating the value of precision. However, it should be noted that some studies have preferred to use the median (e.g., Wolf and Pool 1987, Dami et al. 2016). Additionally, all current methods for evaluating cold hardiness require removal of tissue samples from the field, precluding any possibility of measuring true, field cold hardiness. Thus, we suggest that best practices associated with DTA in grapevine, and perhaps other perennial cropping systems, should focus on what reduces the amount of error observed in that system (precision), rather than on achieving the “absolute” value (accuracy), which may never be determined.
A common criticism of studies conducting DTA involves the temperature at the time of sample collection and the time taken during processing (Kaya and Kose 2020). If sample collection and preparation is not done rapidly, and samples are not maintained at the same temperature as experienced during collection, then rapid deacclimation would shift observed cold hardiness values. Effects of preconditioning canes with subfreezing temperatures demonstrates it is possible to shift LTE measurements to lower values (Quamme 1986). Dehydration of collected canes can also alter LTE measurements, shifting them lower as dehydration increases over time (Kovacs et al. 2002). While some studies have looked at the potential for collection temperature to have a meaningful impact on DTA analysis, most focused on storage conditions that are well-above typical storage and transport temperatures (i.e., 20°C versus 0 or 4°C) and extrapolate those findings to apply to all pre-processing storage conditions (e.g., Kaya and Kose 2020). Understanding the true impact of these factors on the accuracy and precision of DTA could improve the efficiency of sample collection and might also facilitate development of DTA “centers” to process out-of-area samples. Furthermore, if these factors turn out to be of only minor importance for DTA accuracy, this would permit direct comparison of data collected in different laboratories.
Selection of the nodes used for DTA analysis varies among research groups, presumably in part due to differences in pruning styles, location, and training systems (Howell and Shaulis 1980, Wolpert and Howell 1984, Wolf and Pool 1987, Dami et al. 2016, Wang et al. 2020, North et al. 2021). It is common for dormant cane collection in the field to target buds at position 3 through position 12 from the cane base. However, restricting DTA analysis to buds at these positions limits the capacity to evaluate varieties in small plot trials, mapping populations (Wang et al. 2020), and germplasm repositories (Londo and Kovaleski 2017), resulting in fewer sample points being examined, thus reducing replication.
The objectives of this study were to: 1) evaluate several sample preparation procedures that are commonly described in DTA protocols evaluating cold hardiness of Vitis compound (overwintering) buds; 2) assess how storage or shipping of buds might impact cold hardiness assessments; and 3) understand how bud position may or may not impact observed cold hardiness. The study emphasis was to determine the sources of error common in cold hardiness assessments and to place that error into the appropriate biological context for research and extension outcomes. These results could assist those conducting DTA to best evaluate their own procedures and error tolerance. It may also remove unnecessary research and review barriers that might prevent groups from collaborating on, or publishing, bud cold hardiness information that is regionally to globally relevant. This includes limitations on equipment style and availability (which may require differences in sample preparation or storage) and limitations on the types of buds that can be collected for evaluation imposed by pruning strategies (cane versus spur) that are common in cold-winter production systems.
Materials and Methods
Basic approach and equipment used in DTA of grapevine organs
In all experiments, the overwintering compound buds of various grape (Vitis spp.) varieties were examined with DTA. Buds were sampled at various times (November through March) over the dormant period in the northern United States as described for specific experiments. Buds were excised from canes within 30 min of collection from the field (unless specified differently for individual experiments) by removing the bud and as much of the bud cushion as possible, so as to not negatively impact cold hardiness as described (Pratt and Pool 1981, Quamme 1986). Removing buds from the cane tissue, preparing the samples in the sample wells, and engaging the freezer program was typically completed within 45 min. In Wisconsin, bud excision and preparation can exceed the 45 min mentioned above due to the original design of the DTA system. However, at this location, cane and bud tissues are kept cool with water ice coolers during setup. The Wisconsin location only participated in Experiment 2. Buds were then prepared for DTA as described for each experiment below.
The general DTA approach used by all laboratories participating in this study was as described (Mills et al. 2006), with modifications as described for individual experiments. Generally, five to nine buds were placed on a thermoelectric module (TEM), nestled inside each sample well, and an LTE was recorded for each individual primary bud. The freezing program reduced the chamber temperature from +4°C to −40°C at a rate of −4°C/hr. Multiple programmable freezing units were used in the course of this study. High temperature exotherms (HTEs) were noted and values for LTEs extracted from the DTA data were interpreted visually by experienced users based on the data-plotting software used at each location (Washington, Wisconsin, or New York). LTE peaks were recorded as changes in voltage across a TEM plate, with temporal reference to the temperature as recorded by a thermocouple.
In New York, four different programmable freezing units were used. Sample plates and dataloggers were as described (Mills et al. 2006). Three of the systems used a Tenney T2C environmental chamber and the fourth system used a BTC Tenney freezer (Tenney Environmental). Each freezer setup had capacity for four sample trays with nine sample wells and a dedicated well for temperature tracking. All units employed a removable internal air deflector to improve air distribution and temperature evenness around the sample plates. All freezer units were housed in a single laboratory space on the AgriTech campus of Cornell University, Geneva, NY. Data were recorded from each freezer unit using either a Keithley 2700 or 2701 multimeter data acquisition system (Keithley Instruments) linked with a dedicated computer running the BudFreezer program (Brock University Technical Services, Electronics Shops, Guelph, Canada). Visual identification of exotherm peaks was conducted by an experienced user, using the BudProcessor and BudLTE programs (Brock University Technical Services, Electronics Shops).
In Washington, two different programmable Tenney T2C units were used, both designed as described (Mills et al. 2006), except that the WA-1 unit had sample trays permanently wired to the data logger, while the WA-2 unit had detachable sample trays that connected to the data logger via a 25 pin D-sub connector. Each freezer setup had capacity for four sample trays, each with nine sample wells and a dedicated well for temperature tracking. Both units had internal air deflectors to improve air distribution and temperature evenness. Units were housed in separate facilities at the Washington State University Irrigated Agriculture Research and Extension Center in Prosser, WA. Exotherm peaks were identified visually by an experienced user.
In Wisconsin, a single programmable Tenney T2C freezing unit was used and DTA was performed using a modified combined method based on Mills et al. (2006) and Einhorn et al. (2011). Ten TEM sample wells (models HP-127-1.4-1.5-74 and SP-254-1.0-1.3, TE Technology), housed in individual hinged tin-plated steel containers, were evenly spaced and attached to each of four 30 × 30 cm perforated aluminum sheet pieces (“trays”; 40 TEMs total). The TEMs of each tray were wired to a single 24-pin D-sub connector. One copper-constantan (Type T) thermocouple (22 AWG) was positioned on each tray to monitor temperature in proximity to the TEM units. Trays were positioned vertically in the freezing unit, and TEMs and thermocouples were connected to a Keithley 2700 multimeter data acquisition system (Keithley Instruments). TEM voltage and thermocouple temperature readings were collected at 15-sec intervals via a Keithley add-in in Excel (Microsoft Corp.). Freezing chamber fan turbulence was mitigated by covering individual trays with 1.27 cm thick open-cell foam sheets, with a removable piece of perforated corrugated cardboard across the top of the chamber’s interior to function as a diffuser. Exotherm peaks were identified visually by an experienced user.
Experiment 1 - Evaluation of sample preparation techniques
To evaluate the influence of sample preparation method, we designed a series of experimental treatments to prepare plant material for DTA using different methods currently employed by research groups (Table 1). These included placing buds in sample trays: 1) with or without moistened tissue paper, 2) with or without aluminum foil packets, and 3) with either the cut surface of the bud (inclusive of a small section of underlying cane/bud cushion) placed facing up (away from the TEM) or down (against the TEM). In all cases, LTE peaks were identified, indicating detection of the freezing event was not prevented by any one treatment. However, the variation between the temperature at which an LTE occurred from a pooled sample of buds and the derived mean of temperature at which an individual LTE occurs may differ.
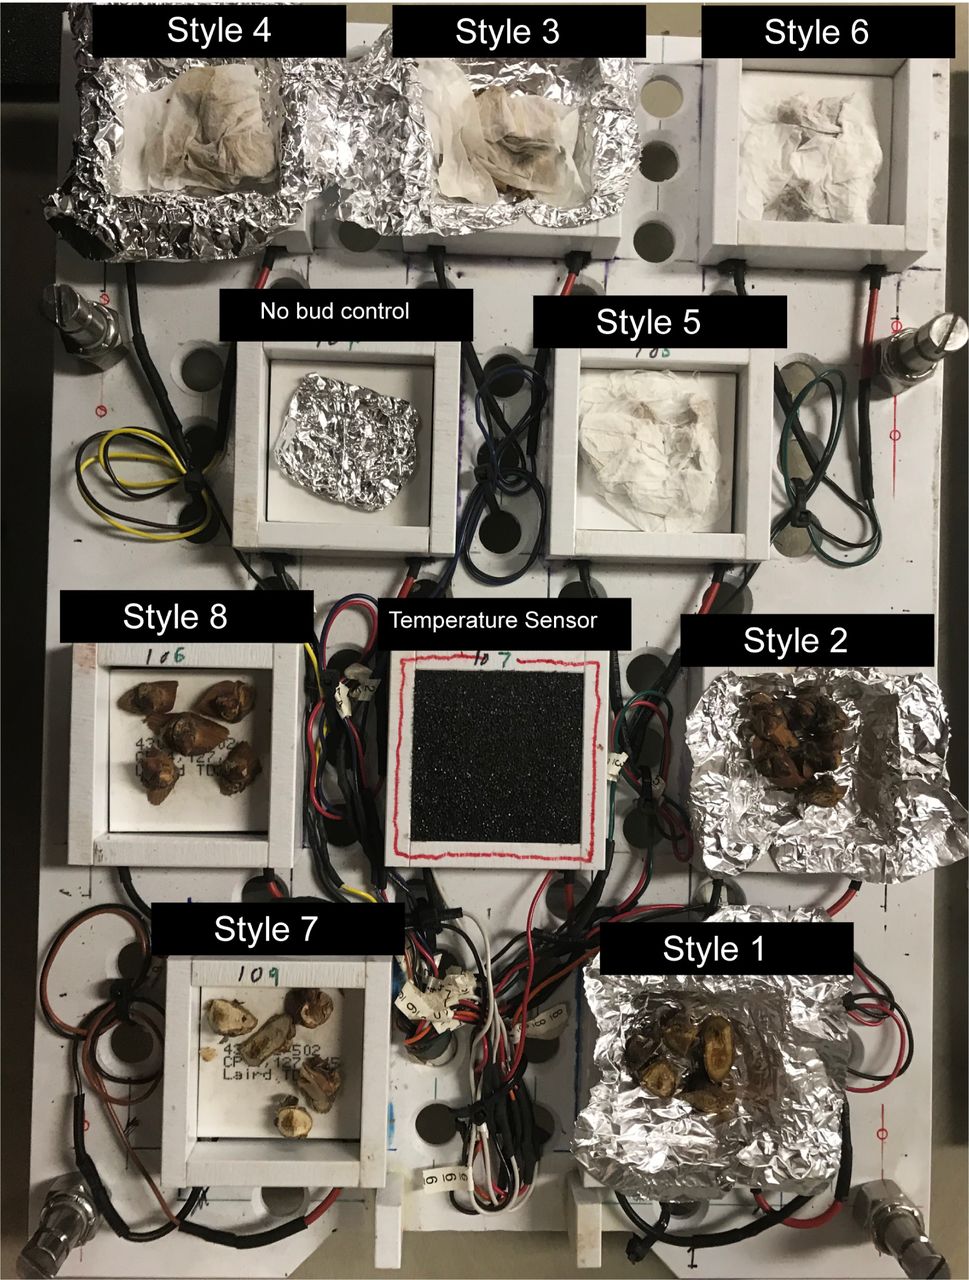
Grapevine bud preparation practices evaluated in this study. Practices were: 1) enclosing the bud in an aluminum foil packet (Foil packet); 2) including a moistened tissue paper with the bud (Moist preparation); and 3) changing the orientation of the bud relative to the thermoelectric module (TEM) plate (Bud orientation; down is touching the TEM plate). All permutations of the three practices were evaluated, for a total of eight different bud preparation styles.
The rationales for and against these various preparation techniques are as follows:
1) Addition of surface moisture: A small piece of paper tissue, moistened with distilled or deionized water, is placed in each sample well. Moistened tissue in the sample wells is thought to reduce the potential for bud dehydration (which presumably would lead to smaller LTEs that are more difficult to detect) and encourage ice nucleation, contributing to lower variation between bud samples (Wolf and Pool 1987). The argument against this method is that moistening may change the water content of the sample and raise the temperature at which an LTE occurs, making the bud appear less cold hardy than it would be in the field (Mills et al. 2006).
2) Enclosing buds in aluminum foil: Buds are placed within foil packets prior to placement in sample wells. Enclosing buds in foil packets is thought to prevent dehydration during the slow freeze ramp, reducing erroneous reduction in temperature of LTEs (indicating samples are more cold hardy) and increasing thermal conduction to the TEM surface (Gale and Moyer 2017). The argument against this method is that foil preparation increases sample preparation time, reducing laboratory throughput, and if preparation occurs at room temperature, then deacclimation may occur and higher LTE values (less cold hardy) will be observed.
3) Bud orientation relative to sensor (TEM) plate: Some laboratories position buds with the cut side of the bud (bud cushion) away from the TEM in the sample well; others place the cut side against the TEM. The idea is that reducing the distance between the sensitive bud primordia and the TEM (i.e., the cut side of the bud facing away) should result in more accurate recording of LTE, as the heat transfer distance is minimized. Placing the cut side down is often coupled with the use of moistened tissue to reduce dehydration from the cut bud cushion surface.
In Experiment 1, we evaluated different combinations of sample preparation (Table 1, Figure 1). The experiments used both Vitis vinifera and Vitis hybrid varieties, collected on multiple dates across the winter season, and across three years (Table 2). Multiple collection dates, representing buds at all stages of winter physiological status, were selected to capture the potential maximum variation observed in grape bud DTA output (Howell 2000, Ferguson et al. 2014, Londo and Kovaleski 2017).

An example layout of an experimental replicate, featuring all eight bud preparation styles as described in Table 1. Preparation styles included the use of foil packets, moistened kimwipes, and the position of the bud relative to the thermoelectric module plate, and all combinations thereof.
Bud preparation methods were evaluated on multiple Vitis varieties over three different winter seasons.
Experiment 2 - Evaluation of time delay (shipping) on sample cold hardiness
We performed several time-delay experiments to test the hypothesis that dormant buds must be processed immediately after field collection to avoid changes in cold hardiness estimates. Four reciprocal time-delay experiments were completed in this study. The first pair was conducted by shipping samples between New York and Wisconsin (Experiments 2.1 and 2.2), and the second pair between New York and Washington (Experiments 2.3 and 2.4) (Table 3). Sample collection and shipment were conducted in both early winter (Experiments 2.1 and 2.3) and late winter (Experiments 2.2 and 2.4), to examine the potential for changing physiological state on shipping impact. On any given sample date at each location, enough cane material (three to six buds in length) was collected to fill three trays (five buds per sample well and nine wells per tray for 45 buds per tray). After collection, 45 buds (one tray) were immediately processed for DTA analysis as described above with either preparation style #1 or #6. The remaining buds were kept on canes until storage treatments were complete. Treatments consisted of: 1) storing cane sections with at least 45 buds for 24 hrs at +4°C (all experiments), +20°C (Experiment 2.2 only), or until notified by the shipment receiving lab; and 2) shipping cane sections with at least 45 buds using an overnight service, packaged in a styrofoam insulated box with an iButton (iButtonLink, LLC) temperature logger, to receiving locations listed in Table 3. In Experiments 2.2 and 2.4, samples originating from New York were shipped using cool packs to maintain shipping temperatures; samples originating from Washington or Wisconsin were not shipped with cool packs. Shipping typically resulted in 24 to 72 hr processing delays. Once shipped samples were received at the end location, the starting location was notified, and both the stored samples and the shipped samples were prepared for DTA analysis at their respective physical locations.
The impacts of delayed processing times, shipping, and on-site storage on observed low-temperature exotherms of grapevine buds was assessed by reciprocal processing of samples.
Experiment 3 - Evaluation of influence of bud position along a cane on cold hardiness
To examine the potential impact of bud position along a cane on measured LTEs, a series of experiments were conducted in New York. Grapevine canes were collected at the dates described below and a single bud was placed in its own sample well within the DTA sample trays. Preparing samples in this manner limits the ability to include replicate cane collections, particularly from long canes. However, it also prevents the potential introduction of variation that might occur if multiple freezing units were used to accommodate a larger experimental sample (i.e., a single freezing unit with four trays of nine wells can only hold 36 buds, which would be approximately two canes of 18 buds each). As a result, LTE values were evaluated from both replicated and nonreplicated cane collections based on the slopes of linear regressions, using bud position as a numerical variable (and therefore, for non-replicated canes, n is the number of bud positions evaluated in a cane – see Statistical Approach section) to determine the overall expected change in LTE as bud position advanced from base (node varied; 1, 2, or 3) to apex (varied length).
Experiment 3.1 examined canes collected from Riesling (18 Oct 2018; 10 Feb 2019), Chardonnay (6 Jan 2020), Merlot (6 Jan 2020), and Marechal Foch (8 Jan 2020; 12 Jan 2020) with the goal of testing whether bud position significantly influences cold hardiness as evaluated from the cane base to apex. For Riesling on 18 Oct 2018, buds from node positions 3 through 20 were sampled on three replicate canes; on 10 Feb 2019, buds from node positions 2 through 19 were sampled on two replicate canes. For Chardonnay and Merlot on 6 Jan 2020, buds from node positions 1 through 9 were sampled from two replicate canes. For Marechal Foch, buds from node positions 1 through 40 were sampled from one cane on 8 Jan 2020, and buds from positions 1 through 35 were collected from one cane on 12 Jan 2020. The high number of nodes prevented testing of multiple canes of Marechal Foch at a single sample date. Thus, Marechal Foch was evaluated at two separate collection dates.
Experiment 3.2 examined 20 total canes of Merlot covering bud positions 1 through 9 collected at a single time point. Initially, four replicate canes were examined on 5 March 2020 and the remaining 16 canes were placed, intact, with cut ends submerged in beakers of water. The beakers were placed in a constant-temperature growth chamber (dark; 20°C) and allowed to deacclimate (i.e., lose cold hardiness) over four subsequent time periods (three, six, eight, and 10 days). Four replicate canes each were franc, Pinot noir, Pinot gris, Sauvignon blanc, Lemberger, and Marechal Foch. Not all sample preparation types were queried in every iteration, but the full design was included in 33 of the 45 iterations. For single factor analysis, wrapping buds in aluminum foil had a statistically significant effect in 11 of the 45 iterations (24%), moisture was significant in 12 of 45 iterations (26%), and bud position was significant in 16 of 43 iterations (36%) (two iterations had unbalanced designs for position and were therefore removed from comparison). Significant interactions between these single factors occurred in 14 of the 45 iterations (31%). When preparation style was assessed as a combination of single factors, significant differences among preparation approaches were detected in 21 of 45 iterations (47%). Despite the observation of statistically significant differences in some iterations, the directionality of the effect was not consistent (i.e., whether the effect resulted in higher or lower observed LTEs). The drift of the mean observed temperature of LTE appeared to removed and assessed for cold hardiness on 8, 11, 13, and 15 March 2020.
Statistical approach
Regression, analysis of variance, and Tukey’s post-hoc honest significant difference (HSD) analyses were conducted in R (R Core Team 2021) using the following packages: tidyverse (Wickham et al. 2019), dplyr (Wickham et al. 2021), plotrix (Lemon 2006), lubridate (Grolemund and Wickham 2011), broom (Kuhn and Wickham 2020), and base R to test the impact of the factors of interest in each of the experiments. Figures were produced using the ggplot2 package (Wickham 2009) and PupillometryR (Forbes 2020). For Experiment 1 and 2, when unbalanced treatment designs occurred, effects were combined and tested as a single factor. For all experiments, individual factors and their two-way and three-way interactions were analyzed when appropriate. For Experiment 1, foil, moisture, bud position, preparation style (pre-combination of the three different factors into a single factor), and variety were examined. In Experiment 2, variety, shipment/storage, and preparation style were examined, though style was restricted to #1 and #6 (contrasting foil versus moisture), reflecting the preferred styles for source and destination labs. In Experiment 3, bud position along the cane was evaluated as a linear regression of LTE and position number. Outliers (>3 studentized residuals) were removed prior to analysis; no iteration had >5 outlier observations. Contrasts between significant factors and interactions were examined using Tukey HSD tests; the cutoff for significance evaluation was α ≤ 0.05.
As LTE values are estimates of cold hardiness, it is ambiguous to assign the “most correct” cold hardiness value for a given freezing test or determine which preparation method is best. We can only assess the experimental approaches that result in the least variable data. Thus, treatment means, standard error, and standard deviations were retained for comparisons of treatment effects and determination of the factor combinations that consistently produced the least amount of error for estimating LTE. When presenting LTE “drifts”, or changes as a result of different treatment approaches, a “+” is used to indicate a higher LTE (less cold hardy), and a “−” is used to denote a lower LTE (more cold hardy).
Results
Experiment 1 - Effect of sample preparation techniques
Tests of 45 sample preparation effects (iterations) were conducted across three years by three lab groups, for which sample preparation combinations were tested for a consistent and significant impact on mean LTE values. The number of buds assessed across these iterations ranged between n = 55 and n = 160, after outlier removal. No iteration resulted in more than five outlier observations. Grape varieties examined included 28 iterations of Chardonnay, nine of Merlot, two of Riesling, and one each of Cabernet be random, in both the warmer (+) and cooler (−) direction (Supplemental Table 1).
As it is not possible to determine which sample preparation approach represents the most accurate mean LTE, we assessed the precision of the various preparation styles by examining the standard error and standard deviation of LTE values produced. Only results for Merlot and Chardonnay are shown in the following figures, due to the predominance of these varieties in our study. Data for all varieties is reported in Supplemental Table 1. Standard error measures ranged from 0.11 to 1.45°C and standard deviation ranged from 0.48 to 5.06°C (Figure 2). Additionally, we compared the relative impact and directionality of preparation styles by using preparation style #1 as the point of comparison. Mean LTE values for each preparation style from each experiment were expressed relative to the mean LTE measured in preparation #1 to determine the direction of LTE “drift” (Figure 2). Most observations of the mean for the different preparation styles were within a 1°C shift from preparation style #1 (207 of 251 preparation styles), except for a few experiments where preparation styles #3 through #6 resulted in warmer (+) LTE values in Chardonnay and cooler (−) LTE values for Merlot (Figures 2 and 3).
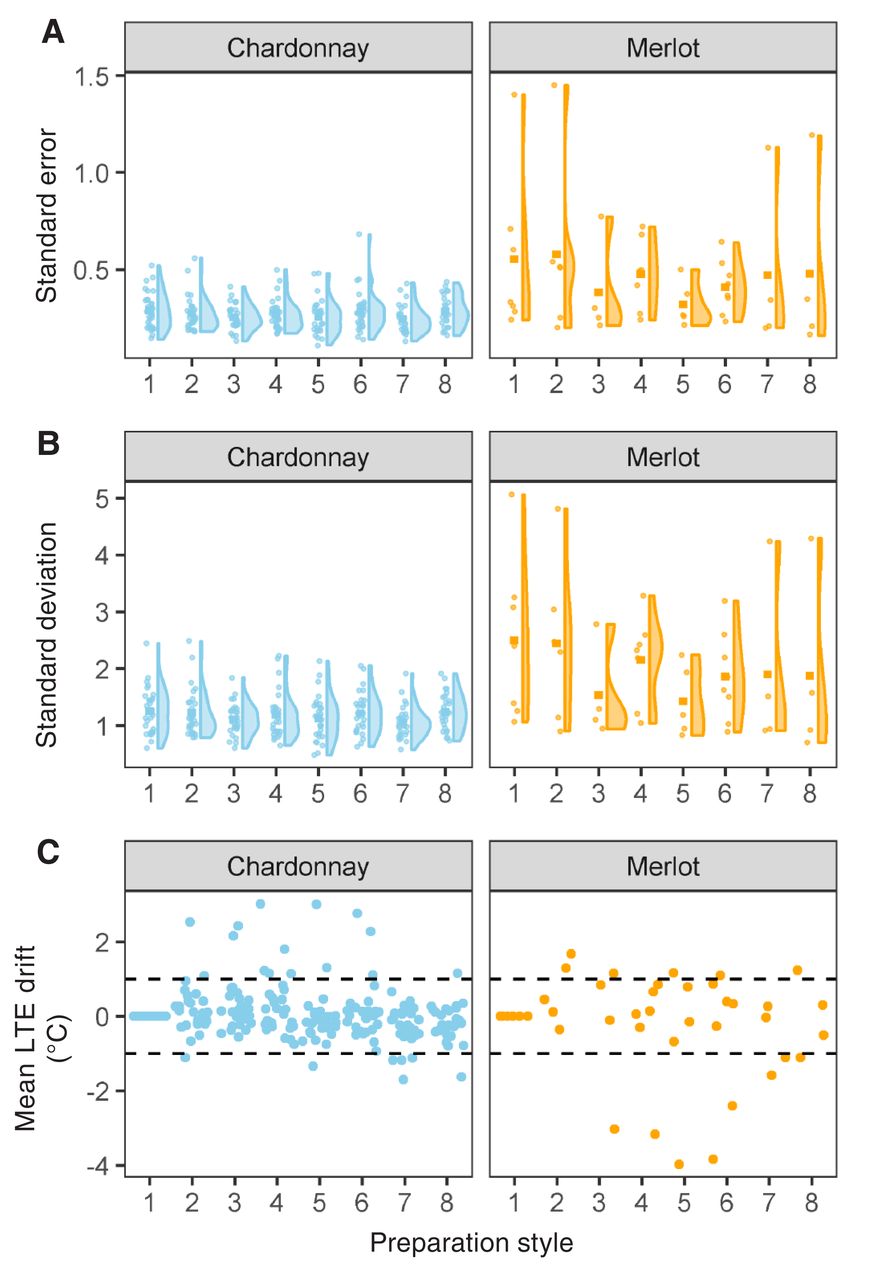
Error distribution and low temperature exotherm (LTE) drift of the eight preparation styles. Each point represents the mean LTE from one iteration of Experiment 1. A) Distribution of standard error and B) standard deviation of LTE for Vitis vinifera Chardonnay (Left; n = 28 iterations) and Merlot (Right; n = 9 iterations). C) LTE drift of preparation styles relative to mean LTE measured in preparation style 1. Dashed lines indicate +1 and −1°C.

Percent of experiments where low temperature exotherm (LTE) drift exceeded 1°C for Chardonnay (top, n = 28 iterations) and Merlot (bottom, n = 9 iterations), based on preparation style (Figure 1, Table 1). Red indicates LTE drift was toward warmer temperatures, blue indicates drift toward cooler temperatures. Gray indicates LTE drift was within 1°C of preparation style 1 mean LTE in either direction.
Experiment 2 - Effect of time-delay (shipping or storage) on sample cold hardiness
Experiment 2.1 examined buds of Riesling, Chardonnay, Frontenac, and Marquette shipped between New York and Wisconsin in December 2018 for effects of shipping/storage and preparation style. Temperature within the shipment boxes averaged 10°C during shipment and varied from a minimum of 4°C to a maximum of 18°C. In Wisconsin, only style #1 was used, while in New York, both #1 and #6 were tested. For Chardonnay buds, there was no significant effect of preparation style (p = 0.50). However, buds that were stored at 4°C for 48 hrs had an LTE drift of +1.5°C (p < 0.001) from those samples that were field-collected and immediately processed. However, buds from those same field collections that were shipped were not significantly different (p = 0.96) and had an LTE drift of only +0.12°C after 48 hrs. For Riesling buds, there was no significant effect of preparation style (p = 0.76), and neither 48 hrs storage at 4°C or shipping resulted in a significant drift in LTE relative to samples that were processed immediately (p = 0.21 and p = 0.59, respectively). For Frontenac buds, preparation style was not significant (p = 0.06), but buds that were shipped and evaluated 24 hrs after field collection had a mean LTE that drifted +1.6°C relative to samples that were processed immediately (p < 0.001); 24 hr storage resulted in LTE that drifted +1.5°C (p = 0.003). For Marquette buds, preparation style was significant, with preparation style #6 drifting −1.0°C compared to buds prepared with style #1 (p = 0.043). Storage of buds for 24 hrs resulted in a +1.5°C LTE drift (p = 0.004) relative to buds processed immediately, while shipped samples were not significantly different (p = 0.08).
Experiment 2.2 examined buds of Chardonnay (NY), Cabernet franc (NY), Frontenac (WI), and Marquette (WI) shipped between New York and Wisconsin in March 2019, where storage temperature (20°C or 4°C for 24 hrs), and shipping with or without cool packs for samples collected in New York were evaluated. Temperatures during shipment in cool pack containers averaged 10.5°C, with minimum temperatures of 7.5°C and maximum temperatures of 16.5°C. Temperatures during shipment of non-cool pack containers averaged 15.5°C, with minimum temperatures of 12°C and max temperatures of 21°C. Sample preparation styles were #1 or #6. For Chardonnay, two outlier values were removed from the analysis and no significant effect of sample preparation was observed (p = 0.35). Significantly greater mean LTE values were observed in shipped materials, whether they were shipped with a cool pack (+1.5°C; p < 0.001) or without a cool pack (+1.7°C; p < 0.001) relative to samples that were processed immediately after field collection. Storage of samples on-site at either 4°C (p = 0.88) or 20°C (p = 0.71) did not affect observed LTE. For Cabernet franc, three outlier values were removed from analysis and there was no significant effect of sample preparation style (p = 0.28). Storage at 20°C for 24 hrs resulted in a significant LTE drift of +1.4°C (p < 0.001) relative to field samples that were processed immediately, while storage at 4°C for 24 hrs did not affect LTE (p = 0.99). Neither the presence or absence of cool packs during shipping nor processing 24 hrs after field collection resulted in significant drift in LTE (p = 0.33 and p = 0.19, respectively). For Frontenac and Marquette samples, sample preparation comparisons only occurred in NY. For Frontenac, sample preparation style #6 resulted in a significantly higher mean LTE than style #1, though only in samples shipped without cool packs (+2.0°C; p = 0.004). When comparing sample preparation #1 only (shared between origin and destination), shipping without cool packs and processing 24 hrs after field collection resulted in significant LTE drift (+1.3°C; p = 0.01), but shipping with cool packs had no effect on LTE (p = 0.71). For Marquette, when comparing shipping effects and sample preparation #1 only (shared between origin and destination), both shipping with or without cool packs and processing 24 hrs after field collection resulted in significant LTE drift relative to field samples, but in opposite directions (−1.6°C; p < 0.01, +2.3°C; p < 0.001, respectively). In New York, sample preparation #6 resulted in significantly warmer LTE values than style #1 for samples shipped on cool packs (+2.3°C; p = 0.006), but not when samples were shipped without cool packs (p = 0.12).
Experiment 2.3 examined buds of Chardonnay and Concord, shipped between New York and Washington in December. Sample preparation styles #1 and #6 were used in both locations. LTE data for field-collected, and immediately processed, material in New York were not available due to a failed freezer run. As a result, comparisons of New York field-collected versus stored/shipped buds could not be conducted. Samples sent to Washington were shipped with cool packs and temperatures averaged 4.6°C, with minimum temperatures of 1°C and maximum temperatures of 10°C. For Chardonnay, a single observation was removed as an outlier, and shipping/storage (p = 0.001) and its interaction with preparation style (p = 0.04) were significant. Preparation style alone did not significantly impact mean LTE after 24 hrs of storage in New York (p = 0.64), nor after 24 hrs of shipping to Washington (p = 0.22). When examining the significant interaction, shipped samples that were prepared using style #6 had a significant LTE shift of −1.5°C (p = 0.002) relative to samples stored in New York. Samples prepared with style #1 trended in the same direction, but were not significant (p = 0.89). For Concord, four observations were removed as outliers. Shipping/storage (p < 0.001), preparation style (p = 0.03), and the interaction term (p = 0.03) were all significant. When examining the interaction, samples stored for 24 hrs at 4°C, showed a significant LTE drift (+2.9ºC; p = 0.03) between preparation styles #6 and #1. For shipped samples, this preparation style difference in LTE drift increased (+3.6°C; p = 0.002). For samples shipped to Washington, preparation style was not significant.
For Chardonnay samples collected in Washington, two outlier observations were removed from the analysis. Shipment/storage was significant (p < 0.001), as was its interaction with preparation style (p = 0.009). When examining this interaction, storage at 4°C for 24 hrs with either preparation style #1 or #6 did not significantly impact mean LTE (p = 0.9 and p = 0.16, respectively). However, the effect of shipping was significant for both, with warmer LTE values recorded for both preparation style #1 (+1.2°C; p = 0.05) and #6 (+2.6°C; p < 0.001). For Concord samples collected in Washington, one outlier observation was removed from the analysis. Single factors for preparation style (p = 0.005), shipment/storage (p < 0.001), and their interaction were significant (p = 0.005). When examining this interaction, samples stored at 4°C for 24 hrs differed significantly from samples processed immediately from the field when sample preparation style #6 was used (−0.68°C; p = 0.047), but not preparation style # 1 (p = 0.5). When examining the effect of shipping and processing 24 hrs later, the inverse response occurred, with preparation style #1 significantly different (+0.92°C; p = 0.009), while preparation style #6 was not (p = 0.67).
Experiment 2.4 examined buds of Chardonnay and Concord, collected and shipped between Washington and New York in February. For samples collected in New York, storage was performed at 4°C for 24 hrs. When New York samples were shipped to Washington, they were shipped using cool packs. Temperatures within the cool pack shipments averaged 4.7°C with minimum temperature of −0.8°C and maximum temperature of 10°C. Shipping of samples collected in Washington underwent significant delays due to inclement weather across the country; all shipped samples, and their on-site stored counterparts, were evaluated five days after their original field collection. To compensate for the longer storage in the experimental design, on-site samples in Washington were held between 1°C to 2°C, rather than 4°C. For New York Chardonnay, one outlier observation was removed, single factors were significant for preparation style (p = 0.004) and shipping/storage (p < 0.001), while their interaction was not (p = 0.33). When examining preparation style and shipping/storage contrasts, only one combination was significant. Comparisons between mean LTE of samples shipped to Washington and processed using preparation style #1 were significantly different and drifted +2.5°C from samples prepped using style #1 and processed immediately after field collection (p < 0.001); comparisons of style preparation #6 after shipping were not significantly different (p = 0.15). Storage for 24 hrs at 4°C did not significantly affect mean LTE measurements in either preparation style #1 (p = 0.47) or #6 (p = 0.22). For New York Concord samples, preparation style and shipping/storage were both significant (p = 0.05 and p < 0.001, respectively), as was their interaction (p = 0.04). Samples that were stored at 4°C for 24 hrs and prepared as style #1 or #6 had an LTE drift of +4.6°C (p < 0.001) and +4.7°C (p < 0.001), respectively, relative to samples that were processed immediately after field collection. Samples that were shipped on cool packs to Washington and processed 24 hrs after initial field collection had a significant LTE drift of +3.0°C (p < 0.001) for preparation style #1, but shipping did not significantly affect mean LTE for preparation style #6 (p = 0.78), compared with samples that were processed after field collection.
For Chardonnay samples collected in Washington, two observations were removed as outliers. The single factor for preparation style and the interaction term were not significant, but shipping/storage (five days after collection) resulted in an LTE drift of +3.5°C (p < 0.001). Those samples that were stored on-site in Washington between 1°C to 2°C for five days, did not see a shift in LTE relative to samples that were processed immediately after field collection (p = 0.80). For Concord samples from Washington, three outlier observations were removed from the analysis. Single factors for preparation style (p < 0.001) and shipping/storage (p < 0.001) were both significant, as was their interaction (p = 0.001). Shipping and processing five days later in New York resulted in an LTE drift of +1.9°C (p = 0.001) for preparation style #6, while shipping and preparation style #1 were not significantly different (p = 0.98). For samples stored between 1°C to 2°C and processed five days later, LTE drift occurred in the opposite direction, with preparation style #1 drifting −1.7°C (p = 0.003) and preparation style #6 drifting −2.6°C (p < 0.001), relative to samples that were processed immediately after field collection.
Experiment 3 - Effect of the impact of bud position along the cane
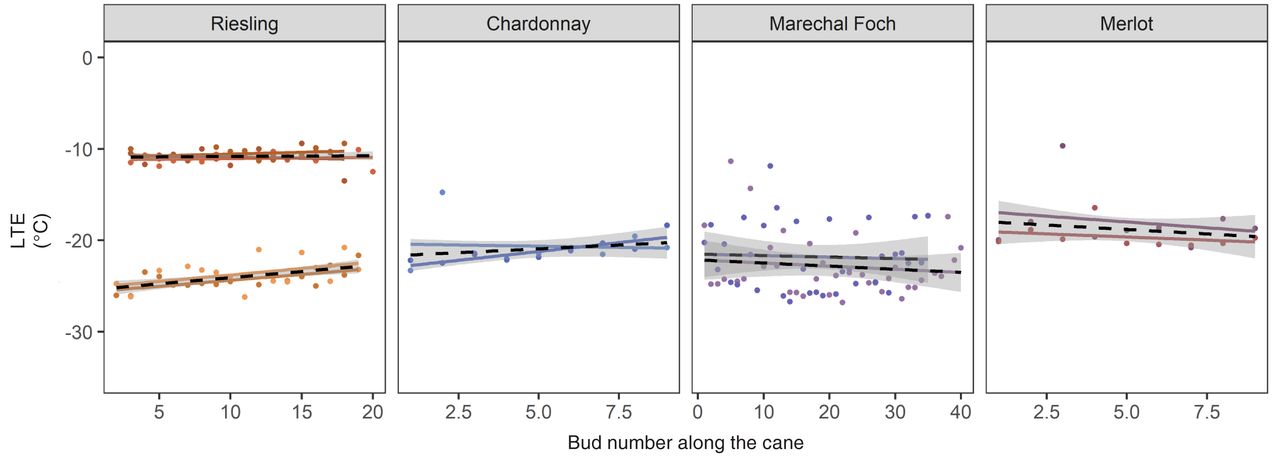
Twenty-nine different canes were examined with DTA to test the impact of bud position along a cane on measured LTE. Experiment 3.1 consisted of 11 of those DTA runs, and evaluated canes collected from the field and processed for cold hardiness on the same day. For three of these runs, the bud position along the cane had a significant effect on observed LTE, shown by a slope significantly different from zero. For Riesling, two canes evaluated from samples collected on 10 Feb 2019 had LTE values changed by +0.13°C and +0.14°C per bud, going from nodes 2 through 19 (p = 0.004 and p = 0.042, respectively). A single cane of Chardonnay collected on 6 Jan 2020 also demonstrated a change in LTE of +0.38°C per bud from node 1 through 9 (p < 0.001). The remaining eight canes, which were Chardonnay, Merlot, Marechal Foch, and Riesling, did not demonstrate a slope significantly different from zero (Figure 4 and Supplemental Table 2).

Change in observed low temperature exotherm (LTE) based on bud position along a cane for Riesling, Chardonnay, Marechal Foch and Merlot from Experiment 3.1. Points indicate LTE peaks, lines indicate the slope of the linear regression of node number and LTE. The black dotted line indicates the average of the canes collected on the same day, with shaded areas to indicate standard error.
Experiment 3.2 examined Merlot buds on nodes 1 through 9 from four replicate canes, initially processed on one date, and then resampled at four additional dates (three, six, eight, and 10 days) after being stored at 20°C. The mean LTE increased with each successive sample date as buds deacclimated while in storage at 20°C. There was no effect of bud position on observed LTE for any canes processed on the field collection date nor after three days of deacclimation (Figure 5 and Supplemental Table 2). One cane was lost for the batch deacclimated for six days and one cane had a significant decreasing slope (−0.89°C/node, p = 0.003), suggesting greater cold hardiness in more apical nodes. No impact of node position was observed in canes deacclimated for eight days. Three of four canes had significant slope deviations in the sample deacclimated for 10 days. Two canes had positive slopes (0.4°C/node, p = 0.04 and 0.54°C/node, p = 0.021), one had a negative slope (−1.8°C/node, p = 0.004), and the remaining cane was not significantly different from zero. However, when the data from each sample date were combined to examine the LTE change from basal to apical node position, none of the slopes were significantly different from zero (Figure 5 and Supplemental Table 2).

Change in observed low temperature exotherms (LTE) based on bud position along a cane for Merlot from Experiment 3.2. Subsequent dates indicate three, six, eight, and 10 days of deacclimation. Points indicate individual LTE peaks detected and lines indicate slope of the linear regression of node number and LTE. The black dotted line indicates the average of the canes collected on the same day, with shaded areas to indicate standard error.
Discussion
This paper explored the variability in observed LTE values of dormant grapevine buds as a result of bud preparation for DTA, time delays prior to DTA evaluation (i.e., shipping or storage), and the bud’s node position along the length of a grapevine cane. We demonstrated that, while statistical differences can sometimes be observed between pre-freeze treatments when using DTA, the actual measured temperature difference between preparation methods is inconsistent in the direction of differences and rarely great enough to be biologically relevant. Shipping and storage of samples appears to have had a greater effect on the potential for LTE drift for V. vinifera varieties when canes are collected late in the winter season, and had an overall greater impact (regardless of timing) on hybrid varieties. Finally, changes in bud LTE from the basal to apical end of sampled canes were not consistently significantly different; seven of 29 cane evaluations found a significant slope difference, five found that basal buds had significantly lower LTE (more cold hardy) than apical buds (slope was positive and significant), and two found that basal buds had significantly higher LTE than apical buds (slope was negative and significant). Overall, the data indicate that estimating grapevine LTE values using DTA methods is robust to variation in sample preparation techniques, allowing those conducting DTA flexibility in protocol design to address limitations they may face in experimental design (e.g., limited equipment, limited access to grapevine material, significant distances between sampling and tissue processing locations).
Evaluation of sample preparation techniques
The unifying message in our evaluation of different sample preparation styles is that ultimately, the key to using DTA for evaluating cold hardiness is to be consistent with the chosen sample preparation style throughout any given experiment. Classical studies examining DTA methods in grapevine described efforts to evaluate buds on intact canes (Quamme 1986) and the use of moistened tissue to assist with ice nucleation during freeze runs (Wolf and Pool 1987). Since these earlier studies, researchers have continued to refine DTA methods to include the use of foil packets to reduce dehydration and increase thermal conductivity of exotherms (Gale and Moyer 2017). While we observed statistically significant effects between individual sample preparation choices in nearly half of the 45 total iterations (Supplemental Table 1), the drift in LTE those factors produced was not consistent in direction (+ or −) or magnitude. Use of foil shifted LTE toward colder values nine times, toward warmer values two times, and had no effect 34 times. Use of a wet Kimwipe shifted LTE toward colder values nine times, toward warmer values three times, and had no effect 33 times. Finally, bud orientation differences within the sample wells shifted LTE toward colder values five times, toward warmer values 11 times, and had no effect 27 times. In a few cases there were differences in mean LTE as large as 3.6°C between preparation styles, but this was rare and inconsistent among varieties, sampling times, or preparation styles. It was far more typical that differences between preparation styles resulted in less than 1°C difference in mean LTE when compared with our defined “standard” preparation style (style #1; Figure 2). Ultimately, this suggests that variations in preparation styles, in the form of moistened tissue paper, foil packets, bud orientation, and their combinations, should not impact the quality of observed LTE of dormant grapevine buds; thus, programs should adopt the preparation style that best suits the needs and time constraints of their experiments. Our results also suggest that conditions during the typical time of sample preparation (<45 min), such as the maintenance of room temperature for employee comfort, are highly unlikely to have a significant or meaningful impact on observed LTE.
Evaluation of time-delay (shipping) effect on cold hardiness
Location of vineyards relative to cold hardiness processing sites is often a major limitation on a program’s ability to evaluate different varieties or provide a data set for growers in different regions. Programs overcome this by devising elaborate packaging to maintain field temperatures when transporting samples (Kose and Kaya 2020), and it has severely limited the development of centralized processing facilities due to the fear that time in transport would alter the observed LTE. While we did find instances of delayed processing resulting in LTE drift, these were not consistent, except conditions of storage and shipping that were not cooled tended to result in LTE drift toward less cold hardiness. Overall, storing samples at 4°C or less, or shipping them on cool packs, along with processing samples within 24 hrs of field collection, resulted in the least amount of LTE drift, when it did occur. Most observed drifts were <2°C, except for the event where sample shipments were delayed five days by inclement weather. Differences in shipping temperature were apparent when comparing packages without cool packs, versus those with cool packs. Cooled shipments tended to remain below 10°C while ambient did not. It may be argued that shipping at any temperatures above freezing could promote deacclimation in the buds, leading to a significant drift in LTE. However, actual deacclimation as a result of shipping at ambient temperatures is unlikely, as the temperature and duration required to trigger deacclimation (Kovaleski et al. 2018) exceeds those of the shipping times and temperatures seen here. Fundamentally, assessing storage conditions on the impact of LTE drift is straightforward, but assessing whether shipping has an effect is less so. An important caveat of the shipping/storing results presented here is that we cannot fully separate the effects of shipping from the effects of the different labs, DTA machines, and data collection personnel, because samples were processed at different locations. The most appropriate contrast would be for each lab to ship themselves a package overnight, a test we did not envision when establishing this study. As with sample processing method, it is likely more important to be consistent in sample storage and timeliness of processing, rather than to adhere strictly to extreme efforts in keeping samples chilled and reducing their time-to-processing, provided some minimal efforts are made, such as storage at 4°C or less (typical cooler) and processing within 24 hrs. But the potential ability to ship samples for DTA processing, using techniques such as overnight shipping and cool packs, should not be overlooked. The ability for research and extension groups to ship samples for cold hardiness evaluation could result in the development of regional lab hubs, where other between-lab sources of variation are reduced. It is our opinion that the benefits associated with shipping samples to regional hubs and broadening cold hardiness monitoring across a wider stakeholder base outweighs the potential for some LTE drift to occur in shipped samples.
Evaluation of the impact of bud position along the cane
Cane ripening and periderm formation are critical to cold hardiness acclimation of grapevine buds (Zabadal et al. 2007). This process occurs acropetally from the base of canes toward the apex. As a result, cold hardiness assessments made in late fall and early winter, before this process is complete, may find differences associated with their location along the cane. For example, there were differences in LTE when cold hardiness was assessed in “basal”, “middle”, and “apical” buds from August through October (Wolpert and Howell 1984). These position-based differences in cold hardiness disappeared as the winter season progressed and the buds continued to acclimate. While not specifically isolating individual nodes, Wolpert and Howell (1984) noticed more end-of-winter bud damage at buds near the cane apex than in nodes 1 through 8; the authors assumed that the bud damage was related to cold temperature events during the winter. These trends are in agreement with the results presented here. We saw a similar trend of minor increases in observed LTE from the cane base toward the apex, but within the typical range of node positions that would be retained during pruning, there was little to no change in observed bud LTE. This was particularly true of buds located in the region of the cane typically retained during spur or cane pruning (nodes 1 through 10). Similarly, a comparison of cold hardiness among grapevine buds in cane positions 1 through 6 found that with each experimental run, only one or two buds would differ from the others in LTE, and the position of those buds that differed varied over the sampling season (Buztepe et al. 2017). Our results were similar, with some buds divergent from the slope of the regression line, but not consistent in their position relative to other nodes. This confirmation of lack of significant differences in bud LTE along the commercially-relevant sections of a grapevine cane, during the times of year when cold hardiness evaluations are most common, should allow those who work with grapevine DTA more flexibility in selecting buds for analysis. This is of particular interest in situations where sample size is limited, such as in germplasm evaluation or assessments of newly-bred varieties.
Conclusion
This study provides a few key take-home messages for researchers concerned about measuring cold hardiness in grapevines: 1) no one preparation style was consistently better than others at estimating cold hardiness, but sticking with a preparation style for the duration of a study is better than mixing; 2) if held at low temperatures (<4°C), samples can be shipped or stored for 24 hrs without appreciably affecting estimates of LTE; and 3) though it is advised to avoid apex bud tissue and lateral canes, bud position does not have an appreciable effect on LTE when using standard cane collection techniques.
Supplemental Data
The following supplemental materials are available for this article in the Supplemental tab above:
Supplemental Table 1 Impacts of sample preparation approaches on observed low temperature exotherms (LTE) of grapevine (Vitis sp.) buds using differential thermal analysis (DTA). Sample preparation was analyzed for individual and interactive effects (individual factor effects; interactions). Preparation, as a combined approach, was also evaluated (full preparation combinations). The default comparison treatment for single factors are foil (versus no), wet (versus dry), and bud orientation thermoelectric module (versus away). Values reported are observed drift in LTE in degrees Celsius (positive indicates higher LTE, negative indicates lower LTE). When indicated under the interaction effect: F, foil; M, moisture; and O, bud orientation. Location 1, New York; Location 2, Washington #1; Location 3, Washington #2. *, **, and *** indicate a significant effect at α ≤ 0.05, 0.01, and 0.001, respectively. n indicates the number of buds/peaks included after outlier removal.
Supplemental Table 2 Impact of bud position along the cane on low temperature exotherm (LTE) values for Experiments 3.1 and 3.2, calculated by each individual cane and averaged when multiple canes were surveyed on the same date. Slope indicates direction of LTE change and p value indicates if the slope is significantly different from zero.
Footnotes
Financial support provided by the Washington State Grape and Wine Research Program, where funding sources include Washington State Wine Commission, Auction of Washington Wines, State Liter tax, and/or WSU Agriculture Research Center, and USDA National Institute of Food and Agriculture Hatch project 1016563. This work was partially supported by U.S. Department of Agriculture appropriated project 1910-21220-006-00D. We would like to acknowledge the collection and preparation support provided by Hanna Martens and Lex Pike.
By downloading and/or receiving this article, you agree to the Disclaimer of Warranties and Liability. If you do not agree to the Disclaimers, do not download and/or accept this article.
- Received February 2022.
- Accepted July 2022.
- Published online January 2023
This is an open access article distributed under the CC BY 4.0 license.
References
Vol 74 Issue 1


Jump to section
Related Articles
Cited By...
More from this TOC section
Similar Articles
