


Abstract
Background and goals Grapevine red blotch disease (GRBD) is caused by grapevine red blotch virus (GRBV). GRBD diagnosis is often challenging because of the nature of symptoms in grapevines and complexity of testing methods. In 2020 and 2021, we compared the accuracy of four GRBV detection methods using samples collected from a commercial vineyard in southern Oregon.
Methods and key findings Tissue samples were collected at fruit set, veraison, harvest, and dormancy from basal, middle, and apical shoot nodes of 20 GRBV-positive and negative vines. GRBD symptoms on grapevines were recorded at the time of collection, and leaf samples were tested for GRBV using loop-mediated isothermal amplification (LAMP), endpoint PCR, and quantitative PCR (qPCR). The detectability of GRBV-positive vines by the assays differed significantly among node positions, depending on phenology. At fruit set and veraison, the sensitivity of qPCR and endpoint PCR assays was 98%, whereas the sensitivity of LAMP was 49% and 78%, respectively, from basal leaf samples. At harvest and dormancy, the sensitivity of all assays was 100% in basal and middle samples, and no significant differences were detectable between LAMP, endpoint PCR, and qPCR. None of the GRBV-positive grapevine samples expressed symptoms at fruit set, and 31% of the basal canopy samples expressed symptoms at veraison. At harvest, 90% of these vines expressed symptoms, which was not significantly different than other methods. Similarly, at fruit set, the specificity of LAMP was less than 75%, whereas at veraison and harvest, it increased to 100% for all DNA-based detection methods.
Conclusions and significance The results of this study show that PCR-based assays are the most accurate option if early diagnosis is needed; less expensive methods such as LAMP and basal canopy symptoms are reliable at later phenological stages. These findings contribute to the better understanding of GRBV detection and benefit other researchers, winegrape, and nursery industries.
Introduction
The symptoms of grapevine red blotch disease (GRBD) were first described in 2008 (Calvi 2011). These symptoms were later associated with a putatively phloem-limited DNA Geminivirus (Krenz et al. 2012, Al Rwahnih et al. 2013, Sudarshana et al. 2015) and grapevine red blotch virus (GRBV) was identified as the causative agent of GRBD in 2018 (Yepes et al. 2018). Additional countries have reported GRBV infection, including Argentina (Luna et al. 2019), Italy (Bertazzon et al. 2021), India (Marwal et al. 2019), South Korea (Lim et al. 2016), Mexico (Gasperin-Bulbarela et al. 2018), and Canada (Poojari et al. 2017). GRBD has negative implications on winemaking, as the disease has been associated with lower berry sugar content and reduction of anthocyanins in red winegrape varieties (Blanco-Ulate et al. 2017). The economic impact of GRBD has been reported to range from $2213/ha in eastern Washington (USA) to $68,548/ha in Napa County (California, USA) (Ricketts et al. 2017). Initial studies indicated that a flying insect vector was likely responsible for secondary spread within vineyards (Poojari et al. 2017, Cieniewicz et al. 2017, 2018, 2019, Dalton et al. 2019), and the three-cornered alfalfa hopper, Spissistilus festinus, has been confirmed as a vector of GRBV (Bahder et al. 2016, Flasco et al. 2021), therefore early detection is critical to keep disease incidence and transmission potential low.
GRBV-infected grapevines express differential symptoms based on cultivars. On red wine grape cultivars, symptoms include irregularly shaped, interveinal red blotches that develop following veraison. As the symptoms progress, the red blotches coalesce and often appear as red stripes between veins (Sudarshana et al. 2015, KC et al. 2022). On some white wine grape cultivars, symptoms include initial interveinal chlorosis followed by necrosis as the season progresses (Sudarshana et al. 2015). Although symptom-based diagnosis of GRBD can be used, several stress related factors may impede accurate visual diagnosis (KC et al. 2022). We recently reported that the sensitivity (true GRBV-positive ratio) of symptom-based diagnosis ranged from 33.33% to 100%, whereas the specificity (true GRBV-negative ratio) ranged from 98% to 100%, and that roguing of infected vines based on symptoms limited the annual progression of disease incidence to lower than 5% in the vineyards (KC et al. 2022).
Currently published methods for detecting GRBV include single- and multiplex, endpoint PCR (Al Rwahnih et al. 2013, Krenz et al. 2014), SYBR-based quantitative PCR (qPCR) (Setiono et al. 2018), loop-mediated isothermal amplification (LAMP) (Romero Romero et al. 2019), plasmonic CRISPR Cas12a (Li et al. 2019), recombinase polymerase amplification (RPA) (Li et al. 2017), and hyperspectral imaging (Mehrubeoglu et al. 2016). Because of the expensive nature of routine testing in the vineyard, detection methods such as LAMP are valuable because of its simple reaction conditions compared to PCR and its lack of enzyme sensitivities to inhibitors, allowing for simpler and faster DNA extractions (e.g., “pinprick” DNA extraction) (Romero Romero et al. 2019). Furthermore, LAMP has been reported as 10,000 times more sensitive for detecting GRBV than conventional PCR, making this an ideal method for testing GRBV in earlier stages of vine development, when low virus titer often results in false negatives (Setiono et al. 2018, Romero Romero et al. 2019).
Given the rapid vegetative growth and canopy management of grapevines, determining the tissue sampling location and timing of sample collection is a challenge for GRBV testing. One could assume older vegetative growth is more likely to manifest GRBV sooner because of the appearance of earlier symptoms (Sudarshana et al. 2015), and previous work has shown that the base of the canopy is most reliable for GRBV detection (Setiono et al. 2018). However, the symptoms on GRBV-infected vines do not appear until veraison, even in the older leaves at the base of the canopy (Levin and KC 2020). In areas where GRBV progression is higher, GRBV detection earlier in the season is crucial to make an informed decision on vine removal to minimize disease spread by a potential flying insect vector (Poojari et al. 2017, Cieniewicz et al. 2017, 2018, 2019, Dalton et al. 2019).
Petiole tissues of fully expanded leaves have been routinely used for GRBV testing during the growing season; other tissue types such as dormant canes during the dormant season have been reported to produce consistent results on GRBV testing (Setiono et al. 2018, Romero Romero et al. 2019). However, it is not known how detection of GRBV from dormant tissue compares to actively growing tissue across various detection and DNA extraction methods. In addition, given the higher GRBV titer and consistent results from dormant canes testing, it would be worthwhile to compare the testing results and use less expensive LAMP methods on these tissue types.
Although it would be useful to be able to sample and test for GRBV at any time of the year to make removal decisions, it is unclear what detection methods should be used, and when during the season, without compromising test results. In this study, our objectives were to compare four available GRBV detection methods across four grape vine developmental stages—fruit set, veraison, harvest, and dormancy— and across three canopy locations—basal, middle, and apical shoot nodes. Furthermore, we wanted to understand an association between methods producing binary results such as endpoint PCR, LAMP, and visual symptoms and the relative virus titer using qPCR, across four developmental stages.
Materials and Methods
Vineyard site
This experiment was conducted in a commercial Pinot noir (Vitis vinifera) vineyard block (3.9 ha), during 2019, 2020, and 2021 near Medford, Oregon (42°19´N; 122°52´W). The surveyed block of Pinot noir (clone 777) was planted in 2010 as grafts on the rootstock 3309C, with the row spacing of 2.0 m, and the plant spacing of 1.5 m. The vineyard block was spur pruned and conventionally managed following standard commercial practices for the region. The block was selected based on its history of GRBD. In 2019, ~200 vines were tested for GRBV infection using petiole samples (Buchs et al. 2018) collected at harvest (Setiono et al. 2018) and tested by multiplex, endpoint PCR as described below.
Tissue sampling
Based on results obtained after petiole tests in 2019 done on ~10% of the research block, 20 healthy, non-GRBV-infected and 20 naturally GRBV-infected vines were arbitrarily selected. Individual vine canopies were divided into three sections: basal, middle, and apical. The basal leaf sample of each individual vine was the oldest leaf in the selected shoot, the apical sample was the newest leaf at tip of the shoot, and the middle sample was at the midpoint between the base and top of the shoot. For each sampling period at fruit set (late June), veraison (early August), and harvest (mid-September), leaf samples were collected from the base, middle, and top of the canopy in 2020 and 2021. The sampling unit for leaves consisted of two leaf blades with petioles, collected from each side of the vine. The shoots from where leaf samples were collected were labeled, and tissue samples were collected from the same four shoots (canes) of each tested vine during winter dormancy (early January). The sampling unit for dormant canes consisted of 15.24 cm pieces of dormant canes sampled within the same area for leaf sampling, two of which were collected from each bilateral cordon and from the base, middle, and top of the canopy. Basal, middle, and apical canopy samples were taken at ~5 to 25 cm, 35 to 55 cm, and 65 to 85 cm above the cordon, respectively, for both leaf and dormant cane samples.
Disease symptom observations
Observations for GRBD symptoms were made at three phenological stages—fruit set, veraison, and harvest—and were made at the same time as sample collection. Symptom observations were recorded for basal, middle, and apical sections of the canopy at 5 to 30 cm, 30 to 60 cm, and 60 to 90 cm above the cordon, respectively. Vines were given a binomial rating of either GRBD-positive or GRBD-negative, based on the presence of GRBD symptoms. The GRBD symptom criteria consisted of interveinal red blotching on leaf blades (Sudarshana et al. 2015, KC et al. 2022).
DNA extraction
For DNA extractions used with LAMP reactions, the pinprick method was used according to Romero Romero et al. (2019). Stacks of four leaves were pricked six times per blade and three times per petiole for each vine within 24 hrs after sample collection using 200 μL pipette tips. DNA elution was achieved after pipette tips were placed in 10 μL of molecular-grade water for 10 min. For acidic DNA samples that created a false-positive result (color change from pink to yellow) before incubating the colorimetric reaction mixture, samples were diluted 1:10 using molecular grade water. For DNA extractions used for endpoint PCR and qPCR reactions, petioles were cut into ~1-mm slices, of which 100 mg was transferred to a microcentrifuge tube and frozen to −80°C until extraction. DNA used for endpoint PCR and qPCR was extracted using a modified cetyltrimethyl ammonium bromide (CTAB) DNA extraction protocol (Richards et al. 1994).
For dormant cane samples, a razor blade was used to remove the periderm to access the vascular cambium tissue. For each of the four cane samples collected per vine, the vascular cambium tissue was pricked three times and DNA was eluted by placing pipette tips in 10 μL of molecular-grade water for 10 min. For the DNA extractions used for endpoint PCR and qPCR detection, the same vascular cambium was peeled and diced into ~1-mm3 pieces, of which 100 mg was transferred to a microcentrifuge tube and frozen to −80°C until extraction. DNA used for endpoint PCR and qPCR was extracted using a modified CTAB DNA extraction protocol similar to that used for the petiole tissue samples (Richards et al. 1994).
Endpoint PCR, qPCR, and LAMP
The diagnostic primers used in endpoint PCR amplification (Table 1) were CPfor/CPrev for the GRBV coat protein (CP) gene fragment, Repfor/Reprev for the GRBV replication-associated gene fragment (Rep), and 16Sfor/16Srev as a grapevine internal control for the 16S ribosomal RNA (rRNA) gene fragment (Krenz et al. 2014). The qPCR was performed in 20-μL reaction volumes using SsoAdvanced Universal SYBR Green Supermix (Bio-Rad), CPfor/CPrev for GRBV detection, 16sfor/16srev as an internal control, and 1 μL of DNA template. DNA from a grapevine confirmed GRBV-positive and a nontemplate (nuclease-free water) control were used as positive and negative controls, respectively. LAMP reactions were conducted at 65°C for 35 min and consisted of 20-μL volumes using Colorimetric LAMP 2X Master Mix (New England Biolabs), a primer mixture consisting of 0.2 μM for outer, 1.6 μM for inner, and 0.4 μM for loop primers (Table 1), and 0.5 μL of DNA template from pinprick DNA extracts (Romero Romero et al. 2019).
List of primers used in this study. qPCR, quantitative PCR; LAMP, loop-mediated isothermal amplification.
Results from endpoint PCR and LAMP assays were given a binomial rating of either GRBV-positive or GRBV-negative. Endpoint PCR products were run through 1% agarose gels precasted with 1x GelRed (Biotium). Samples were confirmed GRBV-positive if band sizes of 257 and 318 bp were observed for CP and Rep fragments, respectively. GRBV-positive results for LAMP were contingent on the presence of a color change from pink to yellow in the colorimetric LAMP reaction mix containing phenol red pH indicator (New England Biolabs). All qPCR reactions were performed with a 32.0 cycle threshold (Ct) cutoff value, which was determined by subtracting 2.0 cycles from the average Ct value of nontemplate controls. GRBV-positive results for qPCR were therefore contingent on a Ct value of 32 or less. The qPCR results were validated by crosschecking melt curve analysis peaks between sample and positive control.
Statistical analysis
Sensitivity of each assay was calculated as ratios of positive tests in 2020 and 2021 to the total number of GRBV-positive vines (n = 20) identified in 2019 and expressed as percentage. Similarly, specificity was calculated as ratios of negative tests in 2020 and 2021 to the total number of GRBV-negative vines in the current year and expressed as a percentage. Statistical analyses were performed using R (v. 4.0.4, R Core Team 2021) and RStudio (v. 1.4.1106, R Core Team 2021). Means were calculated using the emmeans package (v. 1.5.5-1; Lenth 2021) with Kenward-Roger degrees of freedom approximation. All figures were created using the ggplot2 package (v.3.3.3; Wickham 2016).
The p value cutoffs were set to 0.0001, 0.001, 0.01, and 0.05. Two-way analysis of variance (ANOVA) was used to evaluate the effect of canopy level and sample timing, as well as the interaction between both. Mean contrasts and letter groupings were performed using emmeans and the Sidak test. Pairwise comparisons were performed between pairs of consecutive phenological time points for both 2020 and 2021 for each canopy position. The relative titer of GRBV was estimated using the ratio of qPCR Ct values of the internal control gene, a fragment of the grapevine 16S rRNA gene, and a fragment of the GRBV CP gene (16S:CP Ct ratio). The 16s rRNA gene was used in this ratio to account for variations in total DNA extracted across samples (Krenz et al. 2014).
To understand an association between relative quantity of GRBV and sensitivity of LAMP, PCR, and symptoms, Point-biserial correlation analysis was performed on GRBV-positive vines using PROC CORR in SAS 9.4. Point-biserial correlation analysis measures the strength of association between the dichotomous nominal variable and an interval (ratio) variable, the value of which ranges from 0 to +1 if the two variables are positively associated, and 0 to −1 if the variables are negatively associated. The point-biserial correlation coefficient (rpb) values indicate the strength of association, similar to the Pearson correlation coefficient (Demirtas and Hedeker 2016). In the analysis, the binomial GRBV status (GRBV-positive and GRBV-negative) as detected by LAMP, endpoint PCR, and symptoms, was used as the dichotomous nominal variable, and the 16S:CP Ct ratio obtained from qPCR was used as another variable.
Results
Sensitivity of the assays
The sensitivities of LAMP, endpoint PCR, and qPCR on GRBV detection differed significantly at fruit set and all canopy locations within a vine. At fruit set, 98% of GRBV-positive grapevines tested positive when basal leaf samples were tested by endpoint PCR and qPCR in 2020 and 2021. From the basal leaf samples, LAMP could detect GRBV in 49% of the same GRBV-infected vines (Figure 1A). From middle leaf samples, 83 and 75% of the positive vine samples tested positive by qPCR and endpoint PCR, respectively, whereas only 11% of the samples tested positive by LAMP. From apical leaf samples, 42 and 22% of the samples tested positive by qPCR and endpoint PCR, respectively, whereas none of the apical leaf samples tested positive by LAMP at fruit set. None of the positive vines exhibited GRBD symptoms at fruit set (Figure 1A).
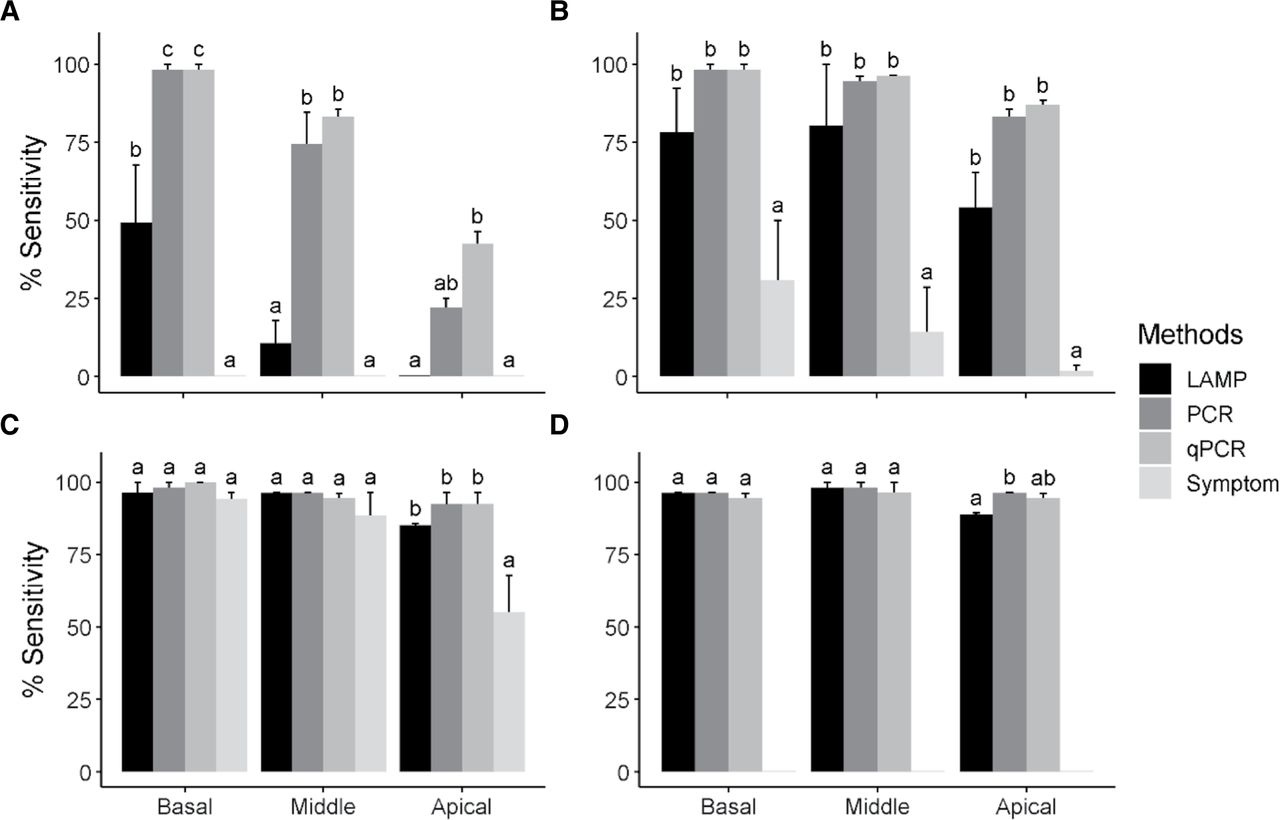
Sensitivity (true positive ratio) analysis of loop-mediated isothermal amplification (LAMP), PCR, quantitative PCR (qPCR), and symptom-based diagnosis. The four methods were used to test the grapevine red blotch virus (GRBV) diagnosis during four phenological stages: A) fruit set, B) veraison, C) harvest, and D) dormancy. Four leaves or dormant cane samples were pooled from each GRBV-positive vine (n = 20) at three canopy positions (basal, middle, and apical) at each phenological stage for GRBV testing. Data presented are means across 2020 and 2021. Error bars represent standard error. Means followed by a common letter are not significantly different according to the Sidak test (p < 0.05).
At veraison, 98% of the GRBV-positive grapevines tested positive when basal leaf samples were tested by endpoint PCR and qPCR, but only 78% tested positive by LAMP. From middle leaf samples, 96 and 95% of the positive samples tested positive by qPCR and endpoint PCR, respectively, but only 80% of samples tested positive with LAMP. Similarly, from apical leaf samples, 87, 83, and 54% of the positive samples tested positive by qPCR, endpoint PCR, and LAMP, respectively. Only 31% of GRBV-positive grapevines expressed symptoms on the basal leaves during veraison (Figure 1B).
At harvest, 96% of the basal leaf samples from positive vines tested positive using LAMP, whereas 100 and 98% tested positive using qPCR and endpoint PCR, respectively. Similarly, 95 and 96% of the middle leaf samples tested positive by qPCR and endpoint PCR, respectively, and 96% by LAMP. However, these differences were not statistically significant for basal or middle leaf samples (p = 0.973 and 0.997, respectively). Detectability from apical leaf samples increased at harvest where 92, 92, and 85% of the samples tested positive by qPCR, endpoint PCR, and LAMP, respectively. At this stage, 94, 89, and 55% of the basal, middle, and apical leaf samples were symptomatic, respectively (Figure 1C).
At dormancy, 96% of the basal dormant canes tested positive using endpoint PCR and LAMP, and 95% tested positive using qPCR. Similarly, 98% of the middle dormant canes tested positive using endpoint PCR and LAMP, and 96% tested positive using qPCR. However, these differences were not statistically significant for basal or middle leaf samples (p = 0.735). At this stage, 95 and 96% of the apical dormant cane tissue tested positive by endpoint PCR and qPCR, respectively, whereas 89% of the apical cane tissue tested positive by LAMP (Figure 1D).
Specificity of the assays
Only 14 out of 20 grapevines (70%) that tested as GRBV-negative in 2019 tested GRBV-negative in 2020, indicating a 30% increase in GRBV detection in the first year (Table 2). Among the newly detected infections, all vines were consistently positive from fruit set stages as detected by both endpoint PCR and qPCR tests. LAMP detected these vines as GRBV-positive only at veraison, harvest, and dormant stages. Out of six of these newly detected infections, one and five were symptomatic at veraison and harvest, respectively. The total number of negative vines for the calculation of assays’ specificity were adjusted accordingly, where specificity of each assay was calculated as ratios of negative tests in 2020 to the total number of GRBV-negative vines (n = 14) and expressed as a percentage.
Progression of grapevine red blotch virus (GRBV) infection status in 2019, 2020, and 2021.
In year two of the study, only 12 out of the 20 grapevines (60%) that tested as GRBV-negative in 2019 tested GRBV-negative, indicating a 40% increase in GRBV detection from 2019 to 2021, and an 8% increase from 2020 to 2021 (Table 2). Of the two newly detected infections in 2021, one vine consistently tested positive at all four phenological stages, while the other vine tested GRBV-positive only at harvest from a basal leaf sample. The total number of negative vines for the calculation of assays’ specificity were adjusted accordingly, where specificity of each assay was calculated as ratios of negative tests in 2021 to the total number of GRBV-negative vines (n = 12) and expressed as a percentage.
Even though GRBV detection between LAMP and other methods was notably different during fruit set, the differences were not statistically significant among the methods from basal, middle, or apical samples (p = 0.050) (Figure 2A). The false positive detection by LAMP at fruit set was ~30% throughout canopy locations. At veraison and harvest, the assays were highly specific at all canopy locations (Figure 2B and 2C). The vines that tested positive by LAMP at fruit set were tested negative by LAMP and other assays at veraison, harvest, and dormancy. All the GRBV-negative leaf samples collected from all canopy locations were symptomless at fruit set, veraison, and harvest (Figure 2A to 2C). Variability in the specificity of LAMP, endpoint PCR, and qPCR assays were observed during dormant tissue sampling. LAMP specificity was highest at dormant cane samples compared to endpoint PCR and qPCR; however, these differences were not statistically significant (p = 0.466) (Figure 2D).

Specificity (true negative ratio) analysis of loop-mediated isothermal amplification (LAMP), PCR, quantitative PCR (qPCR), and symptom-based diagnosis. The four methods were used to test the grapevine red blotch virus (GRBV) diagnosis during four phenological stages: A) fruit set, B) veraison, C) harvest, and D) dormancy. Four leaves or dormant cane samples were pooled from each GRBV-negative (n = 14 for 2020 and n = 12 for 2021) vine at three canopy positions (basal, middle, and apical) at each phenological stage for GRBV testing. Data presented are means across 2020 and 2021. Error bars represent standard error. Means followed by a common letter are not significantly different according to the Sidak test (p < 0.05).
Association between relative quantity of GRBV and sensitivity of the assays
In general, a positive association was observed between relative virus concentration and sensitivity of LAMP and endpoint PCR assays among grapevines with confirmed GRBV infections (Figure 3), however, the association was not strong. For the LAMP assay, the highest association (rpb = 0.54) was observed at fruit set and the lowest (rpb = 0.24), at harvest. Similarly, for the endpoint PCR assay, the highest association (rpb = 0.49) was observed at fruit set and the lowest (rpb = 0.12), at dormant stage. No association between the relative virus concentration and symptom expression was observed at fruit set or veraison (rpb = −0.02). However, a weak positive association was observed at harvest (rpb = 0.42) (Figure 3).

Relative virus concentration and their detectability at A) fruit set, B) veraison, C) harvest, and D) dormancy. The ratio of primers 16S and CP cycle threshold values (16S:CP CT ratio) obtained from quantitative PCR for grapevine red blotch virus (GRBV)-positive vines were plotted against the binomial virus status as diagnosed by conventional PCR, loop-mediated isothermal amplification (LAMP), and symptoms. At fruit set, no symptoms were observed, and at dormancy, foliar tissues were not present to record symptoms. The point-biserial correlation coefficient (rpb) values indicate the strength of association between the GRBV status (GRBV-positive and GRBV-negative) and relative GRBV concentration expressed as 16S:CP Ct ratio. ***, **, and * indicate probabilities at p < 0.0001, 0.01, and 0.05, respectively.
GRBV progression within a season
Among grapevines with infections confirmed in 2019, the relative concentration of GRBV expressed as a ratio of 16S and CP quantification cycle thresholds (Ct) fluctuated as the season progressed (Figure 4). At fruit set, the relative concentration of GRBV was significantly higher in basal leaf samples compared to middle and apical leaf samples, and likewise with middle leaf samples compared to apical leaf samples. The relative GRBV concentration increased significantly at all canopy levels at veraison. Interestingly, in 2020, the relative GRBV concentration in middle leaf samples surpassed relative concentrations in basal and apical leaf samples. On average, leaf tissue samples collected at veraison had the highest relative GRBV concentration, and it decreased slightly across all canopy levels approaching harvest and dormancy (Figure 4). In addition, the variability on GRBV concentration within samples and among the canopy levels decreased at harvest and dormant stages, with the smallest variability observed at dormant stages in both years (Figure 4).

Relative titer, estimated using the ratio of primers 16S and CP cycle threshold values (16S:CP CT ratio), obtained from quantitative PCR for grapevine red blotch virus (GRBV)-positive vines at three different canopy positions (basal, middle, and apical) across four phenological stages in A) 2020 and B) 2021. Data points represent means (n = 26 to 28) of the samples identified as positive in 2020 and 2021. Error bars represent standard error of the means.
Discussion
GRBV is a geminivirus that affects grapevine fruit qualities, including delayed fruit ripening and reduced fruit qualities (Blanco-Ulate et al. 2017, Girardello et al. 2019, Martínez-Lüscher et al. 2019). In addition to graft transmissibility of GRBV, the increase in disease incidence across vineyards and the confirmation of the three-cornered alfalfa hopper, S. festinus, as a vector of GRBV (Bahder et al. 2016, Flasco et al. 2021), suggests an insect vector is likely exacerbating the spread of GRBV within and to nearby vineyards (Cieniewicz et al. 2018, Dalton et al. 2019). Therefore, earlier detection can be critical in preventing further spread of GRBV by informing grapevine removal decisions. In addition, currently available GRBV management recommendations are to plant only vines derived from certified, virus-negative nursery stocks during vineyard establishment, removal of infected vines once the infection appears in an established vineyard, and regular monitoring for the presence of possible insect vectors. It is suggested that long-term vineyard profitability is possible if infected vines are removed when the disease incidences are still less than 30%. Once GRBD incidence exceeds 30%, the entire vineyard should be removed to minimize economic losses (Ricketts et al. 2017). This makes early detection and removal of infected vines even more critical; sample timing and location are therefore important considerations when testing.
Currently, there are several methods available for detecting GRBV (Al Rwahnih et al. 2013, Krenz et al. 2014, Setiono et al. 2018, Li et al. 2019, Romero Romero et al. 2019). One of the most common methods applied by commercial growers is to collect samples from suspicious vines and send them to commercial laboratories that use DNA-based detection methods such as endpoint and quantitative PCR. However, discrepancies on test results were reported when the same vines were tested over different times and tissue types (Achala KC, personal communication with vineyard managers and growers). Setiono et al. (2018) reported seasonal variations on GRBV titers when their levels were significantly lower earlier in the growing season in June compared to later in October. Similarly, GRBV titer was lower on the shoot tips compared to fully expanded basal leaves. These differences in virus titers resulted in the false negative results early in the season and on the younger tissues (Setiono et al. 2018). Our study also revealed that the older leaves at the base of the canopy provide the most consistent results by both endpoint PCR and qPCR assays throughout the growing season, while later stages such as harvest and dormancy are the best phenological stages to minimize variability in sample collection. Furthermore, the sensitivities (true positive ratio) of all assays were improved at later stages at both the middle and top of the canopy.
The higher sensitivity to GRBV observed across all methods from basal leaf samples, and the lower sensitivity observed on the younger leaves, is likely the result of rapid vegetative growth outcompeting the speed of GRBV translocation into newly formed leaves. Because of the putative phloem-limited nature of GRBV (Sudarshana et al. 2015) and other geminiviruses, mobility of the virus within a fast-growing canopy is most likely limiting detection of GRBV at earlier phenological stages. We also observed a stepwise pattern of increased sensitivity of GRBV detection as the tissues’ maturity progressed. When vegetative growth decelerated postveraison (Tarara et al. 2009), GRBV sensitivity was significantly increased at the middle and apical leaf samples, specifically around harvest and dormancy.
We observed decreased specificity of all methods while using dormant canes compared to other stages. From the 2020 results of dormant cane tests, more than 50% of the remaining negative vines tested positive using LAMP, endpoint PCR, and qPCR assays. However, in the 2021 growing season, none of these vines tested positive in any of the stages, including dormant cane sampling. The results from 2020 dormant cane tests attributed to lower average specificity during this sampling stage. One possible phenomenon for false positive results in 2020 could be sample contamination, although we could not identify the source of contamination. Other related factors could be virus distribution and movement in the vines as affected by environmental variables. However, the effect of these factors needs further research.
PCR-based GRBV diagnoses are expensive for routine monitoring of GRBV infection and making roguing decisions. A LAMP assay was recently developed for GRBV detection that can be used in the field for routine monitoring and is less expensive compared to PCR-based detections (Romero Romero et al. 2019). Similarly, symptom-based diagnosis and vine removal was reported to be less expensive and effective in minimizing disease progression (KC et al. 2022). In this study, we compared these two methods with PCR-based detection methods and found that sensitivity and specificity of LAMP assays were lower compared to endpoint PCR and qPCR assays at fruit set. We found a weak but positive association (rpb = 0.54) between relative virus titer and sensitivity of LAMP assay. However, LAMP is a highly sensitive assay and can detect up to 50 fg/μL DNA, which was the amount lesser than detected by endpoint PCR and qPCR (Romero Romero et al. 2019). We believe that at earlier stages of vine development, such as fruit set and veraison, poor virus distribution in combination with the lower tissue weight requirement for LAMP results in decreased sensitivity of the assay. Furthermore, the LAMP test utilizes a crude extraction directly from leaves and GRBV-positive results are contingent on the presence of a color change from pink to yellow in the colorimetric LAMP reaction mix containing phenol red pH indicator (New England Biolabs). Compounds in the leaf tissue may result in prereaction pH changes that can give a lower specificity if the operator is not carefully observing prereaction color changes and can require dilution to resolve, therefore reducing the sensitivity. Nonetheless, in 2021 samples, the specificity of LAMP assay was improved to nearly 100% by diluting the eluded solution by two-fold.
At fruit set, none of the infected vines showed symptoms. At veraison and harvest, symptom expression in infected vines increased by 30 and 90%, respectively. At harvest, symptoms-based diagnosis was not significantly different than DNA-based diagnosis in both basal and middle canopy samples. In addition, a weak positive association (rpb = 0.42) between relative virus titer and symptom expression was observed at harvest. This association likely is a result of indirect physiological effect of the virus. For example, GRBV-infected vines have impaired sucrose translocation from leaves to fruit, resulting in higher foliar sugar levels (Wallis and Sudarshana 2016, Martínez-Lüscher et al. 2019, Levin and KC 2020). For grapevine leafroll-associated virus 3 (GLRaV-3), the infection of red wine grape cultivars results in red foliar symptoms and curled leaves, and the red foliar symptom is believed to be associated with increased foliar sugar levels (Gutha et al. 2010). Thus, it is possible that symptom expression begins around veraison and accelerates toward harvest as sugar metabolism increases; the translocation of sugars from leaves to fruits occurs between these stages. GRBV occludes sugar transport between the source and the sink, and symptom expression becomes severe at later stages (Levin and KC 2020). Nonetheless, symptom expression is indicative of GRBV infection, and can be used as a diagnostic tool by trained personnel. However, one should be aware of varietal differences in GRBD symptoms and other stressor-related symptoms that can be confused with GRBD.
Conclusion
The results of this study suggest that the accuracy of endpoint PCR, qPCR, and LAMP, and therefore their sensitivity and specificity, heavily depend on where the sample is collected, as well as the type of tissue and timing of collection. The number of sampling units is also critical for diagnostic accuracy. Based on our observation, four tissue samples per vine was optimum to discriminate between positive and negative vines, however we did not compare the accuracy with multiple levels of sampling units. Furthermore, the cultivar tested in this study is Pinot noir and all tests included scion tissues. The infection status of rootstock was not confirmed. Further studies comparing these variables would add to the understanding of additional factors to assay accuracy. Cost-effective methods such as pinprick DNA extraction, LAMP, and symptom-based diagnosis can offer a more accessible and cost-effective approach to conventional GRBV testing while still being reliable at harvest and dormancy for routine monitoring. More sensitive approaches using higher-yielding DNA extractions paired with a PCR-based method of detection can be beneficial in early season detection as well as diagnosis in nursery settings. We conclude that regardless of the detection methods, basal samples increase the probability of detecting GRBV from an infected grapevine, and variability among sample location is minimal at later stages of vine development, thus maximizing the selection of samples for GRBD diagnosis.
Footnotes
We thank Cody Copp, Bashira Muhammed, Katelin Kutella and Cassandra Kohler for their technical assistance with this work. Funding for this project was supported by the American Vineyard Foundation (award number 2017-2097) and USDA-NIFA-SCRI (grant number 2019-51181-30020). The authors declare no conflict of interest.
By downloading and/or receiving this article, you agree to the Disclaimer of Warranties and Liability. If you do not agree to the Disclaimers, do not download and/or accept this article.
- Received August 2022.
- Accepted January 2023.
- Published online April 2023
This is an open access article distributed under the CC BY 4.0 license.
References
Vol 74 Issue 1


Jump to section
Related Articles
Cited By...
More from this TOC section
Similar Articles
