


Abstract
Background and goals Grapes accumulate proanthocyanidins (PAs), complex polymer mixtures of flavan-3-ol units, in the skin and seeds. The composition of PAs, including subunit ratio and polymer length, and total concentration, is important because of their relationship to sensory properties of grape and wine. It is known that the grape species Vitis vinifera and Vitis labruscana have remarkably different PA concentration and composition. A mapping population derived from a cross between V. labruscana and V. vinifera was used to provide insight into the genetic architecture of PAs, as well as that of PA skin and seed properties.
Methods and key findings The composition of PA subunits at the terminal and extension positions in the hybrid population’s skin and seeds was examined in great detail. Hierarchical clustering analysis of PA profiles grouped PA variables into five main clusters. There were distinct clusters related to compositional differences in skin and seeds, such as the percentage of galloylated or trihydroxylated subunits, polymer length, and the total PA concentration. A quantitative trait locus (QTL) analysis revealed several different minor loci between skin and seeds, each contributing to the phenotypic variation of total PA concentration. A few major QTLs on linkage groups 1 and 17 were discovered to contribute to the phenotypic variation of PA composition in both skin and seeds.
Conclusions and significance A distinct genetic architecture between PA composition and total PA concentration in interspecific hybrid grapes was found. In contrast to PA concentration, a similar genetic architecture of PA composition was observed between skin and seeds.
Introduction
The phenolic compounds in horticultural crops have received much attention for their potential contribution to human health due to their antioxidant, antimicrobial, antiviral, and anticarcinogenic properties (Jackson 2000). In addition, phenolic compounds are important contributors to the organoleptic qualities of fresh fruit, fruit juices, and wine (Cheynier 2005). Proanthocyanidins (PAs), a flavonoid class, are complex polymer mixtures of flavan-3-ol units in various combinations. They are abundantly accumulated in grape skin and seeds. Because PAs affect astringency and bitterness (Vidal et al. 2003), they contribute positively to the sensory properties of red wine when extracted from grape skin and seeds during vinification. Because the PAs found in table grape skin impart an unpleasant astringent sensation, cultivars with less PAs in the skin are preferred.
The PA composition in grapes is more complex than in herbaceous plants such as Arabidopsis (Bogs et al. 2005). Grape PAs are mainly composed of four flavan-3-ol subunits: catechin, epicatechin, epicatechin gallate (galloylation), and epigallocatechin (B-ring trihydroxylation; Figure 1). Based on the mean degree of polymerization (mDP), calculated by the PA acid depolymerization method (phloroglucinolysis; Table 1), the grape PAs appear highly polymerized with these subunits (Kennedy and Jones 2001). Differences in PA composition, such as subunit ratio and mDP, have been reported to influence mouth-feel properties, as shown by a decline in overall astringency, with decreasing mDP and a rise in coarseness with increased galloylation and decreased B-ring trihydroxylation (Vidal et al. 2003).

Schematic representation of the proanthocyanidin (PA) biosynthetic pathway in grapes. Enzyme names are abbreviated as follows: DHD/SDH, 3-dehydroquinate dehydratase/shikimate 5-dehydrogenase; SK, shikimate kinase; PAL, phenylalanine ammonia-lyase; C4H, cinnamate 4-hydroxylase; 4CL, 4-coumarate:CoA-ligase; CHS, chalcone synthase; CHI, chalcone isomerase; F3H, flavanone 3-hydroxylase; F3′H, flavonoid 3′-hydroxylase; F3′5′H, flavonoid 3′,5′-hydroxylase; DFR, dihydroflavonol 4-reductase; LAR, leucoanthocyanidin reductase; LDOX, leucoanthocyanidin dioxygenase; ANR, anthocyanidin reductase; GT, glucosyltransferase; SCP, serine carboxypeptidase; GST, glutathione S-transferase; MATE transporter, multidrug, and toxic compound extrusion transporter. The products in the dotted line boxes are PAs as well as members of the terminal subunits and extension subunit precursors.
Description of proanthocyanidin (PA) variables. mDP, mean degree of polymerization.
There are three stages in the biosynthetic pathways of flavonoids: shikimate, general phenylpropanoid, and flavonoid (Figure 1). Two leucoanthocyanidin reductase isozymes (LAR1 and LAR2), as well as anthocyanidin reductase, were identified in grapes and characterized to function on the PA-specific branch leading to catechin and epicatechin synthesis, respectively (Bogs et al. 2005, Fujita et al. 2005, 2007). With respect to structural modulations of flavan-3-ol subunits, such as changes in hydroxylation pattern or flavonoid galloylation, several candidate genes and pathways have been identified. Flavonoid 3′-hydroxylase and flavonoid 3′5′-hydroxylases catalyze hydroxylation at the 3′ and 3′,5′ positions of the flavonoids’ B-ring, controlling the branching point of the parallel pathways and producing a compositionally different subunit with a B-ring hydroxylation pattern (Bogs et al. 2006, Koyama and Goto-Yamamoto 2008). For galloylation, gallic acid glucosylation by glucosyl transferases (Khater et al. 2012) is followed by transesterification of flavan-3-ols with 1-O-acyl glucose esters by serine carboxypeptidase-like acyltransferases (Terrier et al. 2009, Bontpart et al. 2018). Furthermore, PA polymerization was recently suggested to be a nonenzymatic process, requiring sequestration of the extension unit precursors, such as 4β-(S-cysteinyl)-epicatechin and 4β-(S-cysteinyl)-catechin, to the starter flavan-3-ols (Dixon and Sarnala 2020). However, the PA biosynthetic pathways are not completely understood, and the critical steps for the genetic regulation of PA subunit composition need to be elucidated.
At the gene level, quantitative trait locus (QTL) analysis of the PA composition in the F1 progeny from a Vitis vinifera Syrah × V. vinifera Grenache cross showed numerous QTLs for seed and skin variables, suggesting a complex genetic control and different genetic architectures in grape PA composition in skin and seeds (Huang et al. 2012).
V. vinifera is the most widely distributed grape species in the world, used to produce wine, juice, and raisins. However, these grapes are highly susceptible to fungal diseases (Reisch et al. 2012). Consequently, disease-resistant interspecific hybrid Vitis labruscana cultivars between V. labrusca and V. vinifera have been cultivated in North America and Japan (Yamada and Sato 2016).
Distinct differences in PA accumulation between V. labruscana and V. vinifera grapes were suggested by the remarkably lower PA concentrations in wine from V. labruscana cultivars, compared with that from V. vinifera (Ichikawa et al. 2012, Manns et al. 2013). In addition, distinct differences in PA composition, such as remarkably lower percentage of prodelphinidin (epigallocatechin) and galloylated units within PAs (Table 1, %P and %G, respectively), as well as lower mDP in V. labruscana cultivars than in V. vinifera cultivars, were previously reported (Koyama et al. 2017). However, thus far, no QTL analysis of PA composition in interspecific hybrid grapes has been performed, despite its important role for grape production. Thus, an interspecific hybrid population generated by crossing V. labruscana Campbell Early (CE) and V. vinifera Muscat of Alexandria (MA), both used as table and wine grapes in Japan (Kono et al. 2018), was used for QTL analysis in this study. This population is particularly interesting for the investigation of the genetic architecture of PA composition, because they originated from parents with a remarkably different genetic background. This study aimed to understand the relationship between PA variables in the hybrid population, as well as their genetic architecture. We analyzed in detail the composition of PA subunits at the terminal and extension positions in grape skin and seeds, and performed QTL analysis of these PA variables.
Materials and Methods
Plant materials
The mapping population used in this study (Pop AC, 95 F1 individuals) was generated by crossing MA and CE (Kono et al. 2018). Individuals of the population were grafted onto Kober 5BB rootstocks and planted in a vineyard at Higashihiroshima, Hiroshima, Japan’s Grape and Persimmon Research Station. Vines were cane-pruned using a horizontal trellis. Phenotypic data were obtained over two years (2014 and 2015). Eighty-four individuals were used in 2014, and 89 in 2015. Assessed by sensory evaluation of trained table grape breeders, and determined by grape coloration and eating quality, fruit clusters from each individual were harvested when fully ripe and of the highest quality, as previously described (Ban et al. 2016). Clusters from the parents were also harvested for comparison. Fifteen grapes from each individual were randomly collected from three clusters and grape weight was recorded. After peeling and deseeding the grapes with a scalpel, the skin and seeds were weighed and immediately frozen in liquid nitrogen and stored at −80°C until further analysis.
Chemicals and reagents
Catechin, epicatechin, epigallocatechin, and epicatechin gallate were purchased from Funakoshi. Phloroglucinol was purchased from Tokyo Chemical Industry Co., Ltd. Liquid chromatography-mass spectrometry-grade trifluoroacetic acid (TFA) was purchased from Sigma. Liquid chromatography-grade acetonitrile and methanol, as well as L (+)-ascorbic acid, were purchased from Wako Pure Chemical.
Extraction and quantification of skin and seed PAs
Frozen samples were ground to a fine powder using a multi-beads shocker (Yasui Kikai). PAs were extracted from the grape skin and seeds using the optimized method of Mané et al. (2007) in three replicates. Briefly, 0.1 g of ground powder was extracted with 14 mL acetone/water/methanol (51:34:15, v/v/v) acidified with 0.05% TFA for 67 min for skin PAs, and 11 mL of the same extraction solvent for 90 min for seed PAs. An aliquot (1.2 mL) of each extract was dried in a centrifugal evaporator (CVE-3100, EYELA) and subjected to PA phloroglucinolysis. The detailed methods of phloroglucinolysis and subsequent high-performance liquid chromatography (HPLC) analysis were previously described (Koyama et al. 2007). The flavan-3-ols and phloroglucinol adducts generated by PA depolymerization were quantified using calibration curves built from flavan-3-ol standards, which included catechin, epicatechin, epigallocatechin, and epicatechin gallate. The mole equivalents of phloroglucinol adducts were quantified by calculating their molar absorptivities from that of catechin by multiplying their relative molar response in published data (Kennedy and Jones 2001). The description of PA variables derived from the concentration of these subunits is shown in Table 1. The %P, %G, and mDP values in the PAs were calculated as mole percent of prodelphinidin (epigallocatechin) subunits to total subunits, galloylated subunits (epicatechin gallate) to total subunits, and total (the sum of terminal and extension) subunits to terminal subunits, respectively. Total PA concentrations were calculated by adding the concentration of these degradation products and subtracting the weight of the phloroglucinol moiety, and were displayed as the amount per g of fresh tissues (mg/g tissue fresh weight), the total content per grape (mg/berry), and the amount per g of grapes (mg/g berry). Total PA concentration (mg/g berry) is an enological measurement that takes yield into account.
QTL analysis of PA subunit concentrations and composition
QTL analysis was carried out by using both parental and consensus maps in MapQTL v.6 software (Van Ooijen 2009). Linkage maps were constructed as previously described (Kono et al. 2018). The number of simple sequence repeat (SSR) markers on the consensus map, MA map, and CE map was 338, 269, and 237, respectively, with average distances of 4.6, 6.0, and 6.5 cM, respectively. The detailed genetic maps of Pop AC were described by Kono et al. (2018). However, we also added newly developed SSR markers to the map. The details on the markers are shown in Koyama et al. (2022). The total PA concentration, the concentration of each subunit in the skin and seeds, and the composition from 84 individuals in 2014 and 89 in 2015 in each of the two years, and the mean values over the two years, were subjected to QTL analysis. QTLs were identified by interval mapping. The logarithm of the odds (LOD) threshold corresponding to the genome-wide significance level of 0.05 was determined using 1000 permutation cycles. QTLs were selected by the LOD score of the peaks exceeding the threshold value, and the confidence interval based on 1.0–LOD was used to estimate the putative QTL position. A QTL was considered stable if reproducibly detected over the two years and confirmed by the data averaged over that time. To confirm the QTL’s effect, the relationship between the phenotypic values for the two years and the genotypes of the nearest markers to the QTL were analyzed. Genotypic data for each marker were obtained from the data sets of the genetic maps that were created.
The 12 × PN40024 genomic sequence (FIPCGGC 2007) was used to identify potential candidate genes underlying QTLs near SSR markers. The physical location of the candidate genes related to the PA biosynthetic pathway was compared with those of the SSR markers underlying QTLs indicated by the NCBI Map Viewer public database.
Statistical analyses
Student’s t test was used to evaluate significant differences in PA variables of the skin and seeds between the parents. First, hierarchical clustering was carried out for PA subunit concentrations and total PA concentration, as well as PA composition in the skin and seeds among Pop AC individuals. Subsequently, a one-way analysis of variance and Tukey’s honest significant difference test were performed to compare the PA variables of the skin and seeds for the genotypes of SSR markers nearest to the identified QTLs. These statistical analyses, as well as the visualization by heat map, histogram, and box plot, were performed using JMP version 14.0 software (SAS Institute, Inc.). In addition, correlation matrix analysis was performed to analyze the correlation between the PA variable profiles among Pop ACs. This analysis was performed using SIMCA version 15 software (MKS Umetrics).
Results
Differences of PA variables in the skin and seeds of parent cultivars
PA subunit concentrations and composition in the skin and seeds of MA and CE are shown in Table 2. Both parent cultivars showed characteristic skin and seed PA profiles. Consistent with previous reports (Koyama et al. 2017), epigallocatechin units at the extension position specifically in skin PAs, high concentrations of epicatechin gallate at both positions, high %G in the seed PAs, and high mDP in the skin PAs were clearly observed. However, skin and seed PA profiles were remarkably different between parent cultivars. Total skin PA, and all subunit concentrations except catechin and epigallocatechin at the extension, were higher in CE than in MA. Additionally, %P, %G, and mDP in the MA skin were significantly higher than in CE. Moreover, seed total PA and all subunit concentrations in MA were significantly higher than in CE. %G and mDP in MA were higher than in CE, similar to the trends observed in skin PAs. The ratio of skin to seed PA contents per grape in MA was 0.16, much lower than in CE (0.96).
Comparison of proanthocyanidin (PA) subunit concentrations and composition in the skin and seeds of Muscat of Alexandria (MA) and Campbell Early (CE). The values are the average of replicates for two years.
Correlation among PA variables in the skin and seeds of the interspecific hybrid population
The PA composition profiles in the skin and seeds of the Pop AC were analyzed and compared. To show the correlation between 24 PA variables (11 for skins, 13 for seeds), hierarchical clustering (Figure 2) and correlation matrix analysis (Supplemental Tables 1 and 2) were performed for PA composition at both years. Cluster analysis grouped PA variables into five main clusters (C1-C5). For example, C1 is composed of skin total PA, as well as skin catechin and epicatechin at the terminal and extension. Skin total PA concentrations, expressed as mg/g skin, showed the highest correlation coefficient (r = 0.99) with skin epicatechin at the extension (Supplemental Tables 1 and 2). In contrast, seed total PA and most seed PA subunits were clearly grouped in C5. Seed epicatechin at the extension was highly correlated with seed total PA, expressed as mg/g seed (r = 0.94, Supplemental Tables 1 and 2). Alternatively, variables showing subunit concentration and composition were grouped into different clusters than those related to total PA concentration. For example, the profile of skin epicatechin gallate, epigallocatechin, and skin %P in C2 differed from that in C1, even if closely related when compared to variables showing seed total PA concentrations in C5. Epigallocatechin and skin %P were particularly closely correlated, as suggested by its definition. Additionally, although PA variables showing the galloylation degree of both skin and seeds were included in C3, the mDP of skin and seed PAs were grouped in C4. Seed catechin at the extension was included in the same cluster as mDP.

A heat map showing two-dimensional hierarchical dendrograms of proanthocyanidin (PA) variables in a hybrid population (Pop AC). Each column in the heat map represents a PA variable and each row, an individual. The upper dendrogram corresponds to PA variables where the clusters are indicated by C1-C5. The dendrogram on the left corresponds to individuals where the clusters are indicated by S1-S8. The values were normalized for the heat map visualization. Higher values are presented in red, and lower values are presented in blue, as shown in the scale on the right. PA subunits at the extension position are indicated by (Ex), and those at the terminal position are indicated by (T). %P, percentage of prodelphinidin subunit; %G, percentage of galloylation; mDP, mean degree of polymerization.
Individuals were grouped by cluster analysis into eight clusters (S1-S8). The clusters of individuals S6-S8 contained the highest values of skin PA variables in C1 and C2 among Pop AC, while the seed PA variables in C5 showed the lowest values. On the contrary, the clusters of individuals S4 and S5 contained the highest values of seed PA variables in C5, while low values of skin PA variables were observed in C1.
QTL analysis of PA variables in the skin and seeds of the interspecific hybrid population
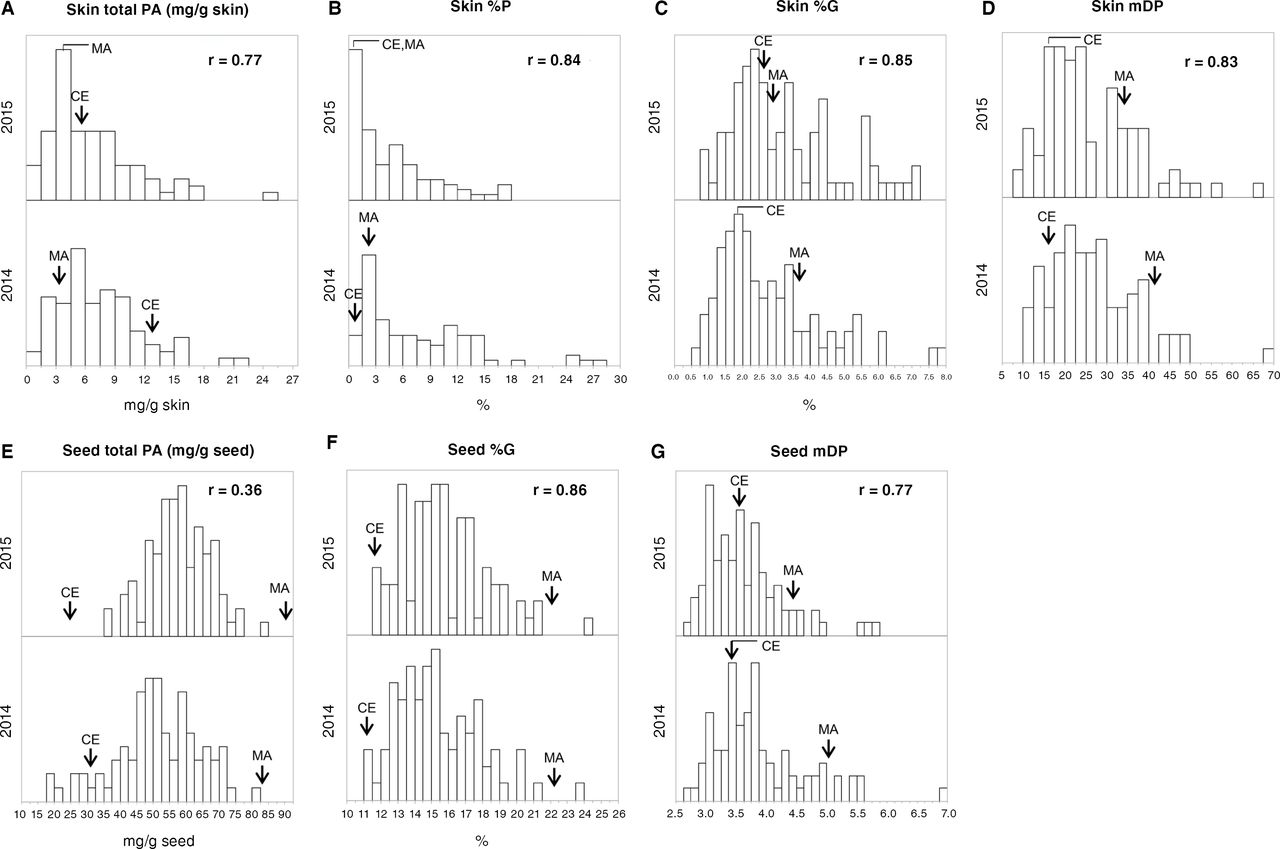
The frequency distribution of each PA variable among Pop AC individuals showed continuous variation over the two year study period, as typical of quantitative traits (Figure 3 and Supplemental Figure 1). This study found a transgressive segregation in the population for all the variables. Overall, the concentrations of PA variables correlated well across years, with nine PA variables in the skin showing high correlation coefficients (>0.8). The correlation coefficients in seed PA composition variables, such as %G and mDP, were also high (0.86 and 0.77, respectively; Figure 3 and Supplemental Figure 1).

Histograms of total proanthocyanidin (PA) concentrations and variable composition in the skin and seeds among the hybrid population (Pop AC) over two years. Histograms of total PA concentration and composition in the skin and seeds for two years (2014 and 2015) are shown: A) skin total PA concentrations; B) skin percentage of prodelphinidin subunit (%P); C) skin percentage of galloylation (%G); D) skin mean degree of polymerization (mDP); E) seed total PA concentrations expressed as mg/g seed; F) seed %G; G) seed mDP. The total PA concentration is expressed as mg/g tissues. On the vertical axis, the frequency of a given class for the population is shown. Arrows indicate the positions of the parent’s values; MA, Muscat of Alexandria; CE, Campbell Early. The correlation coefficients between years are shown in the upper right section in each histogram. Histograms of all PA variables examined are shown in Supplemental Figure 1.
Next, QTL analysis was performed using PA concentrations and composition for each of the two years (2014 and 2015), and also using those of the mean values over the whole period. A large number of QTLs was detected for these traits with an LOD over the threshold at α = 0.05 (Supplemental Table 3). Table 3 shows stable QTLs detected in both years.
Quantitative trait loci (QTLs) of proanthocyanidin (PA) subunit concentrations and composition in the hybrid population (Pop AC) identified in both years. LOD, logarithm of the odds.
Many QTLs related to PA concentration in the skin and seeds were detected, but with low contributions to the phenotypic variance. Furthermore, different loci were found depending on the year and concentration scale, i.e., mg/g tissue, mg/berry, and mg/g berry. For skin PA concentration (mg/berry) and that of mg/g berry, a QTL on LG1 in the MA map and a QTL on LG2 in the CE map were detected, respectively (Table 3). Other QTLs, such as QTLs on LG8 and 14 in the CE map and on LG16 in the MA map for skin PA concentration, as well as QTLs on LG7 and LG10 in the MA map and on LG11 in the CE map for seed PA concentration, were also detected, although their LODs were only significant for one of the two years (Supplemental Table 3).
However, for PA composition, we detected major QTLs contributing highly to their phenotypic variance (Table 3). For example, a QTL on LG17 was dominant for mDP of both skin and seed PA, explaining 45 to 53% and ~20 to 26% of the skin and seed variance, respectively. A QTL on LG17 whose confidence interval based on 1.0–LOD overlapped with that of the QTLs for mDP was also detected for seed catechin at the extension, with a dominant effect. This is consistent with the close correlation between seed catechin at the extension and mDP of both skin and seeds (Figure 2). Similarly, the proximity between these QTLs was stably detected for skin catechin at the terminal, although its contribution to phenotypic variance was comparably low (average 15%). For skin %P, a QTL on LG1 was detected on the MA map in both years. Its peak was located near the markers VMC3G9 and VVIQ57. A QTL, whose confidence intervals based on 1.0–LOD overlapped with those of the QTL for skin %P, was also significantly detected for the skin epigallocatechin at the extension in 2015 (Supplemental Table 3), consistent with the close correlation of these variables among Pop AC individuals (Figure 2). Alternatively, for the %G of both skin and seed PA, another QTL on LG1 was commonly found on the CE map, explaining 43 to 54% and 27 to 32% of the phenotypic variance for the skin and the seed, respectively. Its peak was located in the latter half of LG1 near VMC9F2 and VMC4D2. A QTL on LG1, whose confidence interval based on 1.0–LOD overlapped with that of the QTL for skin %G, was also stably found for skin epicatechin gallate at the extension. An additional QTL on LG18 in the MA map was also stably found for seed %G, explaining 27 to 30% of the phenotypic variance. Consistent with the close correlation between seed %G and seed epicatechin gallate at the extension, QTLs on LG1 and 18, whose confidence interval based on 1.0–LOD overlapped with those of the QTLs for seed %G, were found for seed epicatechin gallate at the extension. However, QTLs were significantly detected only in one year.
The effect of QTL on PA composition in the skin and seeds of the interspecific hybrid population
To confirm the effect of the QTLs detected in the skin and seeds of Pop AC, the relationship between phenotypic values and the genotypes of the closest markers for each QTL were examined (Supplemental Figure 2). When several markers were closely located to a QTL, the marker with the largest and most stable effect was selected; the relationships between the genotypes for the selected markers and the corresponding PA variables are shown in Figure 4. Figure 4A shows a significantly lower mDP of skin and seed PAs in progenies with the 118–base pair (bp) VVIQ22.2 allele on LG17 inherited from the CE, than in progenies with the other allele. Seed catechin concentrations at the extension were also lower in progenies with that allele. On the contrary, skin catechin concentrations at the terminal were higher in progenies with this allele than in progenies with the other allele. The increase in terminal unit concentrations and the decrease in extension unit concentrations both increase the mDP of PA. Figure 4B shows a significantly higher %G of skin and seed PA in progenies with the 314–bp VMC9F2 allele on LG1 inherited from the CE, than in progenies with the other allele. Moreover, the skin epicatechin gallate concentrations at the extension were significantly higher in progenies with the same allele than in progenies with the other allele. In addition, progenies with the 97–bp VVIP08 allele on LG18 inherited from the MA showed higher seed %G (Figure 4C). Furthermore, Figure 4D shows higher skin epigallocatechin concentration at the extension in progenies with the 147–bp VMC3G9 allele on LG1 inherited from the MA, than in progenies with the other allele. Thus, the effects of QTL alleles on PA composition were confirmed by comparing the mean values for the genotypes of the selected markers, i.e., VVIQ22.2 on LG17 for mDP, VMC9F2 on LG1 for %G, VVIP08 on LG18 for seed %G, and VMC3G9 on LG1 for %P.
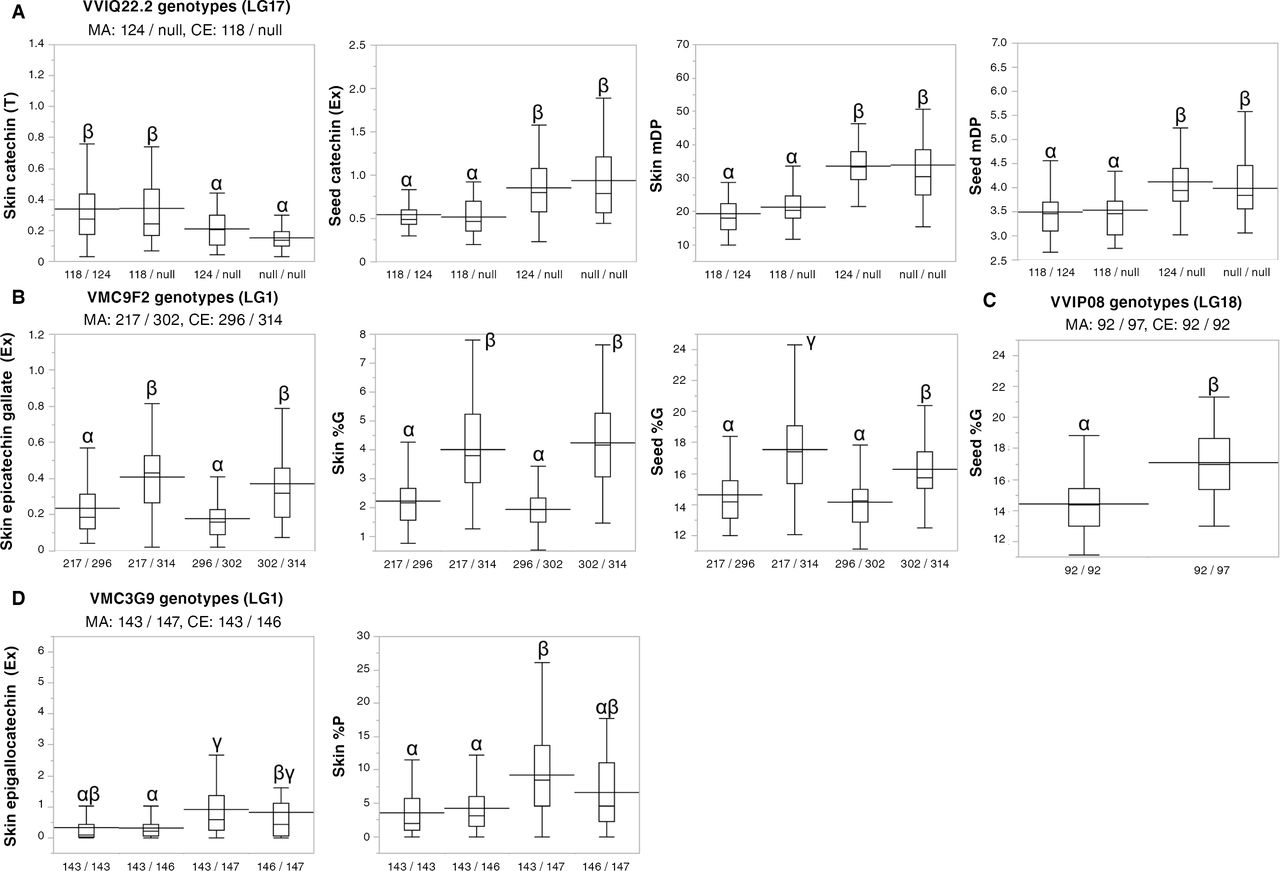
Box plots of proanthocyanidin (PA) subunit concentrations and composition for the stable simple sequence repeat (SSR) marker genotypes nearest to the quantitative trait locus (QTL) in the hybrid population (Pop AC). The genotypes are expressed as allele length in base pair (bp). The horizontal line inside a box shows the median value, and the horizontal line through a box indicates the mean. Box height indicates 50% of the data. Different letters (α, β, γ) indicate statistical significance at p < 0.05 by Tukey’s honest significant difference. PA subunits at the extension position are indicated by (Ex), and those at the terminal position are indicated by (T). %P, percentage of prodelphinidin subunit; %G, percentage of galloylation; mDP, mean degree of polymerization. The box plot for the genotypes of all SSR markers detected is shown in Supplemental Figure 2.
Discussion
Detailed analysis of PA subunit composition at the terminal and extension in the skin and seeds of genetically diverse progenies of V. vinifera × V. labruscana over two years revealed that PA variables were co-regulated by specific clusters and that the individuals contained a combination of different cluster strengths. In addition, the results suggested that PA variables related to its composition, such as %P, %G, and mDP, are modulated differently from total PA concentration in skin and seeds. Furthermore, particularly for these variables, stable QTLs with large effects were obtained (Table 3), including different loci from a previous report analyzing the PA composition of a QTL mapping population with a V. vinifera background (Huang et al. 2012). Despite the similar arrangement of SSR markers on the linkage maps between V. vinifera and the interspecific hybrid (Kono et al. 2018), different genes and mechanisms may be involved in the traits of interspecific hybrids. The wide diversity of PA composition within our population originating from the remarkable differences in PA composition of both skin and seeds between parent cultivars (Table 2, Figure 3) will support this hypothesis.
Genetic architecture of PA polymerization degree in skin and seeds
The mDP of both skin and seed PAs was governed by a major QTL on LG17, consistent with a previous finding (Huang et al. 2012). In addition, VvLAR2 (VIT_17s0000g04150, chr17:4274544...4277281), a LAR isogene, was located near the SSR marker (VVIQ22.2, chr17:4493200…4493300) for this QTL in the 12 × PN40024 sequence (FIPCGGC 2007) and considered a promising candidate for mDP regulation. The multiple functions of LARs, which not only synthesize catechin from leucocyanidin, but also convert extension unit precursors, such as 4β-(S-cysteinyl)-epicatechin and 4β-(S-cysteinyl)-catechin into monomeric flavan-3-ols, have been reported (Figure 1), suggesting their role regulating the ratio of starter to extension units, and the mDP of the PA produced (Yu et al. 2019, Dixon and Sarnala 2020). Our results showed a positive correlation between mDP and seed catechin at the extension, and a negative correlation between mDP and seed catechin and epicatechin at the terminal (Supplemental Tables 1 and 2). Consistently, a possible common QTL on LG17 was obtained for these three traits. Although several single nucleotide polymorphisms in linkage disequilibrium for VvLAR1 localized on LG1 were significantly associated with skin mDP (Huang et al. 2012), no QTL around the gene locus was detected for the mDP of both skin and seeds. Alternatively, VvLAR2, which contains a key amino acid change in Syrah grapes, was reported to abolish LAR activity and was associated with PA formation with higher mDP (Yu et al. 2019). Further research aiming to elucidate VvLAR2 differences among alleles is warranted. Because the mDP of PAs is considered to influence astringency intensity (Vidal et al. 2003), this locus will become a target for the development of interspecific hybrid grapes and modify the overall astringency of PAs in the skin and seeds.
Analytical method of PA and the timing of sampling
Phloroglucinolysis is known to have analytical approach deficiencies, such as incomplete polymer chain cleavage within PAs, which leads to the underestimation of concentrations and PA size. Even with this limitation, our previous study (Koyama et al. 2017) found that the skin and seed PA concentrations in the berries measured by phloroglucinolysis among the diverse grape accessions were comparable to those measured by vanillin assay, one of the standard methods for determining the total amount of flavan-3-ols. Furthermore, despite the fact that the mDP of PAs in wine before storage calculated by phloroglucinolysis was greater than that estimated by normal-phase HPLC, the trends among the differentially treated wines were consistent between the two analytical methods (Koyama et al. 2007). Given these findings and the lack of alternative methods for determining the composition of PA, phloroglucinolysis is appropriate for the time being.
In terms of sampling timing, it is well known that PA concentration decreases significantly during ripening (Bogs et al. 2005, Fujita et al. 2005). This decrease was explained by the fact that PA localization in plant cells can shift from the vacuole to the apoplast, and PAs are oxidized and covalently attached to the cell wall, rendering them unextractable (Geny et al. 2003, Gagné et al. 2006). However, PA composition in the skins, such as %P, %G, and mDP, showed little or no change during ripening (Koyama and Goto-Yamamoto 2008). Thus, samples collected before veraison appear to be more appropriate for studying the genetic regulation of PA biosynthesis; however, samples collected at the harvest stage were used in this study to identify QTLs that influence the PA quality and quantity of grapes at harvest.
Genetic architecture of galloylation and trihydroxylation degree of skin and seed PAs
PA subunit composition can affect the quality of astringency (Vidal et al. 2003). PAs with highly galloylated subunits, such as seed PAs, relate to higher coarseness and bitterness compared to PAs with low galloylated subunits, such as skin PAs. Previously, several QTLs with only minor contributions to the PA galloylation were reported (Huang et al. 2012). In addition, Huang et al. (2012) found no common QTLs for the skin and seeds, which differs from the results of our study. Here, %G, as well as epicatechin gallate, particularly at the extension of both skin and seed PAs, were found to be governed by the major QTL at LG1; for seed %G, another QTL on LG18 was detected (Table 3). In addition, significant differences on %G among QTL genotypes were confirmed; the selection of progenies with 296–bp VMC9F2 allele (Figure 4B) or the avoidance of those with the 314–bp allele might be a good strategy for positive impact on the PA sensory perception when V. labruscana is used for breeding. Because the same QTLs for epicatechin and catechin were not detected in both tissues, it was considered to specifically affect the flavonoid galloylation pathway (Figure 1). A previous report (Huang et al. 2012) detected the QTL on LG3, where the glucosyl transferases of the flavonoid galloylation pathway are located; however, this QTL was not found in the present study. In addition, none of the 12 candidates in serine carboxypeptidase IA in grapes previously reported (VvGAT1 and 2, VvSCP5, 6, 27, 31, 45, 52, 53, 56, 57, and 60, all located either on LG3 or LG11) (Bontpart et al. 2018) were located with the QTLs on both LG1 and LG18. Thus, different genes and mechanisms might be involved in flavonoid galloylation in interspecific hybrid grapes.
Skin PAs specifically contained an epigallocatechin subunit (Table 2); high abundance of this subunit is reported to increase the texture fineness (Vidal et al. 2003). We detected a further QTL on LG1 for %P and epigallocatechin at the extension (Table 3, Supplemental Table 3). Because %P is considered to positively affect the sensory properties of skin PAs (Vidal et al. 2003), the selection of progenies with high %P will be important for interspecific hybrid breeding. Previous reports showed that a genomic region (LG6) corresponding to the F3’5’H gene family co-localized with the QTL detected for this trait (Falginella et al. 2010, Huang et al. 2012). However, the QTL on LG1 found in this study suggested different genes and mechanisms for the regulation of hydroxylation of PA subunits in hybrid grapes.
The QTL detected for %P in this study differed from that for %G in that their confidence intervals based on 1.0–LOD did not overlap. This suggested independent %P and %G regulations among Pop AC. If QTLs for %P and %G were identified, we would be able to select seedlings with varying PA composition profiles, which would allow us to control the quality of PA astringency in grape skin and seeds. To improve wine texture, increasing the %P of skin PAs and decreasing the %G of skin and seed PAs could effectively reduce coarseness while increasing fineness.
Genetic architecture underlying PA concentrations of skin and seeds
In contrast to the genetic architecture of PA composition, few stable QTLs, and several QTLs detected only in one of the two years with minor contribution, were found for the total PA concentration (Table 3, Supplemental Table 3), suggesting a complex regulation of PA concentration wherein a single locus has little influence. A complex multigenic regulation of PA biosynthesis is suggested by the involvement of several MYB transcription factors, including VvMYBPA1, VvMYBPA2, VvMYB5a, VvMYB5b, VvMYBPAR, VvMYBC2-L1, and VvMYB86 (Deluc et al. 2006, 2008, Bogs et al. 2007, Terrier et al. 2009, Huang et al. 2014, Koyama et al. 2014, Cheng et al. 2021).
Furthermore, similar to a previous study (Huang et al. 2012), a distinct genetic architecture of total PA concentrations in skin and seeds was suggested by the different loci of the QTLs detected for them (skin total PA: LG1, 2, 8, 14, and 16; seed total PA: LG7, 10, 11). However, similar genetic architecture of PA composition, such as %G and mDP in skin and seeds, was suggested in this study. More research is required to comprehend the mechanisms underlying this difference.
Aside from genetic factors, environmental factors such as climate are thought to affect PA metabolisms (Fujita et al. 2005, 2007, Koyama and Goto-Yamamoto 2008, Koyama et al. 2014). The correlation coefficients of PA variables between two years in each individual were relatively high overall, indicating a large genetic effect. However, the low correlation coefficients in some variables, such as seed PA subunit concentrations, indicate that the environment has a large influence. This could obscure the genetic effect for these traits in this study, which are particularly related to PA concentrations.
Although the wide variations in PA composition profile in our population allowed us to understand the overviews of the genetic architecture in interspecific hybrid grapes, additional research aimed at improving the accuracy of mapped QTLs by increasing the number of individuals and markers in the mapping population is required to identify the candidate genes and effective markers to assist breeding.
Conclusion
This study revealed several minor QTLs for the total PA concentrations in skin and seeds, suggesting multigenic regulation of the traits in interspecific hybrid grapes. On the other hand, PA composition as shown by variables such as subunit composition and polymerization length (mDP) were differentially regulated from total PA concentration; common stable QTLs with major effects were found for both skin and seed PAs. The first is a QTL on LG17 that highly contributes to mDP; VvLAR2 was located near the QTL. In addition, we newly identified two different major stable QTLs on LG1 for galloylation and trihydroxylation degree, respectively, of the flavonoid B-ring. In the future, these findings might allow the control of astringency intensity and quality in grape skin and seeds.
Supplemental Data
The following supplemental materials are available for this article in the Supplemental tab above:
Supplemental Table 1 Correlation matrix heat map of proanthocyanidin (PA) subunit concentrations and composition in 2014 among the hybrid population (Pop AC). Higher absolute correlation coefficients are shown in higher orange color intensity, as indicated on the scale in the left side of the table.
Supplemental Table 2 Correlation matrix heat map of proanthocyanidin (PA) subunit concentrations and composition in 2015 among the hybrid population (Pop AC). Higher absolute correlation coefficients are shown in higher orange color intensity, as indicated on the scale in the left side of the table.
Supplemental Table 3 Quantitative trait locus (QTL) analysis results of proanthocyanidin (PA) subunit concentrations and composition in the hybrid population (Pop AC). Full list of detected QTLs, including those only identified in a single year, is shown. LOD, logarithm of the odds.
Supplemental Figure 1 Histograms of proanthocyanidin (PA) subunit concentrations and composition in the skin and seeds among the hybrid population (Pop AC) over two years. Histograms of PA variables in the skin and seeds for two years (2014 and 2015): A-F) skin PA subunit concentrations; G-I) skin total PA concentrations; J-L) skin percentage of prodelphindin subunit (%P), percentage of galloylation (%G), and mean degree of polymerization (mDP); M-R) seed PA subunit concentrations; S-V) seed total PA concentrations; W, X) seed %G and mDP. The vertical axis indicates the frequency of a given class for the population. Arrows indicate the concentrations of the two parents. MA, Muscat of Alexandria; CE, Campbell Early. PA subunits at the extension position are indicated by (Ex), and those at the terminal position are indicated by (T). The correlation coefficients between years are shown in the upper right section in each histogram.
Supplemental Figure 2 Box plot of proanthocyanidin (PA) subunit concentrations and composition for the genotypes of simple sequence repeat markers nearest to the quantitative trait locus in the hybrid population (Pop AC). Genotypes are expressed as allele lengths in base pairs (bp). A horizontal line inside a box shows the median value, while a line through a box indicates the mean. Box height indicates 50% of the data. Different letters (α, β, γ) indicate statistical significance at p < 0.05 by Tukey’s honest significant difference. PA subunits at the extension position are indicated by (Ex), and those at the terminal position are indicated by (T). %P, percentage of prodelphinidin subunit; %G, percentage of galloylation; mDP, mean degree of polymerization.
Footnotes
The authors would like to thank Dr. Akira Totsuka at Techno Culture Co., Ltd., for the advice and encouragement of the studies of proanthocyanidin composition in the grapes and wine, as well as Kazutaka Naito at Yamanashi Prefectural Fruit Tree Experimental Station for the fruitful discussion about the analysis of astringency and the sensory evaluation of the grapes for the table grape breeding. The authors would also like to note that Kazuya Koyama and Atsushi Kono have contributed equally to this publication.
By downloading and/or receiving this article, you agree to the Disclaimer of Warranties and Liability. If you do not agree to the Disclaimers, do not download and/or accept this article.
- Received August 2022.
- Accepted January 2023.
- Published online April 2023
This is an open access article distributed under the CC BY 4.0 license.
References
Vol 74 Issue 1


Jump to section
Related Articles
Cited By...
More from this TOC section
Similar Articles
