

Abstract
Insufficient sunlight during veraison to maturity of winegrapes is a primary factor that inhibits production of phenolic compounds. In this study, a novel thinning technique called cluster tip removal (CTR) was applied to inflorescences of Vitis vinifera L. Marselan grapes, and the berry composition, phenolic profiles, and antioxidant activities of berry skins and wines were determined. CTR of inflorescences reduced cluster compactness, lowered titratable acidity, and increased total soluble solids in berries. CTR also increased concentrations of total phenolics, anthocyanins, tannins, and flavonoids in the pedicel end of berry skins and enhanced concentrations of 12 phenolic compounds. It also increased the concentrations of total flavanols and anthocyanins in wines. CTR berries and wines also had increased antioxidant capacities. Finally, expression of phenolic-related genes was upregulated in the skin of CTR berries.
- anthocyanin
- antioxidant activity
- phenolic acid
- pruning
Phenolic compounds, including anthocyanins, flavan-3-ols, flavonols, phenolic acids, and stilbenes, are involved in plant growth, development, and metabolism. Phenolic acids participate in nitrogen metabolism in Populus × euramericana Neva by acting as an allelochemical inhibitor of photosynthesis (Xie et al. 2018). Anthocyanins are involved in many aspects of plant growth, including tolerance to ultraviolet (UV)-B damage and drought stress and in the elimination of free radicals (An et al. 2019, Wang et al. 2019). Phenolic compounds are abundant in grapes; their concentrations are used to determine quality and nutritional value since they can help prevent oxidative damage and provide other health benefits to humans (Lingua et al. 2016a). In addition, they can contribute to the mouthfeel and color of red wines (Lesschaeve and Noble 2005, Tian et al. 2011). The amounts of phenolic compounds also contribute to the antioxidant capacity and nutritional value of grape and wine products (Tian et al. 2011, Lingua et al. 2016b).
The degree of variation of phenolic compounds in winegrapes depends on grape variety, climate, and cultural practices (Rodríguez Montealegre et al. 2006). Recent studies have examined the influence of the grapegrowing environment on phenolic compounds in grape. Pathways in which carbon flows to flavonoid metabolism to a specific branch of grape berries can be influenced by “terroir,” which includes characteristics of soils and climates. These include temperature, rainfall, and topography, but the most important influencer is sunlight (Li et al. 2011). Sunlight exposure influences production of phenolic compounds in grapes (Spayd and Tarara 2002). Additionally, exposure to ultraviolet light improves accumulation of phenolic compounds in grapes (Pan et al. 2009).
There has been rapid expansion of grape and wine production in China. The three largest wineries are located in the Jiaodong Peninsula region: Changyu, COFCO Great Wall, and Weilong. The large-scale wineries in Yantai, a city on the Jiaodong Peninsula, account for 32.57, 53.35, and 64.03% of total domestic wine production, income, and profits, respectively. Northern China has a continental monsoon climate, which is rainy and hot year-round. This region has insufficient sunlight, which lowers the quality of its winegrapes (Li et al. 2009). The concentrations of anthocyanin, flavonols, and phenolic acids in Cabernet Sauvignon grapes grown in this region are lower than in those grown in western China, such as those in Xinjiang, Gansu, and Ningxia (Li et al. 2011).
To improve production of secondary metabolites in grapes, growers usually remove the leaves from around the clusters to improve sunlight exposure. However, berry clusters of most Vitis vinifera winegrape cultivars grown in the Jiaodong Peninsula region are tight, and the berry sizes are large, owing to heavy rainfall. In addition, the skins of berries inside the clusters and the pedicel end skins of berries on the cluster surface usually have poor color, an indicator that the fruit is of poor quality. Reducing cluster compactness by techniques such as berry thinning is an effective way to improve sunlight exposure (Han et al. 2019), but the operation is laborious and extremely time-consuming. The clusters also usually remain cylindrical and the skins at the bottom of berries still cannot receive sufficient sunlight. We attempted to improve the sunlight exposure of the inner berries using cluster tip removal (CTR) of inflorescences and evaluated its effects on the phenolic profiles and antioxidant properties of the berries. This work describes a cultivation practice that can optimize the quality of wine and grapes grown in the Jiaodong Peninsula region or in other regions that have insufficient sunlight.
Materials and Methods
Plant materials and CTR of inflorescences. Seven-year-old, own-rooted Marselan (V. vinifera L.) vines were used. Vines with a vertical trellis system were spaced at 2.5 m (row spacing) × 1 m (vine spacing) in a north-south row orientation. The study was conducted from 2017 to 2018 during two consecutive seasons in a commercial vineyard (the Great Wall Wine Co., 37°8′N; 120°75′E) in Penglai (Yantai, Shandong, China), which is a seaside county with sandy loam soil. The average annual rainfall is 606.2 mm, the active accumulated temperature from July to September in the most recent 10 years is 2112℃, and the cumulative hours of sunshine from July to September during the most recent 10 years are 600 to 700 hrs. The daily average temperature, sunlight hours, and rainfall during 2017 to 2018 was determined (Supplemental Table 1).
On 3 June 2017 and 7 June 2018, CTR was performed on grapevines at the E-L 17 stage (12 leaves separated, inflorescence well developed, single flowers separated). Specifically, one hand was used to hold the inflorescence, while the other cut off the upper branches along the rachis with a pair of scissors. Depending on the cluster’s tightness, one or two large lateral branches were cut off at intervals. Finally, approximately one-third of the small flower spikes were cut off, leaving the remaining clusters flat. Each inflorescence on a vine was pruned (Figure 1E). In 2020, this CTR technique obtained a Chinese national invention patent (CN 108112420 B).

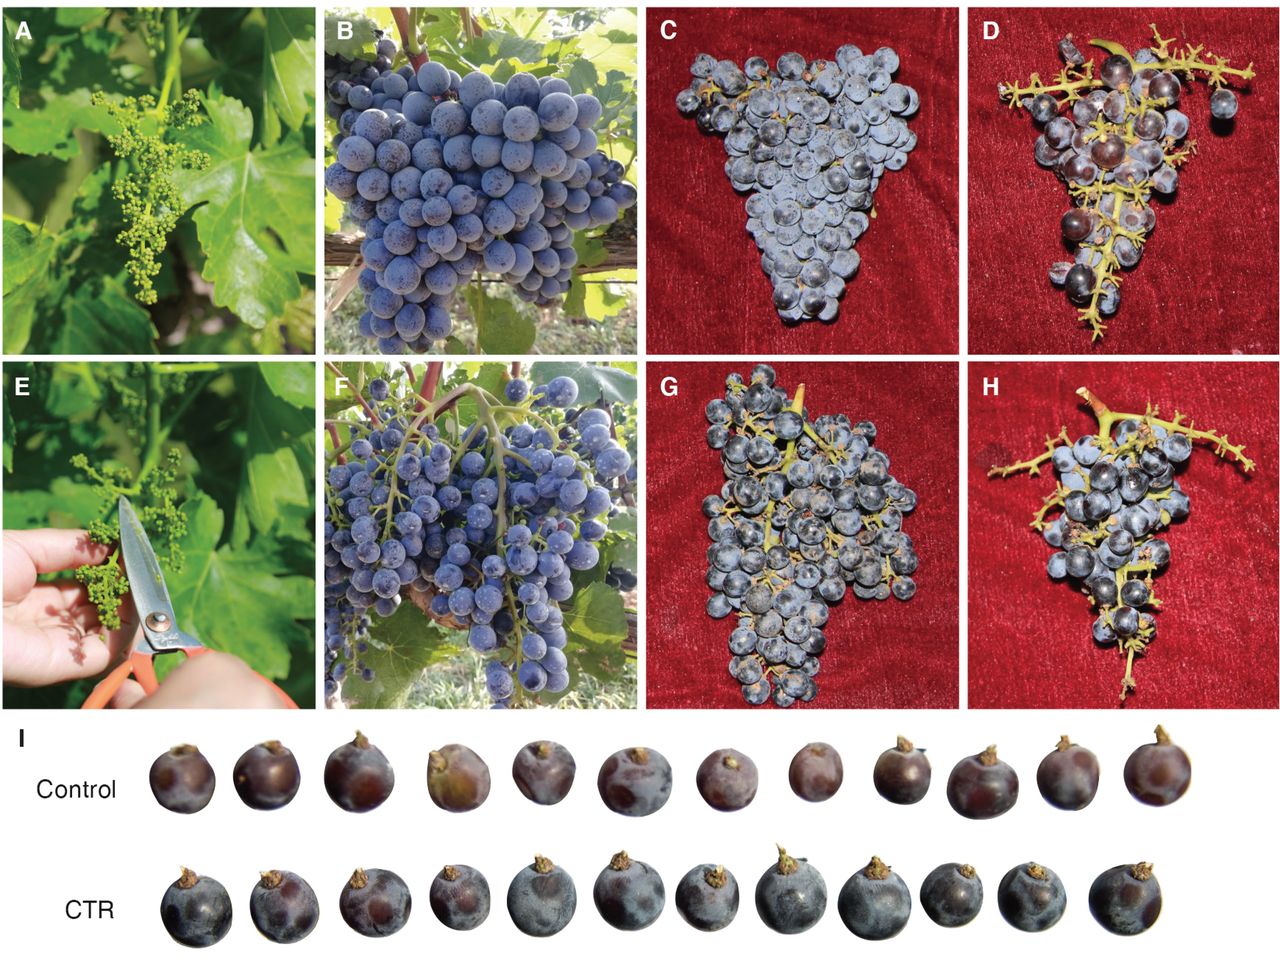
Comparison of cluster compactness and berry skin color before and after cluster tip removal (CTR) of Marselan inflorescences grown in the Great Wall vineyard in Penglai (Shandong, China). (A) Control inflorescence. (B) and (C) Control cluster. (D) Inner berries from control cluster. (E) Demonstration of the CTR of inflorescences. (F) and (G) Cluster of inflorescences obtained after CTR. (H) Inner berries from CTR grapevine. (I) Inner berries at the bottom of a cluster from control (top) and CTR (bottom) grapevines.
The experiment followed a randomized block design with three replications. Three blocks with similar texture and fertility in the vineyard were selected and each replicate consisted of one of 120 vines. To reduce marginal effect, guard rows were set between every treatment. The CTR and control samples were both harvested when the total soluble solids (TSS) of control berries was >23%. In 2017, there was excessive rainfall during berry development (July to September), with accumulation of 123% higher than that in 2018 (Supplemental Table 1). Diseases such as downy mildew (Plasmopara viticola) and white-rot fungi (Coniothyrium diplodiella) were therefore more serious. Thus, in 2017, we harvested the berries in advance of the typical harvest time to reduce losses, which may have caused insufficient TSS in the control berries. In each treatment, 20 clusters of each replicate were collected to determine the berry composition.
Basic maturity parameters of berries from five clusters of each replicate were determined. The skins of berries from eight clusters of each replicate were divided into two parts: the distal end and the pedicel end (Supplemental Figure 1). After being divided, the berry skins were immediately frozen in liquid nitrogen and stored at -80°C for extraction of phenolic compounds, determination of antioxidant capacity, and quantitative real-time PCR (RT-qPCR) analysis. Whole skins of berries from seven clusters were peeled and immediately frozen in liquid nitrogen, stored at -80°C, and used to determine the anthocyanin compounds.
Determination of basic maturity parameters. The number of grape berries in each cluster was counted and cluster length was measured using a vernier caliper. Cluster weight and berry weight were determined using an electronic scale (Mettler Toledo Instruments Co. Ltd). Berry number/cluster length and cluster weight/cluster length ratios were then calculated. TSS was measured using a hand refractometer (Atago Co. Ltd.). pH was determined using a Mettler Toledo FE20 Desktop pH Meter (Mettler Toledo Instruments Co. Ltd). Titratable acidity (TA) was determined as described previously (Xu et al. 2017). Yield was determined at harvest. All treatments were carried out in triplicate (n = 3) and the data were averaged.
Extractions of phenolic compounds. Total phenolics, anthocyanins, flavonoids, flavanols, condensed tannins, and phenolic compounds were extracted as described previously (Xu et al. 2017). One gram grape skin powder or 1 mL wine was mixed with 8 mL methanol containing 0.1% acetic acid and the mixture was incubated in a water bath at 25°C for 1 hr. After that, the mixture was centrifuged at 8000 rpm at 4°C for 15 min. The residues were re-extracted three times and the supernatants were collected, combined, and filtered through filter paper. The filtrate was evaporated to dryness at 30°C in a rotary evaporator and then redissolved in 5 mL methanol (high-performance liquid chromatography [HPLC] grade). One part of the extract was used to determine total anthocyanins, phenols, and flavonoids, while the other part was purified through a C18 solid phase extraction cartridge (ProElut, DIKMA). In the purification process, the cartridges were first rinsed with methanol (HPLC grade). After that, the samples were passed through the cartridges using a vacuum pump operated at a flow rate of <0.7 mL/sec and were then collected in sample bottles attached to the cartridges. The concentrations of phenolic compounds in the purified extract were then determined.
Photometric determination of total anthocyanins, phenols, flavonoids, flavanols, and condensed tannins. The total anthocyanin concentration was calculated using the equation OD = A530 – (0.25 × A657), in conjunction with a calibration curve prepared using standard malvidin-3-monoglucoside (Extrasynthese; Li et al. 2013). Total phenol concentration was measured using the Folin-Ciocalteu method (Dewanto et al. 2002), and a calibration curve was prepared using gallic acid. The total concentration of flavonoids was determined using a colorimetric method described previously (Singleton and Rossi 1965), with a calibration curve prepared using rutin. The data were expressed in µg rutin equivalents. Condensed tannin concentration was measured as described previously (Broadhurst and Jones 1978). The total flavanol concentration was calculated using a calibration curve constructed with (+)-catechin as the standard. The tannin concentration was measured against a catechin standard curve and expressed as mg catechin equivalents/g fresh skin.
Analysis of anthocyanins by UHPLC-Q-ToF-MS. Ultra-high-performance liquid chromatography (UHPLC) coupled to quadrupole time-of-flight mass spectrometry (Q-ToF-MS; Waters Corp.) was employed to detect anthocyanins. The HPLC separation was performed at 35°C on a reversed-phase Acquity UPLC BEH C18 analytical column (100 mm × 2.1 mm, particle size 1.7 μm). The parameters and conditions were set as described (Machado et al. 2015) with modifications as follows: injection volume: 5 μL; solvent flow rate: 0.3 mL/min; mobile phase A: water/formic acid (100:3, v/v); mobile phase B: acetonitrile/formic acid (100:3, v/v); and UV detection wavelength: 530 nm. The following gradients were used: 0 to 30 min: 0 to 50% B; 30 to 35 min: 50 to 100% B; and 35 to 37 min: 100 to 0% B. The compounds were ionized by an electrospray ionizer (ESI) operated in a positive mode and were scanned from m/z = 50 to m/z = 2000. Other parameters were set as follows: desolvation gas flow: 12 L/min; desolvation temperature: 400°C; cone gas flow: 1.2 L/min; source temperature: 100°C; capillary voltage: 3.0 kV; cone voltage: 30 V; and collision energy: 25.0 eV. The total anthocyanin concentration was determined using an external calibration curve prepared using malvidin-3-monoglucoside (Extrasynthese).
Analysis of non-anthocyanin phenolic compounds by UHPLC-MS. Concentrations of non-anthocyanin phenolic compounds were determined using UHPLC coupled to an ESI-triple quadrupole mass spectrometer (Dionex Ultimate 3000; Thermo Fisher Scientific). The HPLC separation was performed at 30°C on a reversed-phase C18 analytical column (100 mm × 2.1 mm, particle size: 1.9 μm; Thermo Scientific). The operating conditions were as described (Nováková et al. 2010) with modifications as follows: injection volume: 5 μL; flow rate of mobile phase: 0.3 mL/min; mobile phase A: acetonitrile; and mobile phase B: 5 mM ammonium acetate. The gradient elution was as follows: 0 to 1 min: 0 to 10% A; 1 to 3.5 min: 10 to 40% A; 3.5 to 5 min: 40 to 65% A; 5 to 11 min: 65 to 90% A; 11 to 12 min: 90% A; 12 to 12.1 min: 90 to 10% A; and 12.1 to 14 min: 10% A. The MS was equipped with a negative ion mode ESI and operated as follows: capillary voltage: 3.0 kV; ion source temperature: 300°C; desolvation temperature: 400°C; cone gas flow: 0.2 L/min; source temperature: 100°C; cone voltage: 35 V; and collision energy: 25.0 eV.
Antioxidant activity assays. The antioxidant activity against 2,2-diphenyl-1-picrylhydrazyl (DPPH), defined as the amount of antioxidant required to decrease the initial DPPH concentration by 50% (EC50), was determined as described previously (Katalinić et al. 2010). The EC50 was expressed as the gallic acid equivalent. The antioxidant capacity against 2,2-azino-bis (3-ethylbenzthiazoline-6-sulfonic acid) (ABTS) was determined as described (Re et al. 1999). The ferric-reducing antioxidant power (FRAP) was determined as described (Sun et al. 2011). The antioxidant capacity against ABTS and FRAP was expressed in Trolox equivalents.
Wine vinification. Sixty kg of grapes from each replicate was used for small-scale winemaking as described (Yue et al. 2018) with slight modifications. Berries from the CTR treatment and control grapevines were harvested by hand and squeezed using a roller to obtain musts. After adding 50 mg/L sulfur dioxide, the musts were transferred to a 50-L stainless steel fermentation tank and 20 mg/L pectinase was added. The grape musts were cooled to 5 to 10°C within 12 hrs and incubated for 48 hrs. After that, they were heated to 18°C. After being activated at 39°C for 30 min, 20 mg/L yeast (Laffort F15) was added to initiate alcoholic fermentation. During the fermentation, the temperature was <22℃ on the first day, 25℃ on the second day, and <28℃ on the third day. The wine caps were punched down twice daily to ensure that they remained submerged in the musts. After seven days maceration, the fermentation was concluded when the specific gravity of the fermentation liquor dropped to 0.99 g/cm3 and the residual sugar was <5 g/L. The wine residue was pressed and the free-run and pressed wines were combined and stored in vessels. Malolactic fermentation was carried out and monitored over one month. After one month, the fermentation was terminated by adding 50 mg/L sulfur dioxide and the wines were cold-stabilized at 4°C for one month. The finished wines were filtered, bottled, and stored.
RT-qPCR analysis. Changes in grape skin gene expression in response to CTR were measured using RT-qPCR. Total grape skin RNA was extracted using a FastPure Plant Total RNA Isolation Kit (RC401, Vazyme), and cDNA was synthesized from the total RNA using a cDNA synthesis kit (HiScript q-RT SuperMix; Vazyme). RT-qPCR was performed using SYBR Green MasterMix (SYBR Premix EX Taq TM) on a Bio-Rad iQ5 instrument.
Statistical analysis. All statistical analysis was performed by SPSS software (version 19.0, IBM, Inc.). The data were subjected to a one-way analysis of variance (ANOVA), and the difference between mean values was determined at 1% or 5% using Duncan’s multiple range test.
Results and Discussion
Effect of CTR on cluster and berry attributes. Representative photographs of inflorescence CTR are shown (Figure 1A and 1E). As a result of CTR, the compactness of the cluster decreased (Figure 1B, 1C, 1F, and 1G) and most berries, including those at the bottom, received more sunlight. The color of berries inside and at the bottom of the cluster were darker than those of the control (Figure 1D, 1H, and 1I).
The cluster weights of pruned clusters harvested in 2017 and 2018 were 70.66% and 71.63%, respectively, of those of the control. Additionally, the berry number/cluster length and cluster weight/cluster length ratios decreased by 20.53% and 36.86%, respectively, in 2017, and by 34.38% and 39.11%, respectively, in 2018, compared with those of the control. This suggests that CTR decreases cluster compactness. The width and length of pruned berries harvested in 2017 and 2018 also increased slightly after CTR. However, they were not statistically different from those of the control. The weights of berries harvested in 2017 and 2018 increased by 5.92% and 10.92%, respectively, compared with those of the control (Table 1).
Yield and other properties of Marselan berries from a Great Wall vineyard in Penglai (Shandong, China) from 2017 to 2018. CTR, cluster tip removal.
The TSS and skin/berry ratio of the samples also increased after CTR. The TSS increased by 10.64% and 6% in 2017 and 2018, respectively. The skin/berry ratio of berries harvested in 2018 increased by 15.04%. The TA of berries harvested also decreased by 20.28% and 13.4%, respectively, in 2017 and 2018.
Clusters that are exposed to sunlight after basal defoliation generally contain more sugars, anthocyanins, and flavonols but lower concentrations of malic acid and TA than shaded clusters (Wang et al. 2018b). Leaf removal improves the sunlight exposure of outer, but not inner, berries. Thus, one method to improve fruit quality is to allow the inner berries to receive more sunlight. Unlike the traditional method, in which native grapegrowers usually remove only one cluster from one shoot, CTR not only reduces the fruit load, but also increases the sunlight exposure of most berries in a cluster. CTR technique decreased cluster compactness and the berry number/cluster length and cluster weight/cluster length ratios because this technique allows the inner berries of clusters to receive more sunlight. Too high a yield has a negative effect on the ripening and quality of grape berries and can decrease wine quality. CTR could remove approximately one-third of berries and reduce the fruit load. Like floral cluster pruning (Zhang et al. 2016), inflorescence CTR increases berry weight and TSS and decreases TA. It is likely that CTR allows the remaining berries to accumulate more photosynthetic products, increasing their TSS.
In addition to inflorescence CTR, season also affected TSS. In 2017, there was abundant rainfall and reduced sunlight hours, particularly in July, when veraison occurred. The increased TSS in grape berries grown in 2017 was more accentuated than that in grape berries grown in 2018. This suggests that weather conditions can affect the efficacy of our CTR technique.
Differences between concentrations of total phenolics, flavonoids, flavanols, anthocyanins, and tannins in berry skins and wines. Skin at the pedicel end of berries received insufficient sunlight owing to excessive cluster compactness. Thus, we divided the skin of a berry into two parts: the distal end and the pedicel end (Supplemental Figure 1). The concentrations of total phenolics and total anthocyanins in the distal end of the berry skins were greater than in the pedicel end (Table 2). CTR also increased the concentrations of total phenolics, flavonoids, anthocyanins, and tannins in the pedicel ends of the berry skins and in wine prepared from those berries. Additionally, CTR also reduced the differences between the concentrations of these compounds (except for flavonoids) in between the distal and pedicel end skins. The concentrations of total phenolics, flavonoids, anthocyanins, and condensed tannins in the distal end of CTR berries were 7.56, 29.29, 6.06, and 9.45% greater than in the distal end of control berries, respectively. Similarly, the concentrations of total phenolics, flavonoids, anthocyanins, and condensed tannins in the pedicel end skins of pruned berries were 50.52, 66.46, 12.1, and 31.47%, respectively, greater than those in the skins at the pedicel end of control berries. Nonetheless, the concentrations of total flavanols in the distal and pedicel end skins of the berries were less than those in the skins at the same parts of control berries.
Concentrations of total phenolics, flavonoids, flavanols, anthocyanins, and tannins in Marselan berry skins and wines from a Great Wall vineyard in Penglai (Shandong, China) in 2018. CTR, cluster tip removal.
Phenolic compounds accumulate primarily in berry skins. Berry skin thickness is an index that can be used to efficiently predict the extractability of anthocyanins (Río Segade et al. 2008). Mild to moderate water deficit and early leaf removal can increase the berry skin/flesh ratio (Zsófi et al. 2014). In this study, we found that inflorescence CTR increased the skin/berry ratio, possibly due to the increased sunlight exposure of the pedicel end of both inner and outer berries. Therefore, the increased thickness of berry skin caused by CTR could increase the sink capacity and increase the concentration of phenolic compounds. In addition, the impact of CTR on phenolic compounds could be the result of changes in microclimates, which cause the metabolic pathway to be promoted. Sunlight exposure has a direct effect on the metabolic pathway, causing the increase in synthesis of some phenolic compounds (Boss and Davies 2009).
While CTR increased sunlight exposure on berry skins, it also reduced the cluster load. Although cluster thinning increases berry quality, it also increases berry size and weight in the retained clusters (Diago et al. 2010, Gil et al. 2013), thereby reducing the concentrations of phenolics and anthocyanins (mg/g). However, in this study, the berry weight and berry composition of CTR berries were both greater than those of the control berries in 2018 (Table 1), which suggested that the increased phenols and anthocyanins should be attributed more to increased sunlight exposure than reduced load. This was confirmed by the differences in composition between distal and pedicel berry skin, where the pedicel end berry skins had larger increases in flavonoids, anthocyanins, and condensed tannins with CTR than the distal end berry skins (Table 2).
CTR increased the antioxidant activities of berry skins and wines. Because there is no universal assay that reflects all antioxidant activities in a complex system, we employed three assays to evaluate the antioxidant activities of grape skins and wines (Table 3). The FRAP and ABTS assays found much greater antioxidant activity at the distal end of control berries than at the pedicel end. The skins of CTR berries exhibited a much greater antioxidant capacity than the skins of control berries, particularly at the pedicel end. The concentrations of FRAP and ABTS in the distal end of berries were 30.95% and 18.02%, respectively, greater than those in the equivalent skin portions of control berries. In addition, the concentrations of FRAP and ABTS in the pedicel end skins of CTR berries were 83.07% and 55.30%, respectively, greater than those of pedicel skins of control berries. In addition, the concentrations of DPPH and FRAP in wines prepared from CTR berries were 31.4% and 33.70% greater, respectively, than in wines prepared from control berries.
Antioxidant activities of Marselan berry skins and wines from a Great Wall vineyard in Penglai (Shandong, China) in 2018. CTR, cluster tip removal.
Furthermore, the Pearson’s correlation between antioxidant activity and total phenols concentration was determined. A weak correlation between total phenol concentration and DPPH was observed in all samples, which indicates that DPPH is not sensitive to antioxidants in grape berries (Table 3). The correlation of total phenols, flavonoids, flavanols, and anthocyanins with FRAP and ABTS were significant and there was a strong correlation between total anthocyanins and ABTS (p < 0.01).
SET methods (single electron transfer), such as ABTS, DPPH, and FRAP, are based on the determination of RE-DOX potential and are used widely because of their simple operation and high sensitivity. DPPH is a synthetic and stable free radical, which presents a deep purple color and a strong absorption band in the range of 515 to 520 nm. In the presence of antioxidant compounds, DPPH can accept an electron or a hydrogen atom from the antioxidant scavenger molecule to be converted to a more stable DPPH molecule. Since the reduced form of DPPH is pale yellow, it is possible to determine antioxidant activity by measuring the change in color spectrophotometrically (Molyneux 2004, Carmona-Jiménez et al. 2014). The ABTS assay is also based on decoloration, which occurs when the radical cation ABTS+ is reduced to ABTS (Re et al. 1999, Katalinić et al. 2010). The antioxidant activity of polyphenols is related to the number and location of phenolic hydroxyl groups. The greater the number of phenolic hydroxyl groups, the stronger the antioxidant activity. Therefore, many biologically active compounds, including anthocyanins and other antioxidant phenolic compounds, play a key role in preventing oxidative damage (Wang et al. 2018a, Fang et al. 2019, Sun et al. 2019). In this study, we observed that there was a strong correlation between the activities of ABTS and FRAP and anthocyanins, which suggests that anthocyanins are the primary contributors to the antioxidant activity of wines. A previous study reported similar results (Meng et al. 2012).
CTR increased the concentration of anthocyanins in berry skins. The skins of CTR berries contained higher concentrations of anthocyanins than those of control berries, primarily dephinidin-3-O-glucoside (Dp), petunidin-3-O-glucoside (Pt), malvidin-3-O-(trans-6-O-coumaryl)-glucoside (t-Mv-co), and malvidin-3-O-glucoside (Mv) (Table 4). Mv and its derivative, t-Mv-co, were the most abundant anthocyanins, and cyanidin was undetectable in the skins of berries from both control and CTR grapevines. As a result of CTR, the concentrations of Pt, Dp, Mv, and t-Mv-co in berry skins increased by 229.62, 108.93, 98.49, and 52.42%, respectively. The concentrations of total anthocyanins, as well as of t-Mv and t-Mv-co, also increased in CTR berries. The concentrations of Mv derivatives were reported as most abundant among all 33 different types of anthocyanins in grape berries (Liang et al. 2008). It is likely that Mv and its derivatives are the primary contributors to antioxidant activity in grape berries and wines.
Species and concentrations of anthocyanins in Marselan berry skins from a Great Wall vineyard in Penglai (Shandong, China) in 2018. CTR, cluster tip removal; FW, fresh weight.
Composition and concentration of non-anthocyanin phenolic compounds in control and CTR berries. The concentrations of non-anthocyanin phenolic compounds in the CTR berry skins were higher than in the control, likely owing to the presence of higher concentrations of non-flavonoid phenolics and flavonols (not flavanols) (Table 5). p-Coumaric acid was the most abundant non-flavonoid phenolic compound in the berry skin. Furthermore, the concentrations of caffeic acid, p-coumaric acid, and gallic acid in CTR berry skins were 295.53, 45.42, and 33.10%, respectively, greater than those in the control berries, particularly at the distal end of the berries. The change in flavonols was similar to that in non-flavonoid compounds; isoquercitroside was the most abundant flavonol compound in CTR berries, accounting for 85.3% and 89.8% of the total at the pedicel and distal ends, respectively. The increases in flavonol compounds at the pedicel end of berries were more obvious than those at the distal end. The concentrations of naringin and isoquercitroside in the pedicel end skin of berries from CTR grapevine were 232.7% and 56.73%, respectively, greater than those in the same part of berries from control grapevine. Additionally, the concentrations of naringin and isoquercitroside in the distal end of berries from CTR grapevine were 74.32% and 15.37%, respectively, greater than those in the skins of berries from control grapevines. Kaempferol was only detected in the skins (both the distal end and pedicel end) of CTR berries. In contrast, there was less (+)-catechin, the main building block of flavanols, in berries from CTR grapevine than in berries from control (unpruned) grapevine; the concentrations of (+)-catechin in the distal and pedicel end berry skins were 83.3% and 82.18%, respectively, less than in the control.
Concentrations of different non-anthocyanin phenolic compounds in Marselan berry skins from a Great Wall vineyard in Penglai (Shandong, China) in 2018. (Unit: mg/kg fresh weight). CTR, cluster tip removal.
Sunlight exposure causes accumulation of phenolic compounds in grapes (Wang et al. 2018b), and early leaf removal can have a greater effect on phenolic accumulation than cluster thinning (Bubola et al. 2017). Compared with the above two techniques, CTR not only increased sunlight exposure of the clusters but also decreased activity per grapevine. After CTR, the increases in gallic acid, p-coumaric acid, and caffeic acid were most prominent among all non-flavonoid phenolic compounds, and the increases in kaempferol and myricetin were most prominent among flavonol compounds. Increasing sunlight exposure promotes synthesis of flavonols in grapes (Downey et al. 2004). Another study on Malbec grape suggested that cluster thinning enhances synthesis of dihydroquercetin-3-glucoside and other flavonol compounds (Martín et al. 2011).
Effect of CTR on relative expressions of genes involved in phenolic biosynthesis. To understand the effect of CTR on accumulation of phenolic compounds at the transcriptional level, several relevant genes involved in phenolic biosynthesis were analyzed using RT-qPCR (Figure 2). Expression levels of VvFLS1 (flavonol synthase/flavanone 3-hydroxylase 1), VvF3’H (flavonoid 3’-hydroxylase), VvF3’5’H (flavonoid-3’ 5’-hydroxylase), VvANS (anthocyanidin synthase), and VvMYBA1 in the pedicel end skins of CTR berries were much greater than those in the pedicel end skins of control berries. The most obvious change was in VvFLS1, where expression in CTR berry skins was 23.06-fold greater than in control berry skins. Expression of VvMYBA1 in the CTR berry skins was upregulated to 12.25-fold greater than in control berry skins. However, expression of VvLAR1 (leucoanthocyanidin reductase 1) was reduced in CTR berry skins.

Transcriptional changes with cluster tip removal (CTR) of phenolic biosynthesis-related genes in grape berry skins. Relative expression, determined by quantitative real-time PCR, of VvFLS1, VvF3′5′H , VvLAR1, VvF3′H, VvANS, and VvMYBA1 (an identified transcription factor involved in anthocyanin synthesis) genes in the pedicel ends of berry skins as a result of CTR. VvActin was used as an internal control, to which each gene’s expression was normalized. VvFLS1: flavonol synthase; VvF3′5′H: flavonoid 3′,5′-hydroxylase; VvLAR1: leucoanthocyanidin reductase; VvF3′H: flavonoid 3′-hydroxylase; and VvANS: anthocyanin synthase. Different lower case letters indicate significant differences (p < 0.05).
Changes in phenolic compounds could be attributed to changes in the expression profiles of related genes. Sunlight exclusion has a negative effect on related structural and regulatory genes, including chalcone synthase (CHS), chalcone isomerase (CHI), F3’H, dihyoflavonol reductase (DFR), leucoanthocyanidin dioxygenase (LDOX), UFGT, and MYBA1, in the berry skin of Cabernet Sauvignon (Jeong et al. 2004). In seedlings of Lambrusco grape, transcription of CHS, CHI, F3H, DFR, LDOX, and UFGT genes was very low when the seedling was grown in darkness but increased dramatically when the seedling was exposed to six hours of light (Sparvoli et al. 1994). In this study, upregulation of VvF3’H and VvF3’5’H may increase production of dihydroquercetin and dihydromyricetin, which could be then catalyzed to quercetin and myricetin by VvFLS1, which had 23.06-fold greater gene expression in CTR berry skins than in control berry skins. Leucocyanidin may be generated and converted to (+)-catechin in CTR berries, as consistent with the expression level of VvLAR1. In addition, Mv could be synthesized downstream and increased expression of VvMYBA1 benefits this step. VvMYBA1 is the key gene that regulates coloration of berry skin (Walker et al. 2007). Its expression was 9.58-fold greater in CTR berry skins than in control berry skins. The elevated expression of VvMYBA1 and VvANS were consistent with greater accumulation of anthocyanins in CTR berry skins. Based on the above observation, VvMYBA1 may participate in metabolic regulation of anthocyanins and other phenolic compounds by regulating expression of genes involved in phenolic acid biosynthesis.
Conclusions
CTR of inflorescences decreased the compactness of the grape cluster and increased TSS and skin/berry ratio. Berries from CTR grapevines and wine prepared from these berries contained higher concentrations of total anthocyanins, total phenols, and flavonoids and had more antioxidant activity than berries’ unthinned control clusters. We also observed a correlation between anthocyanin concentrations and antioxidant activity. CTR also increased the concentrations of anthocyanin derivatives, including Dp, Pt, t-Mv-co, and Mv, and of non-anthocyanin phenolic compounds, including gallic acid, p-coumaric acid, caffeic acid, naringin, kaempferol, isoquercitroside, myricetin, and (+)-catechin. Lastly, we found that the CTR upregulated expression of VvFLS1, VvF3’H, VvF3’5’H, VvANS, and VvMYBA1 but downregulated expression of VvLAR1.
Footnotes
Acknowledgments: This research was supported by the China Agriculture Research System of MOF and MARA.
Supplemental data is freely available with the online version of this article at www.ajevonline.org.
By downloading and/or receiving this article, you agree to the Disclaimer of Warranties and Liability. The full statement of the Disclaimers is available at http://www.ajevonline.org/content/proprietary-rights-notice-ajev-online. If you do not agree to the Disclaimers, do not download and/or accept this article.
- Received November 2020.
- Revision received February 2021.
- Revision received March 2021.
- Accepted March 2021.
This is an open access article distributed under the CC BY license (https://creativecommons.org/licenses/by/4.0/).