


Abstract
Pinot noir grapevines (self-rooted Pommard clone) were grown in a pot-in-pot sand culture vineyard to examine the impact of low N, P, and K supply on vine growth and physiology. Four-year-old vines were given either full nutrition (Control) or reduced levels of each N, P, and K supplied at 50%, 20%, or 10% of the Control rate with all other nutrients held constant over three years (2006–2008). Vine growth, nutrient status, photosynthetic parameters, yield, and berry quality were monitored. The N, P, and K status of vines was reduced by each of the intended treatments, although N and P concentrations in leaf blades and petioles were reduced earlier and to a greater extent than K. Low N treatments reduced dormant season cane weights in all years, shoot lengths and leaf area in 2008, and fruit yield in 2008. Yield reduction under low N supply in 2008 was primarily a result of reduced berry size. Low N also reduced single leaf photosynthesis and quantum efficiency of photosystem II in 2008, while low P and K did not. Juice YAN (yeast assimilable nitrogen) levels were greatly reduced by low N supply in 2007 and 2008, although YAN was lower in 2007 across all treatments. Low P and low K supply did not alter growth or yield. Low P supply reduced juice P concentrations, but low K supply did not alter juice K. Reduced yield, growth, and juice YAN levels in low N treatments provide a framework to refine leaf blade and petiole N standards for Pinot noir grown in the region, but limiting levels of P and K were not as clearly defined.
Management of grapevine nutrition relies on measures of vine nutrient status based on concentrations in leaf blades or petioles most often sampled at bloom or veraison. The Pacific Northwest (PNW) winegrape industry has relied upon tissue nutrient standards that were developed for obtaining maximum yields of Thompson Seedless grapes grown in the Central Valley of California (Christensen et al. 1978, Christensen 1984) with local modifications based on historic averages from the region. Winegrape growers (and the commercial analytical laboratories that serve them) need nutrient guidelines for managing vineyards that are based on fruit quality as well as vine health and productivity. While it is well known that N and K, in particular, influence fruit and wine quality (Mpelasoka et al. 2003, Bell and Henschke 2005), the optimum levels of these nutrients present in vines as they relate to fruit quality are largely unknown, particularly for Pinot noir produced in western Oregon where vines are managed for low yields and premium quality.
Nitrogen (N) is probably the most important nutrient to manage in vineyards as it has a great impact on vine vegetative and reproductive development. Excessive N supply results in increased vegetative often at the expense of reproductive growth (Wheeler and Pickering 2003). Excessive N supply also results in poor berry quality due in part to increased shading of clusters, thereby decreasing color development (Spayd et al. 2002) and often increasing incidence of Botrytis infection of berries (Conradie and Saayman 1989a). Too little N can reduce yield and quality of fruit by reducing fruit set, berry growth, and maturation ultimately by reducing vegetative growth too severely to ripen the crop (Bell et al. 1979, Kliewer et al. 1991, Bell and Robson 1999). Excessive water supply in soil can also lead to an imbalance in vegetative versus reproductive growth of grapevines, thereby decreasing fruit quality variables (Wheeler and Pickering 2003). However, it is often difficult to separate effects of increased water supply from increased nutrient supply (Schreiner et al. 2006). High rainfall in the spring and early summer in the Willamette Valley of Oregon combined with generally deep soils of high organic matter content (that supply N via mineralization) can produce excessive early season vine vigor and, in some years, may result in no apparent water deficits throughout an entire growing season (Sweet and Schreiner 2010). Since western Oregon viticulturists cannot easily control soil water supply to reduce vegetative growth, there is interest in managing nutrients, particularly N, to control vegetative vigor.
Berry N and to a lesser extent berry P (phosphorus) and K (potassium) concentrations can be manipulated, intentionally or otherwise, by numerous viticultural and enological factors (Mpelasoka et al. 2003, Bell and Henschke 2005) that influence yeast growth, must pH, fermentation rate, and ultimately wine quality (Bisson 1999). Low N concentrations in fruit can limit fermentation rates and wine quality in many grapegrowing regions (Bely et al. 1990, Bell and Henschke 2005). Phosphorus deficiency in grapevines is rare in many viticultural areas (Christensen et al. 1978, Robinson 2005) and may be equally rare in fermentation due to the use of DAP (diammonium phosphate) by winemakers (Archer and Caster (1956)). However, low soil P availability is common in PNW vineyards (Schreiner et al. 2006), suggesting that P could be limiting productivity or fruit quality in the region. An oversupply of K resulting from excessive fertilizer use, excessive irrigation, or a low crop yield in relation to canopy size can lead to high berry K concentrations and, quite often, high juice pH (Conradie and Saayman 1989b). Low K supply results in poor vine growth, low yield, premature leaf fall, delayed ripening, and low fruit K concentrations and must pH (Conradie and Saayman 1989a, Kudo et al. 1998).
The sand culture method used to manipulate plant nutrient supply has been used extensively for many crops to define critical nutrient needs; for grapevines, this approach was used to understand the timing of nutrient uptake for various elements in Chenin blanc (Conradie 1980). However, use of full-strength Hoagland’s solution (~210 mg N/L; Hoagland and Arnon 1950) with Chenin blanc or frequent applications (four times daily from fruit set to harvest) of approximately half-strength level of N (~105 mg N/L) with Merlot has led to excessive N supply resulting in delayed ripening of fruit (Conradie 1980, Hilbert et al. 2003).
The main goal of this project was to better understand how limiting N, P, or K supply alters vine growth, physiology, and berry chemistry using a pot-in-pot system where nutrient inputs are controlled. A second goal was to develop leaf blade and petiole nutrient standards that are specific for Pinot noir grapevines grown in western Oregon. To address these concerns, the work presented here focuses on the impact of reduced N, P, and K supply on vine nutrient status (leaf blade and petiole tests), vine growth, photosynthetic parameters, yield, and juice nutrients in Pinot noir. The impact of nutrient supply on berry chemistry attributes from this trial (free amino acid, phenolic, and volatile profiles) will be presented in forthcoming articles.
Materials and Methods
Experimental design and vine management. Own-rooted Pinot noir grapevines (Vitis vinifera L. Pommard clone, FPS 91) were grown in large (60 L) pot-in-pot, microplots (Grip Lip 6900T, Nursery Supplies, McMinnville, OR), installed at the Oregon State University (OSU), Lewis Brown Research Farm, Corvallis, OR (44.553°N; 123.216°W). Pots were filled with coarse sand medium (Pre-Stress Sand Mix, Knife River, Corvallis, OR), and vines were planted in 2003. Available nutrients in the sand (mg/kg) and pH were determined using standard methods for western Oregon soils by the OSU Central Analytical Lab: 0.1 mg/kg NO3-N, 1.6 mg/kg NH4-N, 8 mg/kg P (Bray 1), 57 mg/kg K, 700 mg/kg Ca, 340 mg/kg Mg, 23 mg/kg Fe, 8.4 mg/kg Mn, 0.02 mg/kg B, 0.24 mg/kg Zn, 1.0 mg/kg Cu, and pH 6.5. Vines were spaced at 1.0 × 3.2 m and trained on a single Guyot system using vertical shoot-positioning. Head height of vines was set at 0.7 m aboveground and main shoots were trimmed 2 weeks after fruit set at a height of 2.7 m aboveground. From 2005 to 2008, vines were pruned to 9 buds plus one renewal spur, and later thinned to 7 shoots and a single renewal spur after threat of frost had passed. All vines received complete nutrient solution (half-strength Hoagland’s solution; Hoagland and Arnon 1950) for the first three years after planting (2003 to 2005), delivered through a drip-irrigation system three times per week from budbreak to veraison, and approximately two times per week from veraison to harvest. Vines received water on other days during the growing season.
Treatments with varying N, P, or K levels were applied to vines from 2006 to 2008. The concentrations of N, P, and K were each independently supplied at 50%, 20%, or 10% of the concentration used in the Control treatment. The Control treatment continued to receive a half-strength Hoagland’s solution. A total of 10 treatments were applied to 20 vines each in a randomized complete block design with four replicates in each treatment consisting of five continuous vines per plot (experimental unit). Treatments were designated as Control, 50%N, 20%N, 10%N, 50%P, 20%P, 10%P, 50%K, 20%K, and 10%K. Vines in the 50%N treatment received 50% of the concentration of N supplied to vines in the Control treatment, but all other nutrients (including P and K) were supplied at the same rate as the Control. In this way, only N supply was altered in the low N treatments, only P supply was altered in the low P treatments, and only K was altered in the low K treatments. N was supplied at 105 mg N/L in all years as KNO3 and Ca(NO3)2. P was supplied at 15.5 mg P/L in all years as KH2PO4. K was supplied at 117 mg K/L in 2006, 136 mg K/L in 2007, and 156 mg K/L in 2008. Rates of K were increased in 2007 and again in 2008 in an effort to boost K status of vines, since leaf blade and petiole K concentrations in the Control vines were below typical levels for the region (Schreiner et al. 2006, Sweet and Schreiner 2010). A complete set of 20 nonexperimental vines (four blocks of five vines each) were placed at the end of rows and received complete nutrition (same as Control). These nonexperimental vines were used to conduct in situ wilt tests (see below) to define target soil moisture levels without compromising the experimental vines.
Since the goal was for the Control vines to have a moderate nutrient supply to compare with reduced N, P, or K supply, all treatments received ~20% more fertilizer in 2008 than in prior years (Table 1). This adjustment was made because N, P, and K concentrations (leaf blade and petiole) in Control vines were approaching critically low values in 2007 based on known standards from other regions (Christensen et al. 1978, Robinson 2005).
Vine phenology, weather, and nutrient inputs (N, P, and K) for the full nutrition treatment (Control) applied to Pinot noir grapevines grown in sand culture, 2006–2008.
Fruit yield and quality were examined in 2007 and 2008 after sufficient vine training and fruit cropping level was attained. All fruit clusters were removed from the experimental vines on 12 Jul 2006 due to a combination of low fruit set in that year and an irrigation pump malfunction during a hot weather spell shortly thereafter that resulted in abscission of many berries on some vines. Since berry abscission was highly variable from vine to vine within the different experimental units, we removed all fruit clusters in 2006 to preserve the uniformity of vines for future years. Fruit clusters were thinned ~2 weeks after fruit set to an average of 1.5 clusters per shoot in 2007 and to 2.0 clusters per shoot in 2008, based on estimates at fruit set. Fungicides were used to manage powdery mildew (Erisiphe necator L.) and bunch rot (Botrytis cinerea L.) as per standard practices in the region (Skinkis et al. 2012).
Leaves in the cluster zone (nodes 2 to 6) were removed from the east side of canopy at lag phase in 2007 (23 Jul) and 2008 (4 Aug), as is the common practice in western Oregon. Immediately after this initial leaf pulling, solar exposure of fruit clusters was measured on cloudless days using a ceptometer (AccuPar, model PAR-80; Decagon Devices, Pullman, WA) held within the cluster zone of the canopy and corrected for ambient light interception with above canopy measures at each experimental unit at 10:00, 13:00, and 16:00 PST. Cluster exposure was assessed also by visually counting the number of clusters per vine that were fully shaded, partly exposed, or fully exposed to sunlight at 9:00, 11:00, 13:00, 15:00, and 17:00 PST. In order to eliminate indirect effects of nutrient supply on fruit development and composition that were driven by differences in fruit shading (Spayd et al. 2002), more lower canopy leaves from the east and west sides were removed from the more vigorous treatments until differences in fruit cluster light interception among treatments were no longer significant (p > 0.05).
Irrigation and soil water measurement and management. Vines were drip irrigated using four pressure-compensating emitters (1.9 L/hr) per microplot attached to a ring of spaghetti tubing to disperse water evenly throughout the pots. Irrigation inputs were managed based on volumetric soil water content (θv) and vine water status. The θv was measured by time domain reflectometry (TDR) (Soil Moisture Equipment, Santa Barbara, CA) using 45 cm steel waveguides (rods) installed vertically in each pot halfway between the vine trunk and the pot edge. One set of waveguides was installed in each replicate in the center vine in each plot.
Volumetric soil water content (θv) was monitored every one to three days during the summer months using TDR, and irrigation was applied whenever θv approached the target soil water content. The θv at field capacity and the permanent wilt point was previously determined at a bulk density of 1.45 g/cm3 with a psychrometer (model SC-10; Decagon Devices). The θv at field capacity was 17% and θv at the permanent wilt point (soil Ψ = −1.5 MPa) was 4.9%. In situ wilt tests were conducted on the 20 nonexperimental vines in the vineyard by withholding irrigation on two separate occasions in August 2005 and again on one day in August 2006. On all three occasions, vines showed visual signs of leaf wilt and minor berry shriveling whenever θv approached 7%, and Ψleaf values were ~−1.5 MPa (Figure 1). Depending on the daily weather, some degree of water stress (Ψleaf below −1.0 MPa) occurred when θv approached 11%. Moderate water stress, defined as Ψleaf between −1.0 and −1.3 MPa, and Gs values between 50 and 150 mmol/m2 •s (Lovisolo et al. 2010), typically occurred at θv between 8 and 11%. Vines were irrigated accordingly: before fruit set, irrigation was applied to maintain θv above 13%; from fruit set to veraison, vines were irrigated when θv was between 8 and 11% to help control canopy growth; and after veraison, vines were irrigated to maintain θv of ~11%. Irrigation was applied after 21:00 PST and rates were adjusted daily. There were a few occasions between fruit set and veraison when irrigation was applied in late afternoon if θv was below 9% or if vines showed visible wilt symptoms.

Relationship between midday leaf water potential (Ψleaf) and volumetric soil water content (θv) measured in situ by TDR. Symbols represent the mean value with standard errors for a given measurement date. Mean Ψleaf values were fitted to a three-parameter sigmoidal function (Gompertz) based on θv after adding 2 units to obtain positive values (r2 = 0.962, p < 0.001, n = 21). The dotted lines indicate 95% confidence intervals. Most data (12 of 21 dates) were collected in 2005 prior to applying different nutrient supply treatments, and the three points with Ψleaf values below −1.4 MPa were gathered from nonexperimental vines during wilt tests conducted in 2005 and 2006.
Nutrient status. Vine leaf blades and petioles were collected to determine nutrient status at bloom and at veraison. Ten leaves per plot were sampled from count shoots at both bloom and veraison. Opposite cluster leaves were collected at bloom and paired leaf samples comprising a leaf opposite a cluster and a recently expanded leaf were collected at veraison. Leaf blades and petioles were separated, rinsed in distilled water, dried at 70°C for 48 hr, and ground in a Wiley mill to pass through a 425-μm sieve. Nitrogen was determined via combustion analysis (LECO, St. Joseph, MI), and P, K, S, Ca, Mg, Mn, Cu, B, Zn, and Fe concentrations were measured by inductively coupled plasma-optical emission spectrometry (ICP-OES) (Optima 3000DV; Perkin Elmer, Wellesley, MA) after microwave digestion in HNO3 (Jones and Case 1990).
Leaf greenness (related to chlorophyll absorbance of red light) was measured on the same leaves used for nutrient assessment prior to their removal from vines using a SPAD-502 meter (Konica Minolta, Osaka, Japan). Three SPAD readings were made per sampled leaf avoiding major veins, and the average of 10 leaves was recorded per plot.
Vine growth. Shoot lengths were measured numerous times per season prior to hedging, with a measure taken close to 50% bloom every year. Randomly selected shoots (2 per vine on the three interior vines) were measured with a flexible tape measure in each plot. Leaf area of all leaves per sampled shoot was determined by comparison to series of concentric circles of known area. Leaf area per vine was calculated from the average area of these two shoots multiplied by the number of shoots per vine. Dormant season cane (or pruning) weights (fresh) from all vines were determined in the winter by weighing the count shoots from the previous season.
Vine water status and photosynthetic parameters. Midday leaf water potential (Ψleaf) was measured approximately every two weeks between fruit set and veraison using a pressure chamber (model 610; PMS Instrument Company, Albany, OR). A fully sun-exposed leaf was selected from the midcanopy within each plot and placed in a plastic bag prior to cutting the petiole with a razor blade. Leaves were measured within 1.5 hr of solar noon. Single leaf gas exchange was measured periodically in the summer months, only on cloudless days. Stomatal conductance (Gs) was determined with a porometer (model 1600; LI-COR, Lincoln, NE) measuring two leaves per plot or together with photosynthesis (A) using a portable infrared gas analyzer photosynthesis (IRGA) system (model 6400; LI-COR) measuring a single leaf per plot. For both types of measurements, only fully exposed leaves (PAR > 1700 μmol/m2 •s) in the lower or middle canopy were measured at bloom and postbloom, respectively. Measurements of gas exchange were made at various times during the day, but data collected within two hours of solar noon are shown. Predawn and midday quantum efficiency of photosystem II was determined on two leaves per plot using pulse-modulated chlorophyll fluorescence (FMS-2, Hansatech Instruments Ltd., Norfolk, UK).
Fruit yield, juice quality, and nutrient status. Fruit was harvested on 8 Oct 2007 and 17 Oct 2008 from all plots. The time of harvest was based on a random sampling of berries from all plots (3 berries/plot) when berries reached ~22 Brix. All fruit clusters were removed from each vine, counted, and weighed. The average cluster weight was calculated by dividing the total yield per vine by the number of clusters. A subsample consisting of five randomly selected clusters from each plot were juiced using a stainless-steel hand-crank press (625 mL/kg fresh weight of clusters). Fruit maturity indices (soluble solids, pH, and titratable acidity) were determined as previously described (Sweet and Schreiner 2010). Juice yeast assimilable nitrogen (YAN) was determined by summing primary amino acid-N obtained by HPLC analysis (Lee and Schreiner 2010) and ammonia-N by an enzymatic assay (Ammonia Assay Kit; Sigma Chemical, St. Louis, MO). Other mineral nutrient concentrations in juice (same as listed above for leaf blades and petioles) were measured by ICP-OES.
Statistical analysis. Data were analyzed by analysis of variance (ANOVA) or by Kruskal-Wallis (K–W) nonparametric ANOVA by ranks for those variables that could not be transformed to satisfy assumptions of ANOVA. Each variable was analyzed independently at a given sampling date using nutrient supply treatment as a factor. Whenever multiple subsample measures were recorded in an experimental plot, subsample measures were nested within nutrient supply treatment. Juice YAN, NH3−N, P, and B in 2007 were log transformed prior to analysis, and the inverse (1/x) was used for leaf blade P concentrations at bloom and veraison in 2007 and 2008. However, because so few data required transformations, we present the arithmetic mean and standard error of the mean for all data in figures and tables. Soil water content (θv) data (collected every 1 to 3 days) were analyzed immediately after each measurement to determine if adjustments to water inputs were needed. Means were compared using Tukey’s post-hoc test whenever ANOVA was used or by K–W multicomparison test. Statistica software (ver. 8.0; Statsoft, Tulsa, OK) was used for all analysis, and effects were considered significant at 95% confidence (p ≤ 0.05).
Results
Weather, phenology, and soil moisture. Weather patterns during the years of this study varied, resulting in differences in the timing of vine development (Table 1). The 2006 season was one of the warmest in the past 25 years (Schreiner et al. 2012). Vines reached veraison a few days earlier in 2006 compared to 2007, and fruit retained on the nonexperimental vines in 2006 were harvested about one week earlier in 2006 compared to 2007. Even though 2007 was cooler than 2006, warmer temperatures in early spring resulted in an earlier budbreak in 2007. The 2008 season was cool prior to budbreak and throughout the growing season, resulting in delayed vine development for all growth stages compared to previous years. Veraison and harvest occurred about two weeks later in 2008 compared to 2006.
Soil water content (θv) was measured a total of 45 days in 2006, 52 days in 2007, and 57 days in 2008 between budbreak and harvest (Table 2). Nutrient supply treatment affected θv only on two days in 2007 and on four days in 2008 (p ≤ 0.05). For example, θv in the 20%N (14.6 ± 0.6) and 10%N (14.4 ± 1.4) treatments was greater than the Control (10.5 ± 0.7) and 10%K (10.3 ± 0.6) treatments on 18 Sep 2007. In all cases in 2007 and 2008 when θv had differed, measurements taken on the following day (after adjusting irrigation inputs) showed that θv was no longer affected (p > 0.05) by treatment (data not shown). Therefore, vines in the different treatments only experienced a few transitory differences in soil water supply throughout the experiment. The number of days that θv was below 11% or 10% in each year were similar and were not altered by treatment.
Summary of soil water content (SWC) data using TDR for Pinot noir grapevines grown in sand culture 2006–2008. Mean SWC represents data pooled from all treatments (n = 40).
Vine nutrient status. The N, P, and K supply treatments affected leaf blade and petiole nutrients in 2006, but effects were mainly significant for N and P concentrations at bloom and veraison (see Supplemental Table 1 for p values at bloom and veraison, 2006–2008). Veraison S and Mn concentrations were the only other nutrients altered in 2006. Differences in N and P concentrations in leaf blades and petioles were observed through 2007 and 2008. K concentrations in leaf blades and petioles were not altered in 2006, but effects on K status became apparent in 2007 and 2008, primarily in petioles. N, P, and K supply also consistently altered leaf blade or petiole S, Mn, and B concentrations. The impact on Mn and B occurred at bloom and veraison in both blades and petioles in 2007 and 2008, while impacts on S predominantly occurred at veraison in each year.
The nutrient supply treatments had the largest impact on N and P status of vines. Reducing N supply resulted in significant declines in both leaf blade and petiole N concentrations by bloom of 2006 (Figure 2A). By 2008, each of the low N treatments resulted in progressively lower leaf blade N concentrations, but petiole N concentrations did not differ among the three low N supply rates. Low P and low K supply treatments did not alter leaf blade or petiole N concentrations in any year. Effects of N supply on vine N status at veraison were similar to what was observed at bloom, such that leaf blades showed larger declines in N concentrations as N supply decreased as compared to petioles (see Supplemental Figure 1 for leaf blade and petiole N, P, and K at veraison, 2006–2008). The low N supply vines were visually different from the other treatments as early as mid-July in 2007, and vines in the 10%N and 20%N treatments had more yellow-green leaves than other treatments by veraison in 2007. By 2008, vines in these same low N treatments were visibly less green even prior to bloom.

Effect of N, P, and K supply on leaf blade and petiole N (panel A), P (panel B), and K (panel C) concentrations at bloom in Pinot noir grapevines grown in sand over three years, 2006–2008. Means (SE) are presented, and letters above bars indicate significant differences between treatments for leaf and petiole within each year based on Tukey’s HSD at 95% confidence.
Petiole P concentrations were affected by treatment at bloom in 2006, and both leaf blade and petiole P were affected by veraison in 2006, although no treatments differed from the Control at bloom (Figure 2B) or veraison. Differences in P status in 2006 were the result of the low N supply vines having higher leaf blade or petiole P concentrations than the low P supply vines. By bloom 2007, the low N vines had higher P concentrations in both leaf blades and petioles than the Control, and the low P vines had lower P concentrations in both leaf blades and petioles than Control (Figure 2B). Effects on P status were less pronounced at veraison in 2007, with only petiole P being higher than the Control treatment in all the low N vines, while leaf blade P was lower only in the 10%P vines. The increase in P status in low N vines and decrease in the low P vines was more pronounced in 2008. Low K supply (10%K and 20%K) increased leaf blade P concentrations (but not petiole) at bloom in 2008 only. Similar to 2007, the differences in P status due to low N or low P supply were more apparent at bloom than at veraison in 2008. Visual P deficiency symptoms on leaves (interveinal reddening at leaf margins or smaller darker green leaves) were not observed, nor were any other visual differences apparent in the low P supply vines compared to Controls throughout the study.
Effects of nutrient supply on vine K status of leaf blades or petioles were less pronounced than effects on N and P and were inconsistent. Low K supply reduced petiole K concentrations at bloom in 2007 and 2008 compared to Control vines, but leaf blades did not differ (Figure 2C). Effects on K status at veraison were similar to effects at bloom. K concentrations in petioles at bloom were also reduced in low N treatments in 2007, but that was not repeated in 2008. K concentrations in leaf blades and petioles were generally low across all treatments in 2006 and 2007 compared to typical values (leaf blade ~10 g K/kg, petiole ~20 g K/kg) for the region (Schreiner et al. 2006, Sweet and Schreiner 2010), which is why we increased K supply uniformly across all treatments in 2007 and 2008. This additional K did not improve K status until veraison of 2008, when petiole K in the Control vines was increased from 12 to 14 g K/kg in 2006 and 2007 to ~20 g K/kg in 2008. No visual symptoms on leaves could be discerned in the low K supply vines at any time throughout this study.
Data from 2008 leaf blades illustrate the impact of reduced N, P, and K supply on the other important plant nutrients that were held at constant supply. Differences in these other mineral nutrients in leaf blades and petioles were largely associated with the low N treatments (Table 3). Low N supply resulted in higher leaf blade Ca concentrations at bloom and higher leaf blade Mg, Mn, and B concentrations, but lower leaf blade C concentrations at both bloom and veraison. Similar differences were observed in 2007 (data not shown). Low P and low K supply treatments had higher leaf blade S concentrations at veraison in 2008.
Effect of N, P, and K supply on concentrations of other nutrients in Pinot noir leaf blades at bloom and veraison in 2008. Mean values for each nutrient treatment (n = 4) are presented.
Leaf SPAD measurements at bloom and veraison were highly correlated (p < 0.001) to leaf blade N concentrations at each sampling date (data not shown). Leaf SPAD readings were lower at both bloom and veraison in 2006 in 10%N and 20%N treatments than in Control vines, and in all three low N rates (50% 20% 10%) in 2007 and 2008 (see Supplemental Table 2 for the impact of N, P, and K supply on SPAD readings, 2006–2008). Differences in SPAD readings among the three low N supply treatments were not separated clearly as were differences in leaf blade N concentrations in 2007 and 2008. By bloom 2008 when leaf blade N concentrations were sequentially reduced with reduction in N supply (Control >50%N >20%N >10%N), SPAD was similar in the 50%N and 20%N vines, and in the 20%N and 10%N vines.
Vine growth. Shoot length near bloom was unaffected by N, P, or K supply treatments until 2008 (Table 4), when shoot growth was reduced in all three low N supply vines compared to the Control. No other treatments altered early season shoot growth. Leaf area at bloom was likewise not altered by treatments until 2008, when leaf area was reduced in all three low N treatments with no effects due to low P and low K supply. Shortly before veraison in 2007 when visual differences in leaf color were observed in the low N vines, leaf area was not yet altered by treatment (p = 0.083; data not shown). Dormant season pruning weights were altered only by low N supply, and differences were apparent in 2006 and became greater by 2008 (Table 5).
Impact of N, P, and K supply on shoot growth and leaf area near bloom for Pinot noir grapevines grown in sand culture in 2008. Means (SE) of two randomly selected shoots on each of three interior vines per replicate (six subsample measures) in four replicates.
Impact of N, P, and K supply on dormant season pruning weights for Pinot noir grapevines grown in sand culture 2006–2008. Means (SE) of three interior vines per replicate (three subsample measures) in four replicates are presented.
Vine physiology. Effects of nutrient supply on vine physiology measures examined here were not apparent until 2008. The rate of single leaf photosynthesis (A) was reduced only in 2008 in the 10%N and 20%N treatments and was not affected by low P or K supply (Table 6). Reduced A in these low N vines occurred both at bloom and at veraison in 2008. However, stomatal conductance to water vapor (Gs) was not altered at either time in 2008, indicating that the low N vines kept stomates proportionally more open in an effort to maximize A. Internal leaf CO2 concentrations (Ci) and single leaf water use efficiency (mmol CO2 fixed/mol H2O transpired) were higher and lower (p < 0.05), respectively, in the 10%N vine leaves compared to the Control treatment at bloom in 2008 (data not shown). Chlorophyll fluorescence parameters measured in mid-July of each year were affected also by the two lowest N supply treatments in 2008 (see Supplemental Table 3 for the impact of N, P, and K supply on midsummer quantum efficiency of photosystem II, 2008). Maximal quantum efficiency was also lower (p = 0.003) in leaves of 10%N vines (0.806) compared to the Control (0.833) shortly after veraison in 2007, but midday values were not different at that time (data not shown). Midday leaf water potential (Ψleaf) measured periodically each year, with focus on very warm days, did not differ among treatments at any time (data not shown). The Ψleaf was not measured on any of the six days where θv had differed among treatments, so direct relationships cannot be ascertained.
Impact of N, P, and K supply on single leaf photosynthesis (A) and stomatal conductance to water vapor (Gs) of Pinot noir grapevines grown in sand culture in 2008. Means (SE) of four replicates are presented.
Fruit yield and juice quality. Fruit yield and berry parameters were not affected by any treatment in 2007, but yield, average cluster weights, and berry weights were reduced by all three low N treatments in 2008 (Table 7). In addition, cluster weights were reduced in the 10%P supply vines in 2008 only, although overall yield and berry weights were not affected. Berry number per cluster was not altered by nutrient supply treatment in either year. Percent soluble solids, pH, and titratable acids in juice were not altered in 2007, but soluble solids were higher in the low N (50%, 20%, and 10%) treatments and in the 50%K supply treatment in 2008, and pH was lower in the two lowest K (10%K and 20%K) treatments in 2008.
Impact of N, P, and K supply on yield and juice parameters for Pinot noir grapevines grown in sand culture in 2008. Means (SE) of two vine subsample measures in four replicates are presented.
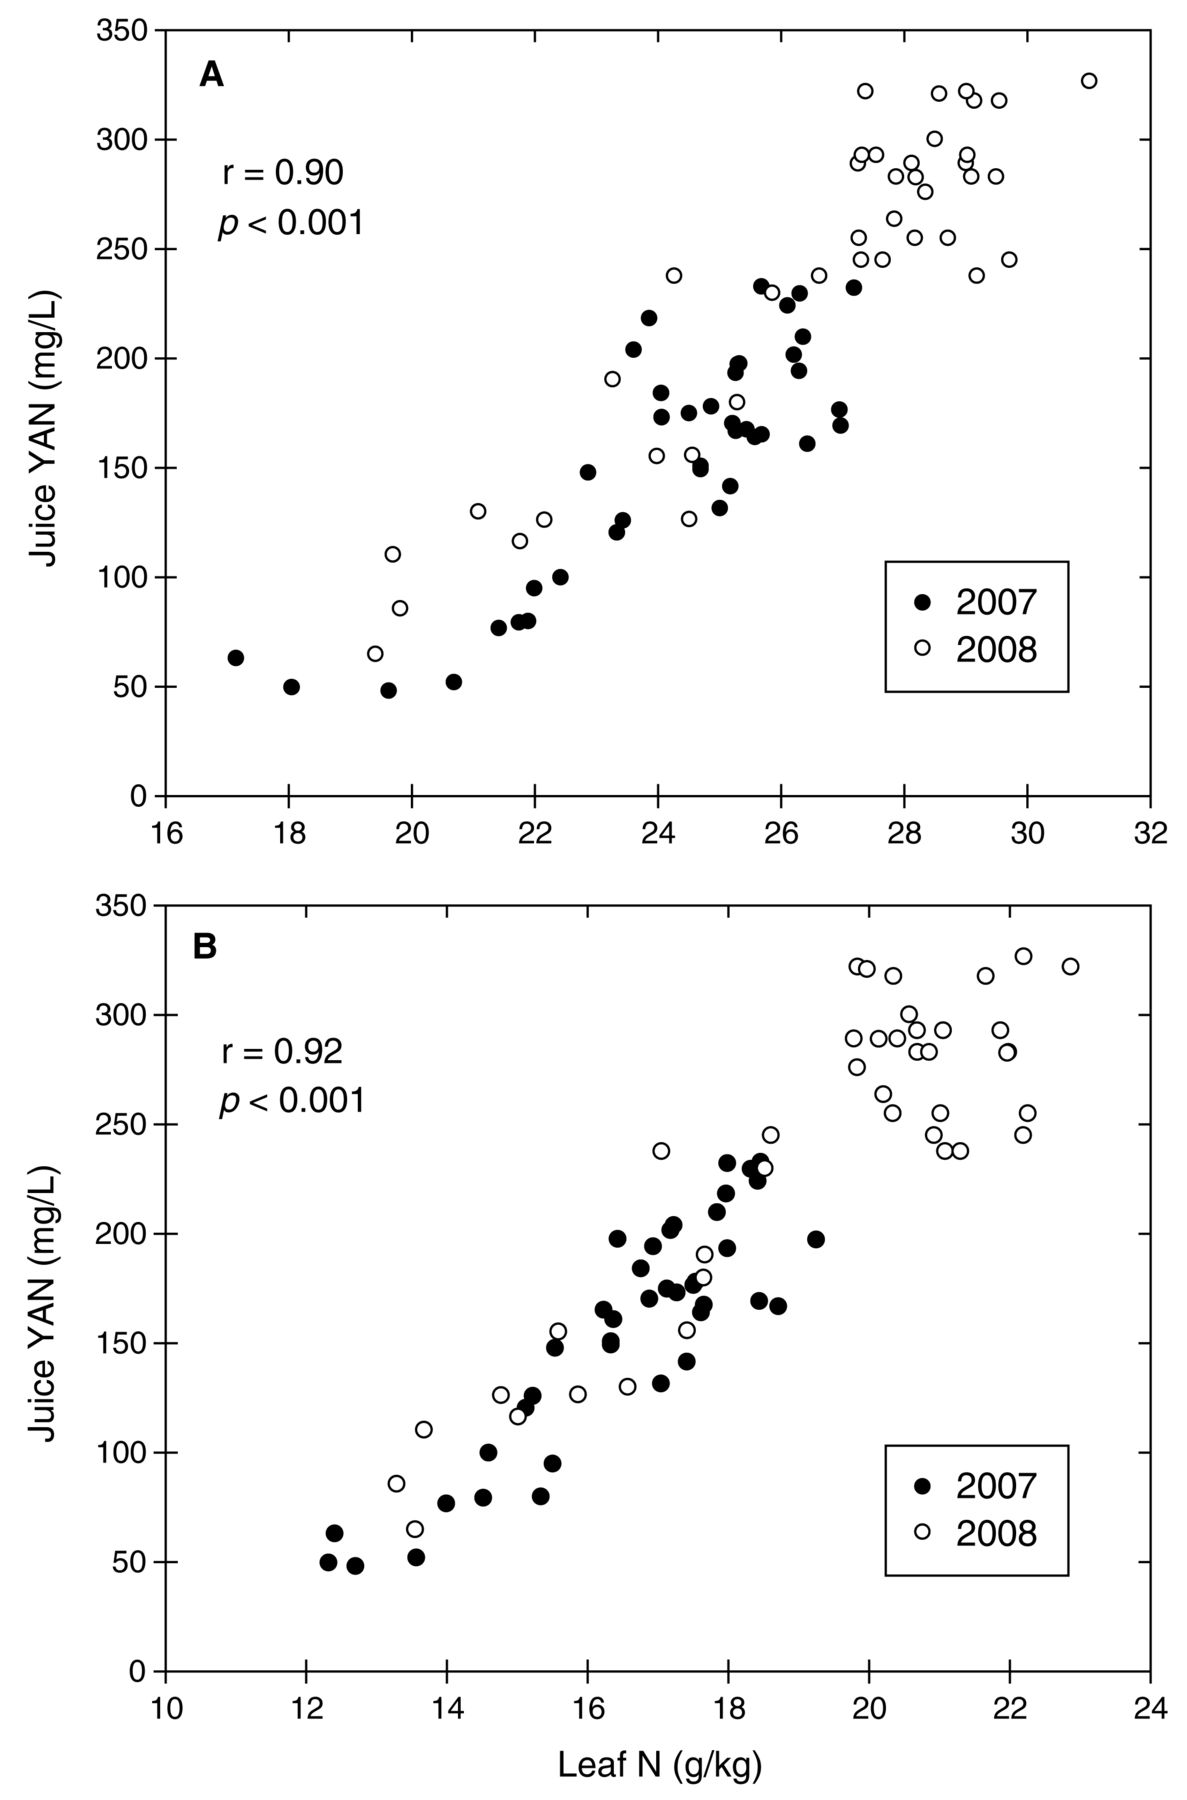
Nutrient supply treatments altered juice nutrients in both years, and effects were most pronounced for N and P concentrations (Table 8). YAN and ammonia-N concentrations in juice were reduced in the 20%N and 10%N treatments in both years, and YAN was also reduced in the 50%N treatment in 2008. Juice YAN was highly correlated to leaf blade N concentration at both bloom and veraison (Figure 3). Leaf blade N was the best predictor of juice YAN of any variables measured, and this linear relationship was similar between years. Petiole N concentration at bloom and veraison was also highly correlated to YAN (p < 0.001), but correlation coefficients (r) were below 0.8. Juice P concentrations were also reduced by the low P treatments in both years, while juice P was higher than Control vines in the low N vines in 2008 only (Table 8). Juice K was not altered by any treatments. The only other nutrient in juice that showed a consistent effect in both years was B, which was at a higher concentration in the 10%N vines. Nearly all juice nutrients were at higher concentrations in 2008, owing to the more frequent application of nutrients to vines across all treatments in 2008 (Table 1) and possibly also seasonal differences in weather.
Impact of N, P, and K supply on juice nutrient concentrations in Pinot noir grapevines grown in sand culture 2007–2008. Means (SE) of two vine subsample measures in four replicates are presented.

Relationship between juice YAN at harvest and leaf N status at (A) bloom and (B) veraison in Pinot noir grapevines grown in sand in 2007 and 2008. Linear correlation coefficient (r) based on combined years.
Discussion
The salient finding from this study was that limited N supply to Pinot noir reduced growth, yield, and photosynthesis, while the low P and low K treatments had little effect on these parameters. The low nutrient treatments reduced N, P, and K status of vines assessed in either leaves or petioles as intended, although effects of low N supply occurred earlier and were of greater magnitude than either low P or low K treatments. The impact of low N supply on vines was visually apparent (leaves less green) by midsummer of the second growing season (2007) and throughout the entire third year (2008). Low P and low K supply did not result in any visual differences in leaves or fruit clusters of vines at any time throughout the study. Even though visual impact of low N supply on vines was observed by midsummer in 2007, measures of shoot length and leaf area were not different until 2008. However, pruning weights were reduced by low N supply in all years. Since dormant pruning weights represent an integrated measure of whole season shoot growth, it is expected that low N altered pruning weights before instantaneous measures of shoot growth were realized. Pruning weights are often a more sensitive indicator of vine growth compared to shoot length (Kliewer et al. 1991, Schreiner et al. 2012). Nevertheless, it was expected that differences would be observed for shoot growth and leaf area in the low N vines prior to year three, given the well-known effects of low N on vine growth (Bell and Robson 1999). The removal of fruit in 2006 may have reduced the possibility of obtaining shoot growth and leaf area differences in the earlier years of the study.
Juice YAN was reduced in the 20%N and 10%N treatments compared to the Control in both 2007 and 2008, yet yield was not affected by low N supply until 2008. Yield was strongly suppressed in 2008 in all the low N treatments with reductions of 48% in the 50%N vines and 66% in the 20%N and 10%N vines. Leaf blade and petiole N concentrations in the 10%N and 20%N vines were similar at bloom in 2007 and 2008, suggesting that the yield reduction that occurred in 2008 resulted from a cumulative effect of low N status over multiple years. The reduction in yield with low N supply was due to reduced berry size and was not related to berry number per cluster. Bell et al. (1979) observed a reduction in berry weight without an effect on berry number similar to our findings. However, in most cases where N additions have increased yields, both berry number per cluster and berry weights were increased (Kliewer et al. 1991). Berry number has also been altered by N supply without an increase in berry weights (Bell and Robson 1999).
The smaller berries produced in the low N vines may be desirable for winemakers, since the skin to pulp ratio is increased, often resulting in higher concentrations of pigments and volatiles in juice (99Peyrot des Gachons et al. 2005). Indeed, berries from the 10%N and 20%N vines had higher (p < 0.05) concentrations of anthocyanins and monoterpenes in 2008, but that did not occur in 2007 (data not shown). These results suggest that low N supply is not a viable option to further improve berry secondary metabolites beyond the moderate N supply rate (Bell and Henschke 2005) that occurred in our Control vines, as large yield declines occurred simultaneously.
Juice YAN concentrations were highly correlated to leaf blade N concentrations at bloom and at veraison in both years (Figure 3). These findings suggest that basing leaf blade N standards on desired juice YAN levels may be warranted. Since juice YAN values were reduced by low N supply one year before yield or current season shoot growth was altered by low N supply, it appears that juice YAN is an excellent indicator of early vine N stress. Based on obtaining juice YAN levels of 140 mg N/L (Bely et al. 1990), the Pinot noir vines in this study indicate that critical leaf blade N values at bloom should be 23 g N/kg and veraison leaf blade N values should be 16 g N/kg. If producers want to obtain ~200 mg N/L YAN levels, which may be a more appropriate target for juice YAN, then leaf blade N concentrations at bloom should be 25 to 26 g N/kg and leaf blade N at veraison should be 18 to 19 g N/kg. Petiole N values did not change as greatly as leaf blade N values, nor were they as closely correlated to juice YAN concentrations as leaf blade N concentrations. Therefore, it is recommended that leaf blade N values be used rather than petiole values for establishing vine N status.
The yield response observed here in Pinot noir supports the use of a critical leaf blade N value that equates to obtaining YAN levels of ~200 mg N/L. In 2008, yield was reduced in the 50%N supply vines, but leaf blade N at bloom was 25 g N/kg. However, in 2007, leaf blade N in the 50%N vines at bloom was 23.5 g N/kg and yield was not yet reduced, indicating that two consecutive years with bloom leaf blade N values between 23.5 and 25 g N/kg were required to reduce yield. Other treatments including the Control had bloom leaf blade N values just above 25 g N/kg in 2007 and ~28 g N/kg in 2008 with no yield reduction. From this work, it is suggested that bloom leaf blade N levels of 25 g N/kg are critical for maintaining typical yields in the region. Most vineyards in the Willamette Valley have leaf blade N concentrations >25 g N/kg at bloom (Schreiner et al. 2006), so further N additions are typically not warranted. However, this information may be critical for helping lower vigor vineyards in the region obtain higher production or quality goals.
Vegetative growth is also important in defining vine tissue N standards. Practices to reduce N supply to vines to control excessive canopy growth, such as competition with alleyway vegetation or reduced rates of N fertilization, is often a goal in the Willamette Valley. Pruning weights were reduced by 28% in 2006 in the 10%N and 20%N treatments when bloom leaf blade N was 25 g N/kg, compared to 29 g N/kg for Control vines. In 2007, pruning weights were reduced again by ~28% in the 10%N and 20%N treatments with bloom leaf blade N concentrations of 20 to 21 g N/kg, while the 50%N treatment had a concentration of 24 g N/kg with no reduction in pruning weights. By 2008, pruning weights in the 10%N and 20%N treatments were reduced by ~40%, with bloom leaf blade N values of 20 to 23 g N/kg, and prune weights in the 50%N vines were reduced by 28%, with bloom leaf blade N of 25 g N/kg. These results show there is variability in vine N status that results in reduced vine growth from year to year, and a cumulative effect of low N status.
By incorporating vegetative growth, yield, and juice YAN responses to low N supply from this trial, it is suggested that critical levels of leaf blade N for Pinot noir grown in the region should be 25 g N/kg at bloom and 18 g N/kg at veraison. The corresponding values for petiole N concentrations are 8.0 g N/kg at bloom and 4.0 g N/kg at veraison. These values closely agree with the findings from N fertilizer trials based on Riesling yields over 15 years (Linsenmeier et al. 2008) and yields of Heroldrebe and Bukettraube varieties over 9 years (Conradie 2001). Our bloom leaf blade N value of 25 g N/kg also equates to leaf blade guidelines from Australia (Robinson 2005), although our proposed veraison value of 18 g N/kg is slightly higher than the same guidelines. In general, our proposed leaf blade N values are higher than most critical values reported for grapes, which is somewhat surprising given the low yields typically produced in the region. Tissue N concentrations that equate to yield, growth, or YAN declines are known to vary among grape cultivars and even within the same cultivar grown in different regions (Conradie 2001). Therefore, guidelines need to be defined for the primary cultivars grown within a given region.
The fact that single leaf photosynthesis rates were not altered by low N supply until 2008, even though leaf blade N concentrations were similar in the lowest N supply vines (10%N and 20%N) in 2007, suggests that the lowest N concentrations in leaves observed here (~14 g N/kg) were above the limiting level needed for high rates of CO2 fixation in Pinot noir. This finding agrees with previous results in relation to leaf blade N limitation on photosynthesis (Poni et al. 1994). Our results indicate that rates of photosynthesis in the low N supply treatments were limited by available sink strength of the vines (Quereix et al. 2001), as there was a simultaneous reduction in yield in 2008. Therefore, basing leaf tissue N guidelines on photosynthetic capacity of leaves is not warranted. Of course, whole vine photosynthesis was likely reduced in the low N treatments in 2008, since leaf area was reduced in that year.
It is difficult to define critical values for P and K in leaf blades or petioles based on this trial. Neither low P nor low K treatments depressed yield or growth of vines, nor were any visual symptoms of low P or K observed on leaves or clusters of Pinot noir. The concentrations of both P and K in leaf blades or petioles were low compared to commercial vineyards in western Oregon (Schreiner et al. 2006, Sweet and Schreiner 2010) and low also in relation to leaf blade and petiole guidelines from other regions (Christensen et al. 1978, Robinson 2005). However, low P treatments reduced juice P concentrations by up to 60% in both 2007 and 2008, with values as low as 50 mg P/L. Juice P concentrations that are needed for healthy fermentations are not clearly defined (Bisson 1999, Bell and Henschke 2005). Archer and Caster (1956) showed that yeasts removed between 200 and 250 mg P/L of must during fermentations over a broad range of initial P concentrations, but it is unclear if the P removed from solution was actually utilized by yeast or stored as polyphosphates. Optimum P concentrations for yeast growth in general are reported to be 62 to 124 mg P/L (Jones and Gadd 1990). Therefore, a conservative estimate of minimum P levels needed in juice to prevent sluggish fermentations would be ~100 mg P/L. All three low P supply treatments were at or below a juice concentration of 75 mg P/L in both 2007 and 2008 and likely deficient in P. The bloom leaf blade P concentrations in the low P vines were 1.8 g P/kg in 2007 and 1.5 g P/kg in 2008, while veraison concentrations were at or slightly below 1.0 g P/kg in both years. The other treatments with moderate P supply had juice concentrations of ~100 mg P/L in 2007 and well above that level in 2008. The lowest bloom P level in leaf blades and petioles among these vines was 2.3 g P/kg in the 2007 Control treatment. These results suggest a critical value of 2.3 g P/kg for bloom leaf blades in Pinot noir. This value is slightly higher than critical P levels reported from other grapegrowing regions (Christensen et al. 1978, Robinson 2005).
Cook et al. (1983) observed clear P deficiency symptoms and arrested growth of Chenin blanc vines when midsummer leaf blade P was 1.1 g P/kg and petiole P was 0.4 g P/kg. Pinot noir cuttings grown in a low P soil without mycorrhizae were completely stunted when leaf blade P was 0.8 g P/kg and petiole P was 0.5 g P/kg (Schreiner 2007). Pinot noir vines in this study did not develop deficiency symptoms or show reduced growth even with leaf blade values as low as 0.8 g P/kg and petiole values of ~0.2 mg P/kg, which occurred at veraison in 2008. These findings indicate that scouting for visual symptoms of P deficiency as a method to monitor vine P status for Pinot noir in the field is not reliable.
The 10%P supply treatment reduced cluster weights in 2008 due to either reduced flower number or fruit set, which appears to be a more sensitive indictor of P stress than vegetative growth in grapevines (Skinner and Matthews 1989). P concentrations in leaf blades and petioles in the 10%P vines at bloom in 2008 were the lowest of any values in our bloom-time data (leaf blade was 1.41 g P/kg, petiole was 0.73 g P/kg). Current work is being conducted to clarify Pinot noir responses to low P in relationship to flower development and fruit set.
Some research suggests that the ratio of petiole P to leaf blade P concentrations is indicative of vine P status, since P can accumulate in petioles as P supply increases (Klein et al. 2000). Results of this study do not support this ratio relationship for Pinot noir, as many of the treatments with ample P supply had higher leaf blade P concentrations than petiole P concentrations at various times and vice versa.
Results of low K treatments indicated that K supply was adequate even in our lowest K supply treatment, and K status was suitable for Pinot noir producing low yields typical for the region. Besides reducing K concentrations in petioles in 2007 and 2008, low K supply only altered juice pH in 2008 in the 10%K and 20%K treatments. No other vine parameters were altered by low K supply. Juice pH was lower in the 10%K and 20%K vines in 2008, yet juice K concentrations were not lower. The levels of K in all juice samples were above a critical level required by yeasts to complete healthy fermentations, since all of our juice K concentrations were >500 mg K/L (Kudo et al. 1998), but this requirement depends on must pH, N source, and so on (Kudo et al. 1998, Hess et al. 2006).
The lack of K deficiency symptoms observed on leaves and the lack of effect on rates of photosynthesis on low K vines here support previous findings in winegrapes (Christensen 1984, Poni et al. 2003), where such responses to low K became apparent when leaf blade values of K were below ~4.0 g K/kg. It is likely that the critical values for vine K status in Pinot noir produced at relatively low yields will be lower compared to other cultivars and regions where yields are greater (Christensen 1984, Klein et al. 2000). Petioles were much more responsive to changes in K supply than were leaf blades in this study, which is well known (Christensen et al. 1978, Christensen 1984, Robinson 2005). Since most Willamette Valley vineyards have higher K concentrations in leaf blades and petioles than found here (Schreiner et al. 2006, Sweet and Schreiner 2010), K additions to vineyards in the region are likely not warranted.
The effects of low N, P, and K supply in this study on the status of other nutrients in leaf blades and petioles were associated primarily with N supply. Low N supply vastly increased P concentrations in both leaf blades and petioles beginning in 2007, which we attribute primarily to enhanced root activity and/or root growth by vines under N stress (Grechi et al. 2007), since P concentrations had increased before differences in shoot growth or leaf area had occurred. The subsequent reduction of vine growth under low N supply probably also contributed to the higher P status by reducing the amount of growth-induced nutrient dilution. Low N supply also resulted in increased levels of Ca, Mg, Mn, and B in Pinot noir leaf blades. Interestingly, low N supply had the opposite effect on K status, decreasing K concentrations in leaf blades and petioles, particularly in 2007. Low P supply did not influence vine N status and had only a minor impact on vine K status. Similarly, low K supply did not influence vine N status, but had a minor influence on vine P status. Antagonism between P and K supply has been observed in previous vineyard fertilizer trials (Conradie and Saayman 1989b).
Conclusions
Results obtained here by growing grapevines in a pot-in-pot system under field conditions with low N, P, and K supply provide a basis to refine critical values for Pinot noir leaf blade N in western Oregon. Critical values for P and K status could not be clearly identified here. Leaf blade N values of 25 g N/kg at bloom and 1.8 g N/kg at veraison were required to maintain yield and provide adequate YAN in berries. Leaf blade P values of 2.3 g P/kg at bloom appear to be required to provide juice P concentrations of ~100 mg P/L. Leaf blades were better indicators than petioles for N and P status, while petioles were a better indicator for K status. Visual symptoms of low N and low P levels in Pinot noir leaves, and instantaneous vine growth and physiological responses were not reliable indicators of potential deficiencies of N or P.
Acknowledgments
This project was funded in part by the Northwest Center for Small Fruits Research and by USDA-ARS CRIS project 5358-12210-003D and 5358-21000-041-00D. The authors thank Matthew Scott, Timothy Nam, John Carter, Scott Robbins, and Chris Rennaker for technical assistance.
Footnotes
-
Supplemental data is freely available with the online version of this article.
-
Publication costs of this article defrayed in part by page fees.
- Received April 2012.
- Revision received October 2012.
- Accepted October 2012.
- Published online December 1969
- ©2013 by the American Society for Enology and Viticulture
Literature Cited
Vol 64 Issue 1


Jump to section
Related Articles
Cited By...
More from this TOC section
Similar Articles
