


Abstract
Four grapevine training systems (single curtain, vertical shoot-positioned, high bush, and short bush) were compared for their effects on physiological performance, yield, vegetative growth, and must composition in Vitis vinifera L. cv. Tempranillo in Mediterranean weather conditions. Net CO2 assimilation rate, stomatal conductance, and transpiration rate were measured at the beginning of bunch closure, veraison, and maturity on fully exposed leaves. At each stage, changes in these values were measured in the morning, at midday, and in the afternoon. Differences in individual leaf responses among treatments were the result of photosynthetically active radiation levels on the outer leaves. Fully exposed leaves of the bush-trained vines had the highest stomatal conductance and transpiration rates and those of the high-bush vines had the highest photosynthetic rates. Grape yield results showed that the vertical shoot-positioned system was the most productive, adjusted for its greater pruning level. Although acceptable grape quality was obtained with all four systems, single curtain and high bush had greater total soluble solids at the expense of lower grape yield.
The production potential of a vineyard depends upon its training system. Differences in exposed canopy surface area, spatial distribution of leaves, ratio of adult to young leaves, and canopy management cause unique interactions between the leaf canopy and the surrounding environment. These interactions imply a specific physiological response by leaves to environmental conditions. Leaf function is thus a result of both immediate conditions and conditions during growth and expansion.
As the overall physiological effects of a training system depend on specific meso- and microclimatic conditions, it is difficult to extrapolate results to other growing areas. Even so, the principles regulating vine performance remain the same. In general, the best response is achieved by a training system that exposes the greatest leaf surface area during optimum environmental conditions for photosynthetic activity. Intrieri et al. (1998) did not find differences in total canopy assimilation between north-south and east-west orientated potted vines, but did find differences in vine performance—total canopy assimilation and water use efficiency—between same-orientated potted and field-grown vines, noting that vine response to a given orientation also depended on Ravaz index, canopy density, and growing conditions.
Knowledge of how grapevines respond to different training systems will result in a better control of yield, vegetative growth, and must composition. It will also help determine whether problems affecting a vineyard arise from the vineyard structure itself or from temporary variations in weather conditions, which call for actions such as thinning leaves, grape clusters, or shoots.
Shaulis et al. (1966) sought a solution to the problem of low yields in Concord grapes. Based on preliminary studies of the physiological response of vine leaves and buds to environmental conditions, the authors developed a training system in which vines were completely inverted, placing the fruiting zone in the top of the canopy. Moreover, they approached the problem on the scale not of a single bud or plant but of the crop as a whole.
The objective of the experiment described here was to compare the physiological and agronomic response of Tempranillo grapevines to four vineyard training systems over an entire growing season and to establish the factors influencing the performance of each system.
Materials and Methods
Experimental design.
The experiment was conducted during the 1990, 1991, and 1992 growing seasons using 10-year-old Tempranillo grapevines (Vitis vinifera L.) grafted onto 110R rootstock. Physiological data were collected throughout the 1992 growing season. The vineyard was located in Madrid (lat. 40°26′36′N; long. 03°44′18′W) at an altitude of 595 m.
Water requirements were calculated weekly using a type A pan evaporator installed near the experimental plot. Weather data were obtained from an automated weather station located about 50 meters from the experimental vineyard. All measurements were performed on well-watered plants, and predawn leaf water potential values were greater than −0.2 MPa throughout the growing season. The weekly volume of irrigation water to be applied (R) was calculated each week according to the previous week’s total reference crop evapotranspiration (ET0) and effective precipitation using the following equation:

where kc = 0.6 is a constant crop coefficient, Pe is effective precipitation, and 0.9 is the efficiency coefficient of the irrigation system. The value of the constant crop coefficient was established taking into account previous studies of similar environmental conditions (Bravdo et al. 1984, Intrieri 1981), ensuring that water was not limited for any treatment.
Rainfall and the irrigation schedule for the three growing seasons are shown in Table 1⇓. Each plant was irrigated with an autocompensating drip emitter of 3.75 L per hour. The calculated volumes of irrigation water for each week were applied regularly from Monday to Friday in irrigations of three to four hours each.
Rainfall and irrigation schedule for three-year study of Vitis vinifera L. cv. Tempranillo training systems, Madrid, Spain, 1990 to 1992.
Soil management consisted of chemical “mowing” techniques in and between rows. A residual herbicide was applied in early spring and after two months a glyphosate was locally applied where the grass had grown. Various degrees of shoot positioning and trimming were required in all treatments to retain the shape of the canopy. Vineyard management was otherwise conducted according to commercial practices. Soil properties were determined through chemical analysis and texture study on two randomly sampled points along the alleys. Soil was uniform over the entire experimental plot, with a water availability of 131 mm/m, calculated as the difference between soil water content at field capacity (−0.1 bar) and at wilting point (−15 bar) determined with a Richard’s membrane. There were no physical or chemical constraints or gradients conducive or adverse to a particular training system.
Experimental treatments.
Four training systems with different vine spacing and pruning level were used (Figure 1⇓, Tables 2⇓, 6⇓): (1) single curtain: unilateral 2-bud spur-pruned cordon-trained at 1.6 m aboveground, with free hanging shoots hand-positioned downward during flowering; (2) vertical shoot-positioned (VSP): two 12-bud canes and two 2-bud spurs retained on double-Guyot pruned vines, with shoots in an upright position; (3) high bush: trunk 0.6 m in height, seven or eight arms bearing a total of 13 or 14 2-bud spurs, with shoots drooping downward, yielding a semispherical canopy shape; and (4) short bush: trunk 0.2 m in height with eight or nine spurs onto a head, with trailing shoots.
Vine spacing and surface area in four training systems, 1992.

Schematics of four training systems (H: canopy height; P: external leaf surface perimeter; W: canopy width; R: radius; D: diameter).
The goal was to optimize each training system so that seasonal shoot number per vine varied with the shoot vigor and fertility observed during shoot thinning, which occurred in mid-May. The yield to pruning weight ratio obtained the previous season was also taken into account. All rows were orientated north-south.
Data analysis.
Each treatment consisted of four replicates of seven vines for a total of 28 vines. Treatments having the same distance between rows (curtain and high bush) were placed in the central section of the parcel and sorted in each replication. VSP and short bush were positioned on either side of the central section. All vines were used for yield, pruning weight, and must composition measurements. Seven single vines were chosen in each treatment out of the 28 vines for physiological measurements and surface area characterization. Data were analyzed as a wholly randomized design. Variance analysis (ANOVA) was performed using the MSTAT-C statistical package (version 2.00; Michigan State University).
Ecophysiological measurements.
Daily photosynthesis levels were studied at three phenological stages (Eichhorn and Lorenz 1977) in the vine growth cycle: bunch closure (stage 33), veraison (stage 35), and maturity (stage 38). Each cycle of measurements was two hours: from 7:00 to 9:00 solar time for the 8:00 hr measurement; from 11:00 to 13:00 for the 12:00 hr measurement; and from 15:00 to 17:00 for the 16:00 hr measurement. Measurements were taken on four external mature leaves on each of the seven representative vines for a total of 28 sampled leaves per training system. Leaves were selected at different heights on the main shoot with two of the sampled leaves facing east and two facing west. For logistical reasons, half the vines in each treatment were measured on each of two consecutive days. All measurements were taken on clear days (Table 3⇓). Net CO2 assimilation measurements were taken with a LI-COR infrared gas analyzer (model 6200; LI-COR, Lincoln, NB) equipped with a LI-COR 190SA quantum sensor to measure photosynthetically active radiation (PAR) light received on the sampled leaf. Transpiration and stomatal conductance measurements were taken with a LI-COR 1600 steady-state porometer.
Weather data on measurement days, Madrid, Spain, July to September 1992.
Effect of PAR intensity on photosynthesis.
During the 2002 season, 252 photosynthesis measurements were taken for each training system (7 vines x 4 leaves/vine x 3 daily intervals x 3 phenological stages) to construct a response curve. PAR was divided into intervals (<50, 50 to 60, 60 to 70, 70 to 100, and successively in intervals of 100 μE/[m2·s] to 1800 μE/[m2·s]). Mean photosynthesis was determined for all points of each radiation interval. The obtained points were adjusted to a rectangular hyperbole, type An = (a·PPFD + b)/(PPFD + c), where An is net photosynthetic activity, PPFD is photosynthetic photon flux density, and a, b, and c are constant variables. Maximum photosynthesis is represented by constant variable “a,” the compensation point is represented by “−b/a,” and (c + 2b/a) represents the value of PPFD for which photosynthesis is (An maximum)/2. For comparison, curves were transformed into regression lines according to An’ = 1/An and PPFD’ = 1/PPFD and differences in angle and level were analyzed.
Yield and vegetative development.
Yield per replicate was calculated as the mean yield of the seven vines per plot. Pruning weight of each replicate was calculated by weighing pruned shoots after leaf fall using a dynamometer with a maximum load of 5.0 kg and a sensitivity of 0.05 kg. Crop load yield to pruning weight ratio Ravaz index was calculated for all vines and mean crop load was calculated for each replicate.
Surface area in 1992.
Canopy management was performed on the selected vines during the growing period, with shoots positioned so that the shape of the vine was natural for each training system (Figure 1⇑). The VSP system was similar to a parallelepiped. Height and width measurements were taken from five places on each vine and mean values were calculated. The high-bush system was similar to a hemisphere, except for gaps where there were no leaves. In the field, four diameter measurements were taken for the section of the vine in contact with the soil and canopy height was measured in the center. Four radius measurements were taken from the base of the trunk to the outer edge of the canopy, and the mean radius of the hemisphere was then calculated. The short-bush system formed a continuous canopy with a semicylindrical shape. The external perimeter was measured at three places on each of the seven vines. The length of each vine was measured as the distance between vines in the row (1.25 m). The surface area (SA) of the short-bush vines was calculated by multiplying the external perimeter of the semicylinder by the distance between the vines in the row and subtracting the gaps without foliage. Gaps were fitted to geometrical figures, such as triangles and squares. A flexible tape was used to measure sides and heights in order to calculate surfaces, so they could be subtracted from the theoretical SA. The SA for single curtain was calculated using the same method as for short bush, measuring the external perimeter with a tape measure flexible enough to closely follow the external border of the vine. Four measurements were taken for each vine. Units of SA are m2 of surface area/m2 of soil.
Juice composition.
During early morning (9:00 to 10:00 am), 100 berries per experimental plot were taken from different parts of various clusters and transported to the laboratory in an ice cooler at a temperature between 1 and 5°C. Berries were weighed immediately after sampling with an electronic balance (model C-600-SX; Cobos, Barcelona, Spain) to determine mean berry weight and then passed through a hand-operated food mill, which allowed constant pressure to be applied during juice extraction with minimal seed and skin. The juice was then centrifuged at 3000 rpm for 3 min (Selecta, Abrera, Barcelona, Spain), and the obtained supernatant was immediately analyzed for Brix, pH, and titratable acidity. Total soluble solids (TSS) were measured using a Zeiss model B Abbé refractometer (Oberkochen württ, Germany) equipped with a temperature control system (20°C). Juice pH was measured using a Crison MicropH 2001 pHmeter with a glass electrode (Alella, Barcelona, Spain). Titratable acidity was measured by titration with a base to an end point of pH 8.2 (20°C), and results were expressed as g tartaric acid/L.
Results and Discussion
Net photosynthetic rate of fully exposed leaves.
The daily net photosynthesis rate followed the pattern of solar radiation, increasing until noon and then decreasing. The overall results indicated a higher level of CO2 assimilation in the high-bush vines, peaking at noon with lower levels in the early morning and late afternoon (Figure 2⇓). Differences in net photosynthesis rate between training systems increased during the course of the day. Usually there were few differences at 8:00 am, when vines in all systems were well rehydrated, temperatures for photosynthetic activity were optimal, and light levels were increasing. The greatest range of differences among training systems was recorded at noon solar time, with high bush having the highest values. When differences were significant, the reduction in photosynthesis levels between high bush and the least efficient system was ~34 to 37%. The most significant differences were recorded in the afternoon. The pattern appeared at midday and continued, yielding two clearly defined groups: the high-bush vines and the vertical vines. The short-bush vines did not fall clearly into either group. As the season progressed, mean photosynthetic levels remained constant rather than declining, as would be expected for presenescent leaves, since the sampled leaves were all healthy and had good exposure. Rankings of the different training systems remained unchanged from month to month.
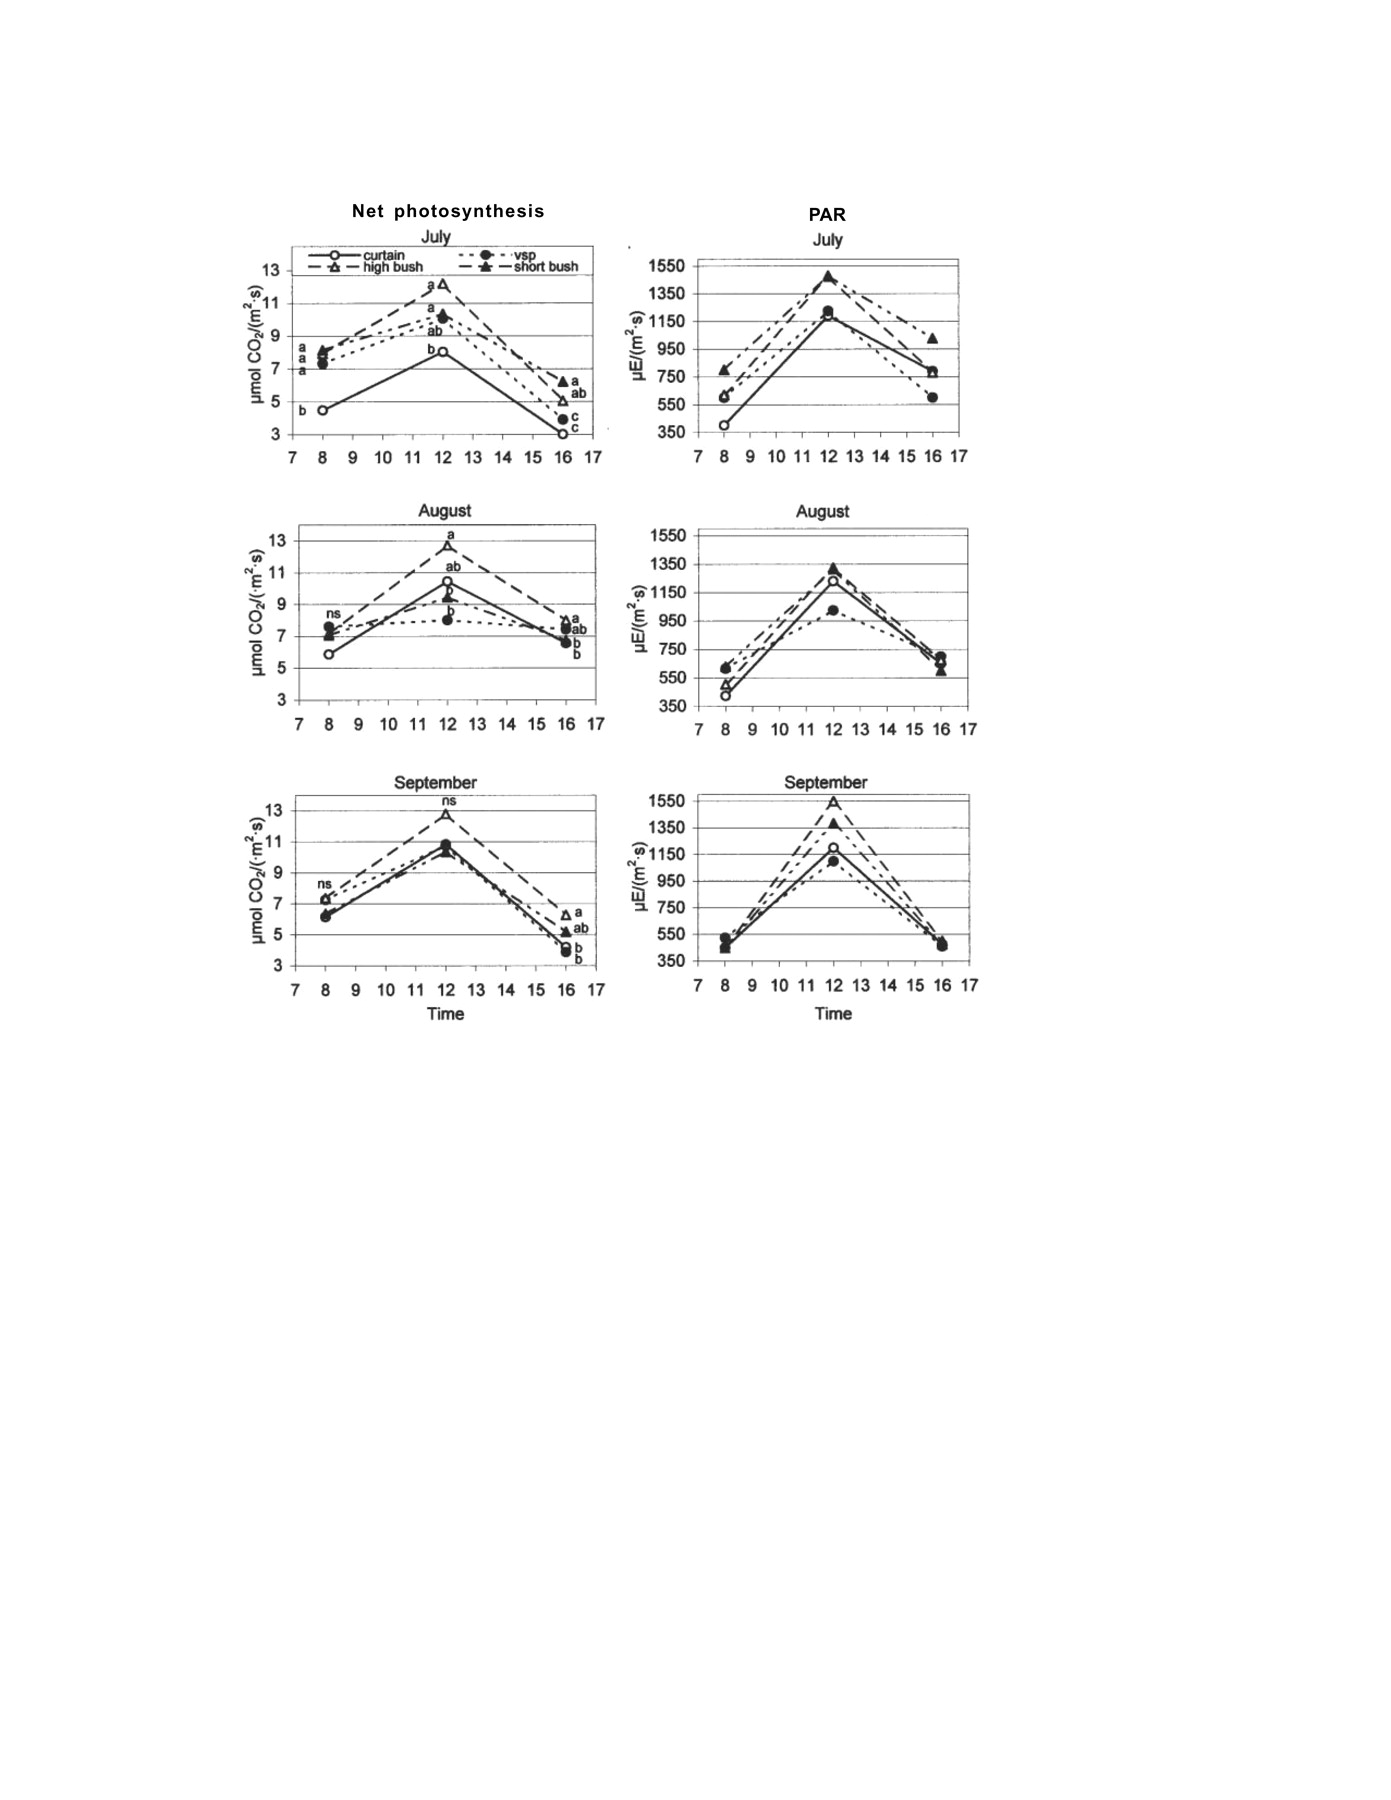
Daily and seasonal changes in net photosynthesis and photosynthetically active radiation (PAR) on outer leaves. Differences between means as per Duncan’s test at p = 0.05. Different letters in the same column indicate significant differences.
Higher levels of photosynthetic activity in the high-bush vines were consistent with higher levels of sunlight incident on the leaves (Figure 2⇑). Even so, the differences observed were not solely due to this factor, because there were differences between training systems in the afternoon measurements in August and September when PAR values were similar. A possible explanation is that high-bush vines achieved higher levels of photosynthesis for a given light level than vines from the other training systems. Poni et al. (1993) found more photosynthesis in leaves subjected to pulses of saturating light than in leaves intercepting constant saturating light levels. The external leaves of high-bush vines received high light intensity by sectors that changed with the angle of incident sunlight during the course of the day. As a result each leaf was exposed to excess light levels for less time than the external leaves of the VSP and single-curtain vines. That may cause higher efficiency of CO2 net assimilation at a given light level and lower losses because of photorespiration in high-bush vines. Any assessment of the photosynthetic performance of a training system should consider the response of each leaf and the SA it can produce, as these factors determine the majority of the system’s production potential, taking into account the importance of external leaves with respect to total leaf area in new photosynthesis (Smart 1985). The VSP system produced the largest exposed SA (Table 2⇑), followed by the single-curtain, high-bush, and short-bush systems. The SA of the high-bush system was 70% of that produced by VSP, while net mean annual photosynthesis on fully exposed leaves was 20% higher in high-bush vines than in VSP vines (8.82 μmol/[m2·s] and 7.35 μmol/[m2·s], respectively). Thus, in the absence of differences in predawn leaf water potential, the high-bush vines compensated for the smaller SA with the higher photosynthetic rate of external canopy leaves. Because of smaller SA, short-bush vines are expected to have lower levels of productivity than VSP vines. Carbonneau et al. (1978) recorded the highest gross photosynthesis per plant using the lyre trellis training system because of the larger SA obtained, even though the photosynthetic performance per unit of leaf area was not the highest.
Mean photosynthetic performance of fully exposed leaves with light intensity.
Mean annual photosynthetic response to PAR was fit by a rectangular hyperbola curve (Figure 3⇓, Table 4⇓). Saturation increased gradually and was not reached until very high light levels. Photosynthesis light curves were transformed to linear equations and compared, and short bush was the only treatment that was statistically different from the others. Differences between treatments in An response to light began around 300 μE (m2·s), far below saturation light level. Photosynthesis response for PAR values between 600 and 1500 μE/(m2·s) showed that VSP and high bush were the most efficient training systems.
Photosynthetic response curve parameters. Curves were adjusted to a rectangular hyperbole, type An = (a·PPFD + b)/(PPFD + c) (Amax: maximum net photosynthesis).
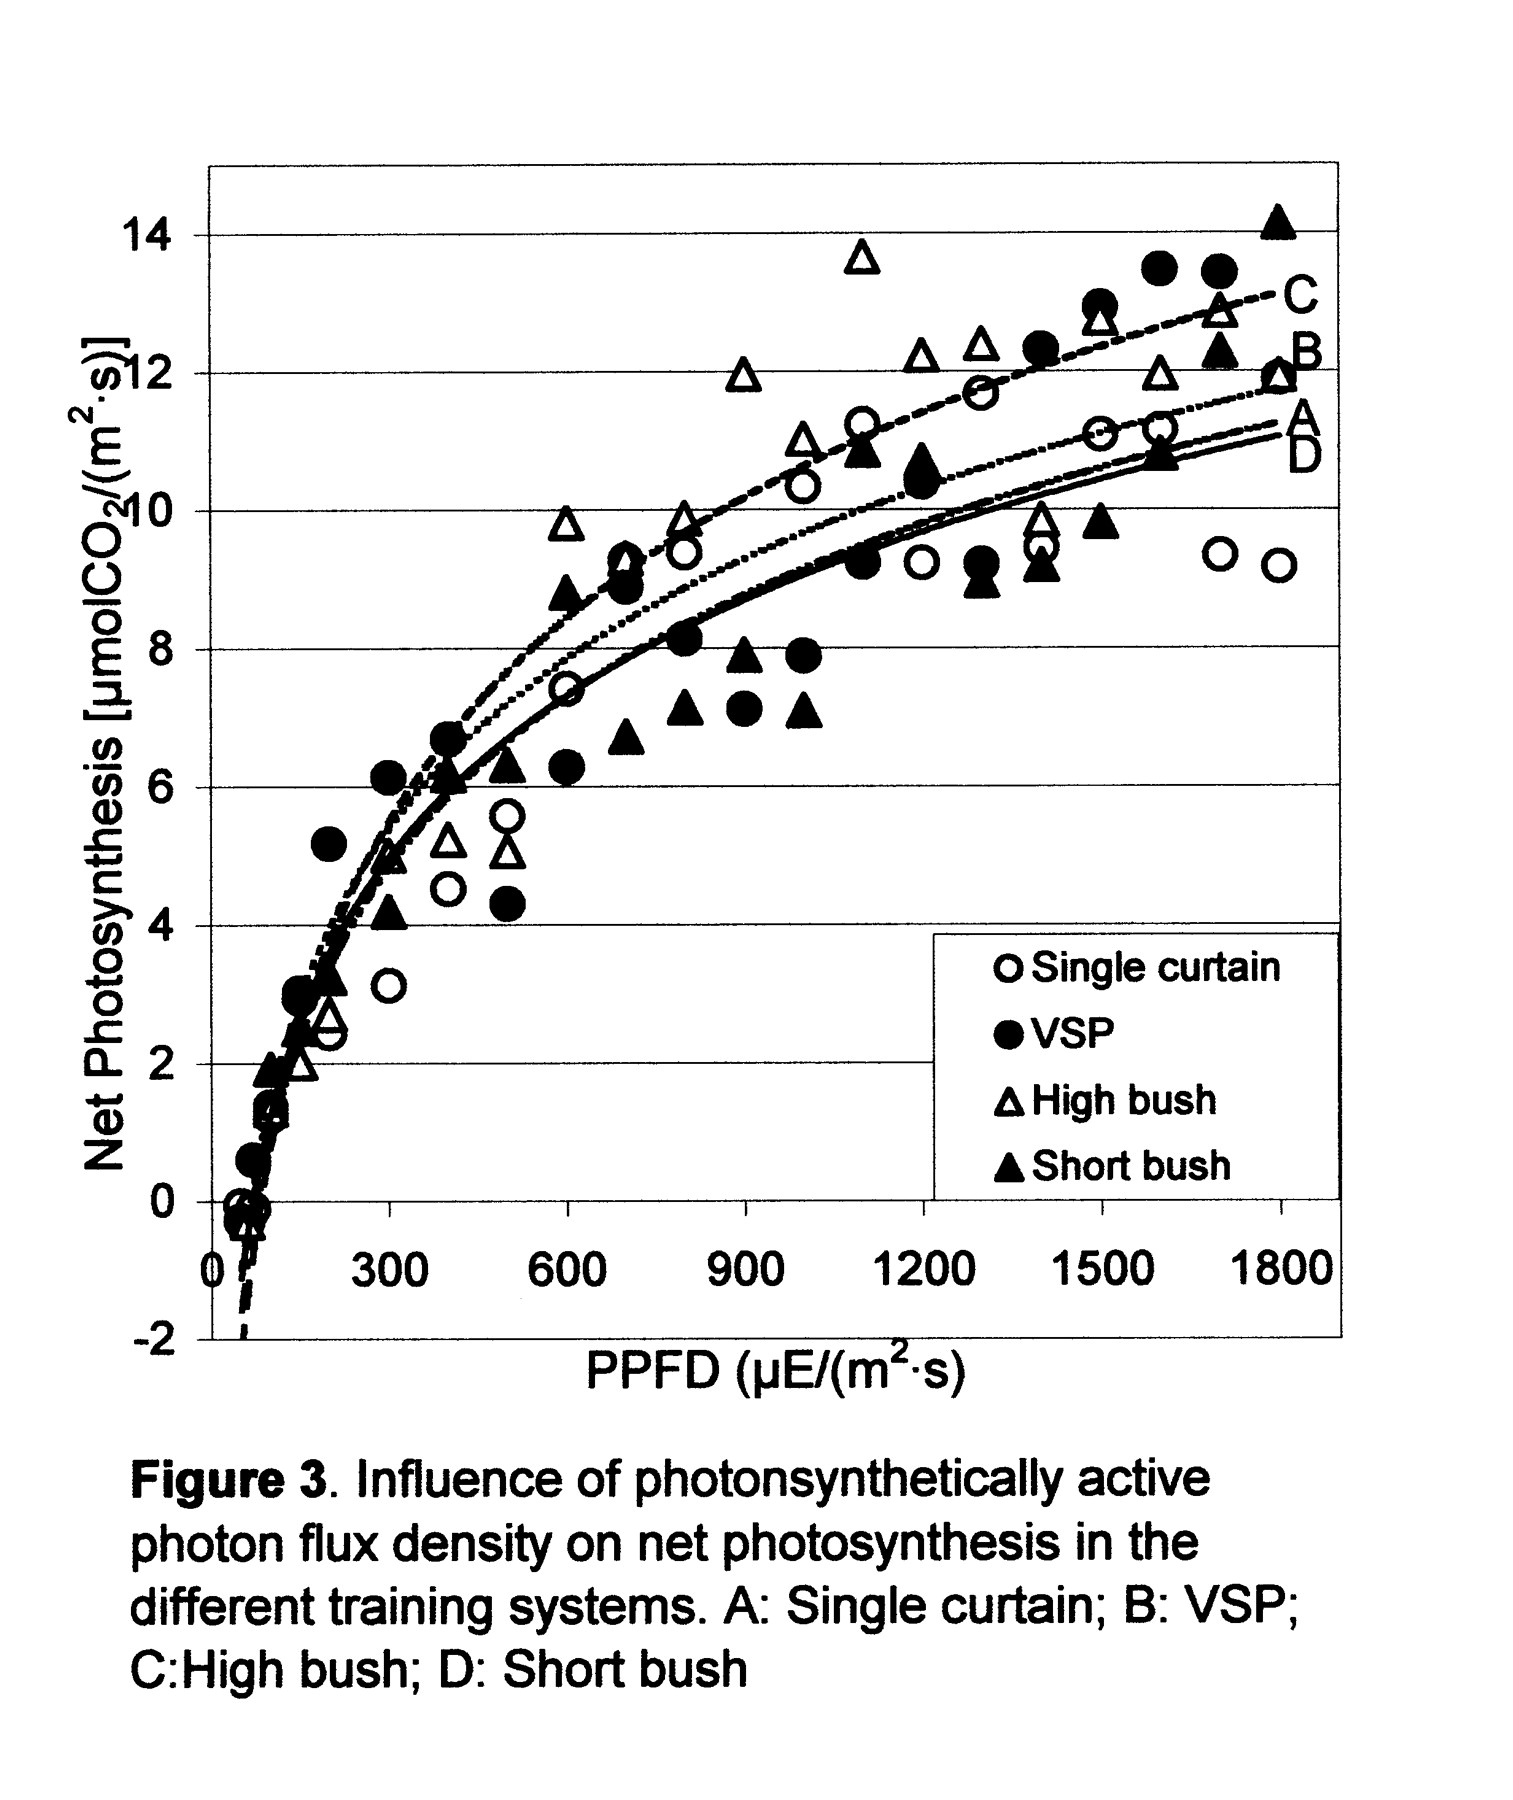
Influence of photosynthetic photon flux density (PPFD) on net photosynthesis in four training systems.
The light saturation index shifted toward higher light intensity values as leaf temperature rose during the day and over the season, a finding already observed under controlled temperature and light conditions (Chaves et al. 1987, Zufferey et al. 2000). This response is an adaptation of vine leaves to a warm environment in which respiration losses are higher but are partially offset by greater efficiency at higher temperatures (>30°C). A wide range of compensation values, from 9 to 100 μE/(m2·s1), has been reported previously (Chaves 1986, Düring 1988, Smart 1984, Zufferey et al. 2000), depending on trial conditions, leaf type, and leaf age. Under controlled environmental conditions in which ambient values were close to optimum, the compensation points tended to be at low PPFD values. In contrast, under field conditions other factors that affect photosynthesis may be limiting. The curves remain useful in comparing the responses of different training systems under the same conditions.
Transpiration rate patterns.
Daily transpiration rates followed the same general pattern as photosynthesis, increasing from morning to midday and then decreasing in the afternoon (Figure 4⇓). This pattern was more or less pronounced depending on month and training system. Peak transpiration rates were recorded in July for all training systems. There was a small decrease in August and then a more pronounced decline from August to September, in accordance with the evaporative demand. Differences among training systems increased as the day progressed and the growing season advanced, even though the predawn leaf water potential did not fall below −0.20 MPa for any of the treatments used.
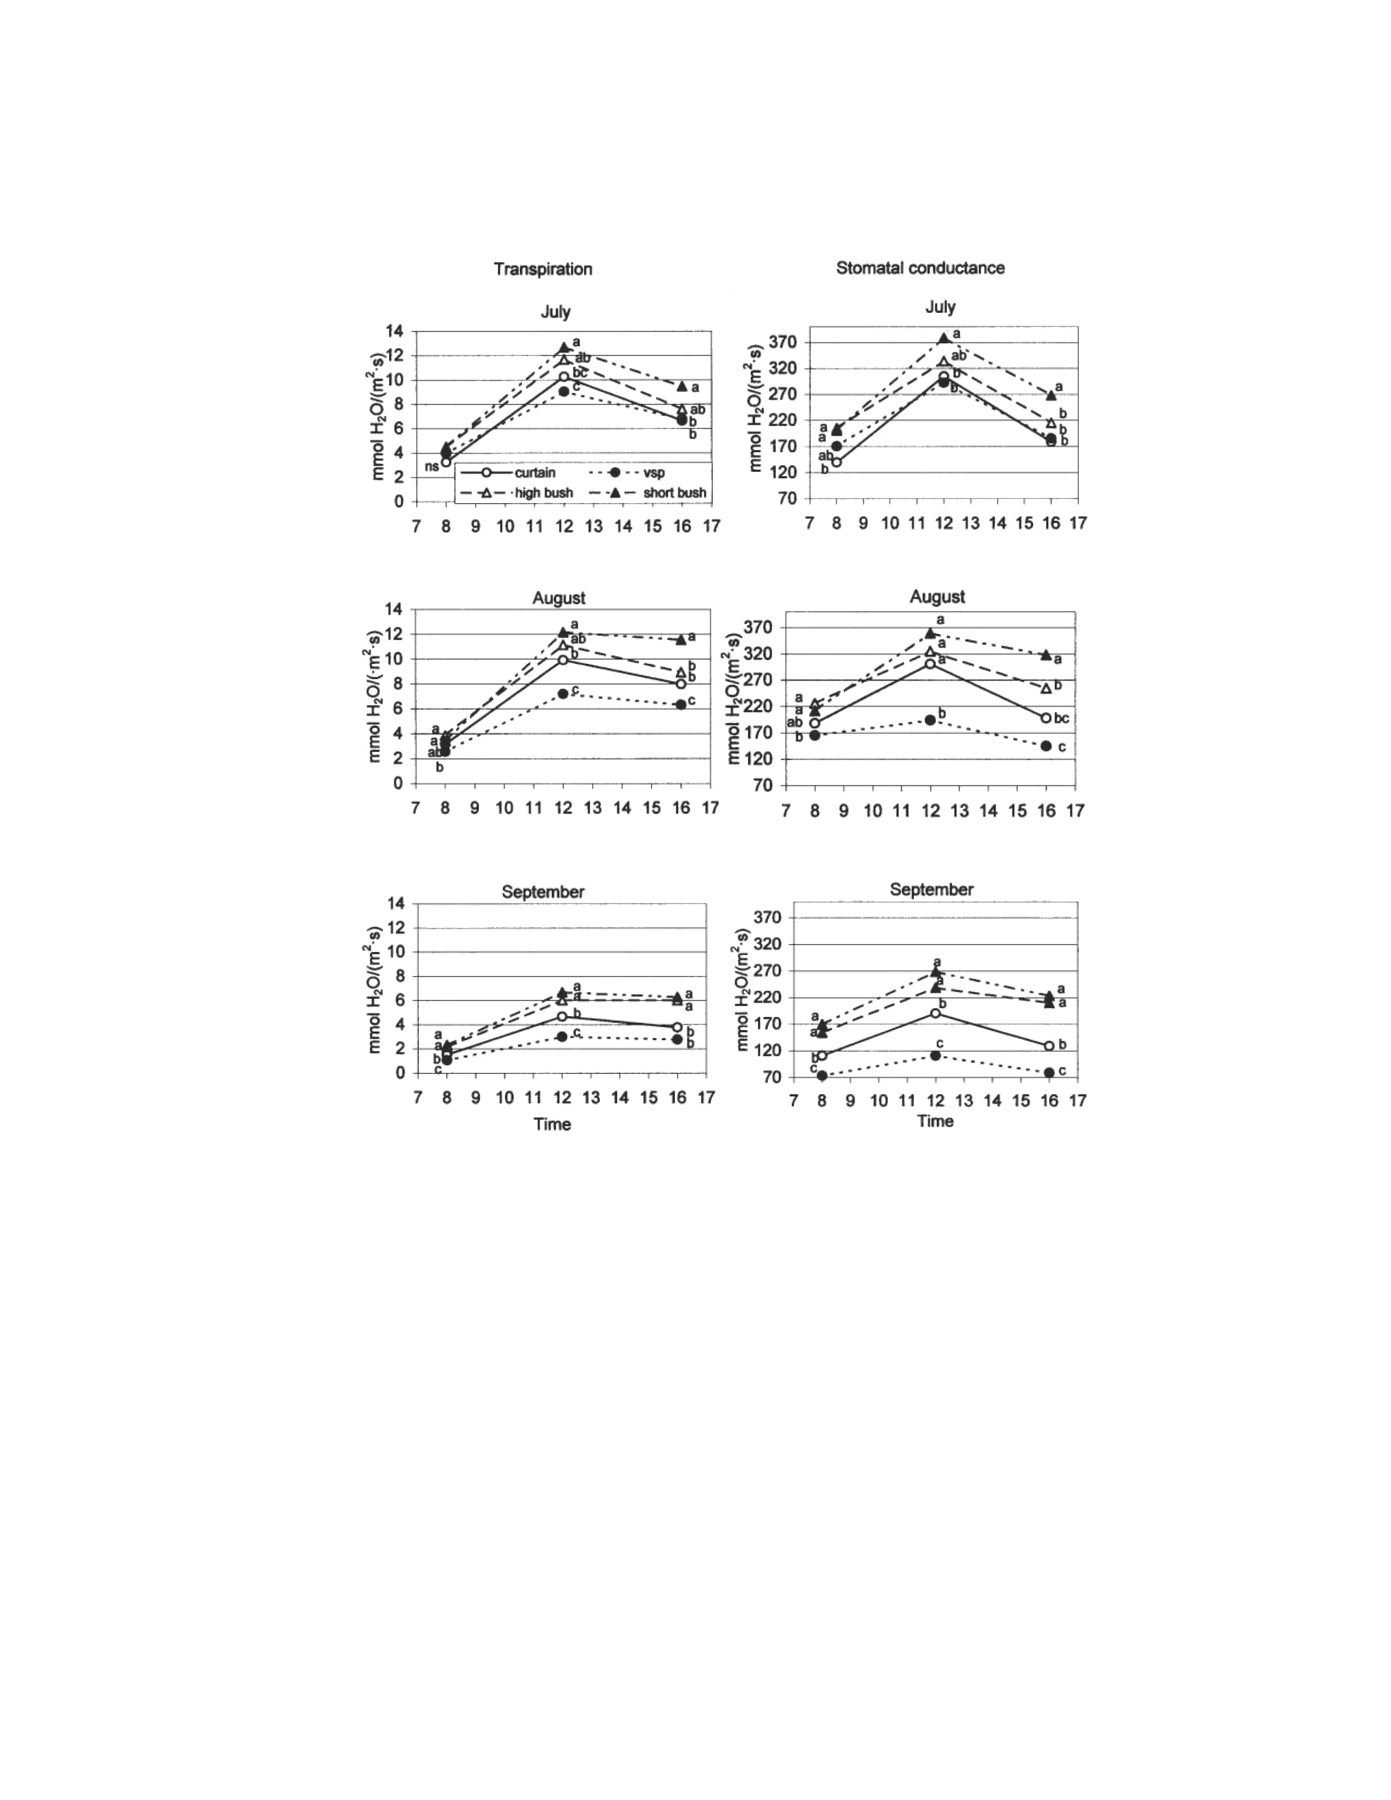
Daily and seasonal changes in transpiration and stomatal conductance. Differences between means per Duncan’s test at p = 0.05. Different letters in the same column indicate significant differences.
Over time, VSP was the system that differed the most from the others, particularly at solar noon. It had the lowest external leaf transpiration rate because it had the lowest water availability per unit of SA, although water supply per square meter of soil was identical for all training systems. In hindsight, we may conclude that different crop coefficients should have been applied because of differences in SA. High- and short-bush vines responded differently from the beginning (July) because bush vines had the highest illumination values per plant and the lowest SA, leading to higher water availability than VSP and single-curtain vines. The higher transpiration rates of the single-curtain vines as opposed to the VSP vines can also be explained by higher water availability made possible by the smaller SA of the single-curtain vines. Van Zyl and Van Huyssteen (1980) obtained lower crop coefficient values in vines with larger SA, with the highest coefficient values recorded for bush vines. They attributed their results to higher environmental temperature, more wind exposure, and less ground shading in this system, factors which also apply to our experiment. We found higher water consumption linked to higher photosynthetic yields in the high-bush vines (Figure 2⇑), but not in the short-bush vines. Accordingly, our short-bush vines had sufficient water for luxury consumption. The higher transpiration rate in external leaves of short bush as opposed to high bush was also consistent with other findings (Champagnol 1984, Zhang and Carbonneau 1987), which associated lower water conductivities with shorter trunk height/length. In traditional vine culture in extremely arid Spanish regions such as La Mancha or the Canary Islands, vines have a trailing habit with no distinct trunk. According to Carbonneau et al. (1978) and Williams (2002), crop transpiration depends on the total SA produced by the vine training system.
Stomatal conductance on fully external leaves.
Daily stomatal conductance rates for the different training systems showed significant differences among the systems at all measurement times. As in transpiration, the differences increased as the growing season progressed (Figure 4⇑). We found trends toward higher stomatal conductance in short-bush vines and lower stomatal conductance in VSP vines throughout the growing season. Differences between high-bush vines and vines grown in vertical systems increased and then remained constant in September.
The lower stomatal conductance and the transpiration rate of VSP vines were a defense against water loss through their larger SA and were the primary causes of the lower photosynthetic rates compared with bush systems. Archer and Strauss (1990) observed that closely spaced vines had a significantly lower stomatal conductance than more widely spaced vines, because narrow spacing implied greater SA, increasing plant water stress; these differences became more significant as soil water depletion advanced during the season. In contrast, Gaudillere and Carbonneau (1987) recorded higher photosynthetic rates and stomatal conductance in open-lyre trained vines than in trimmed VSP, where water was not limiting. Under these conditions, stomatal opening was not limited, and hence a larger SA did not bring with it a water deficit during the course of the day.
Relationship between stomatal conductance and transpiration rate.
Water loss was the same at any given conductance irrespective of the training system, although the system determines the portion of the regression line where it is placed. Most VSP vines had a stomatal conductance between 60 and 200 mmol H2O/(m2·s), while in the bush vines the lowest value was 150 mmol H2O/(m2·s). Throughout the trial period, stomatal conductance increased with transpiration, which is consistent with non-limiting water availability.
Water use efficiency on fully external leaves.
Water use efficiency (WUE) values were highest in the morning, decreased until noon in all treatments, and further decreased throughout the day (Table 5⇓). Net photosynthesis was more affected by stomata closure than transpiration rate when evaporative demand was high (Intrieri et al. 1998). The VSP system had generally lower transpiration rates and stomatal conductance values and thus achieved greater WUE in 66% of the measurements. This pattern can be regarded as an adaptation to relative water stress, as VSP vines have less water available per unit of SA than the vines grown using the other systems. None of the other systems exhibited constant patterns throughout the growing season. In September the short-bush vines were least efficient, while in July the single-curtain vines had the lowest efficiency.
Daily and seasonal changes in water use efficiency (μmol CO2/mmol H2O) on fully external leaves for four training systems.
Düring and Clingemeyer (1987) and Intrieri et al. (1998) found that a decrease in WUE throughout the day was caused by lower relative humidity, more light, and higher temperature. There was an upward trend from July to September at all times of day as the growing season advanced, brought about by a decrease in the transpiration rate in response to lower evaporative demand while photosynthetic rates remained constant. Carbonneau and Casteran (1987) found that under moderate water stress, stomatal conductance (gs) was more affected than gross photosynthesis (A), yielding a greater WUE during stress conditions.
Agronomic performance: Yield.
Yield was high in all four systems (Table 6⇓) because of high irrigation rates and other efforts to maximize fruit quantity and quality. The high-bush system had the lowest and most constant yield over all three years. The smaller crop produced by short-bush vines in 1991 may have been caused by late spring frosts, as the renewal zone was located close to the ground. There were significant differences in yield (kg grapes/m2) among systems each year. The VSP vines had the highest overall production in the three-year period.
Agronomic performance of four training systems over the three-year study, 1990 to 1992.
Number of shoots per square meter is a characteristic intrinsic to each training system. Pruning was optimized for each training system and adjusted yearly, which is why shoot number per vine changed during the study and why more shoots were left during shoot thinning in 1992 than in preceding years. Differences in the number of shoots per square meter among training systems were significant in each of the years, and differences between years were also shown to be significant.
In general, greater yield was obtained as shoot number per vine increased. VSP had the highest shoot number per vine and the greatest yield over the three-year period, whereas high-bush vines had the lowest shoot number per vine and yield. Differences in yield between these two treatments reached 28% in 1991 and over 46% in 1992. Wolf et al. (2003) obtained a slightly higher yield in VSP vines than in other nondivided training systems, with no measurable increase in fruit quality. In our case, differences in yield and SA between VSP and the other treatments were notable. Wolf et al. (2003) obtained a higher yield with minimum pruning and concluded that bunches per vine was the principal component responsible. Analogous conclusions were made by Shaulis et al. (1966), Clingeleffer (1984), and Reynolds et al. (1995).
Vegetative growth.
There were differences in pruning weight per square meter for the various training systems in 1990 and 1992. This value was highest for the short-bush system in both years, with significantly lower values in high-bush and single curtain vines. VSP vines had an intermediate value. In 1991 differences were not significant, although the pattern was similar to the other two years. In the years in which significant differences were recorded, the training systems with the highest shoot density had the highest pruning weight. The high vegetative growth of short-bush vines indicates vigorous growth of primary and lateral shoots. This growth is pruned back to retain canopy shape. This productive potential theoretically could be used to increase grape yield, but lack of space on the vine head does not allow an increase in pruning level. Therefore, the short-bush system does not have a high production potential.
Ravaz index.
Ravaz index (crop yield/pruning weight) values were within the range representative of vine balance (Table 6⇑) (Champagnol 1984, Bravdo et al. 1985), except in 1992 because of higher shoot load. No significant differences in crop load were observed among treatments in 1990. The short-bush system had the lowest crop load value in all three years. Significant differences among treatments were recorded in 1991, with single-curtain vines having the highest crop load and short-bush vines the lowest. In 1992, VSP vines had significantly higher crop load than the other three systems.
In the three years of study, the behavior of VSP vines was quite uniform, whereas the other systems fluctuated substantially. For example, crop load in single-curtain vines decreased by more than 50% from 1991 to 1992, and crop load in short-bush vines decreased progressively, the higher pruning level notwithstanding.
Must composition.
All systems produced musts with acceptable total soluble solids (TSS). There were significant differences in final TSS concentration among the systems in 1990 and 1992. Differences between systems with the highest and the lowest sugar concentrations were 1.5 Brix in 1990 and 2.0 Brix in 1992 (Table 6⇑). The single-curtain and high-bush vines had the highest sugar concentration in the two years in which significant differences were recorded, consistent with the assumption that higher crop load results in lower sugar concentrations. In 1990 the VSP and short-bush vines had the lowest Brix values together with the highest yield. There were no significant differences in 1991, although the general pattern was the same. In 1992, VSP again had highest yield and a significantly lower sugar concentration. The short-bush system had the smallest SA 1992 and also the lowest Brix. On the other hand, there was no trend toward higher Brix with higher SA values, suggesting that SA ceases to be a determining factor after a given value and that solids then become dependent on other factors such as yield. In 1991 there were no differences in TSS levels. Yield does appear to influence final Brix in the grapes.
Byrne and Howell (1978), Cawthon and Morris (1977), Morris et al. (1985), Murisier (1996), Reynolds et al. (1995), Wolf et al. (2003), and Wolpert et al. (1983) obtained higher TSS in those treatments with lower yield, although at times with a delay in ripening. In conditions similar to those in the present study, Auvray et al. (1999) did not observe differences in final Brix values for vines grown using different systems in which pruning levels had been optimized for each system, with those with the highest yields also attaining the highest TSS values because of more abundant and better foliage growth, thereby ensuring proper cluster ripening. Morris et al. (1985) reported that neither pruning level nor training system had an important effect on fruit quality, although the heaviest loads yielded fruits with the lowest sugar contents. Cawthon and Morris (1977), Byrne and Howell (1978), Wolpert et al. (1983), and Murisier (1996) concluded that decreasing yield was an effective method of increasing sugar content. Baigorri et al. (2001) under dry conditions, recorded higher TSS content for the treatment with the lower yield. Peterlunger et al. (2002) recorded higher Brix for training systems with lower yields per hectare, which may explain the lower TSS value obtained in this trial for VSP vines even though each year they had the largest SA and the highest irradiance. Nevertheless, the decrease in Brix value was less important than the increase in yield.
Yield can be increased and proper ripening achieved provided that the growing cycle is sufficiently long, in which case there will be a delay in ripening compared with systems having lower pruning levels. In such circumstances the frost-free period and the mean daily temperatures at the end of the ripening period are factors that will determine the qualitative and quantitative constraints for a given training system.
Titratable acidity.
The only significant differences in titratable acidity were recorded in 1992 between the bush systems and the vertically trained systems. The short-bush vines had the highest titratable acidity over the three-year period. The constant trimming required for the short-bush system was conducive to the growth of laterals. Total quantity of leaves present and leaf age and distribution played an important roles.
No significant relationship was found between yield and titratable acidity. Reynolds et al. (1995) reported delayed ripening in systems with the highest pruning levels, but in the present study, the acidity level in the VSP system was similar to that for the other systems and even lower than in the bush-training systems in 1992. Auvray et al. (1999) recorded significant differences in titratable acidity levels with lower levels in the juice of grapes from the single-curtain and Geneva double-curtain vines as opposed to bush, trellis, and lyre-trained vines.
pH.
There were few differences in must pH among systems. Even when significant differences resulted from statistical analysis, their enological value is questionable. Jackson and Lombard (1993) pointed out that low crop load (<5 kg yield/kg pruning weight) and high night temperatures result in high pH values. It seems that our hot conditions and Ravaz index minimized training system effect on must pH. Our results agree with those of Kliewer and Lider (1970), who found that when titratable acidity values were high, pH values were generally low. Auvray et al. (1999) did not find any significant differences in the pH levels in the juice of grapes from different training systems despite significant differences in titratable acidity.
Conclusions
The high-bush vines exhibited much higher photosynthetic rates than the other training systems as a result of the high PAR on the fully exposed leaves. From the perspective of crop efficiency, the production potential of a training system was observed to increase with SA, regardless of photosynthetic rate per unit of exposed leaf surface area. In terms of WUE, net photosynthesis per unit of exposed leaf surface area decreased as SA increased because of lower relative water availability, leading to a smaller stomatal opening size. Photosynthesis was not affected to the same degree of transpiration and WUE consequently increased. The VSP system had the most efficient water use and had the highest potential production of the four systems because of the large SA. The SA produced by the training system determines the physiological response of the vines under given environmental conditions and hence the degree of adaptation of the vines to those conditions. All systems exhibited some afternoon depression of photosynthesis. To mitigate this drawback in single-curtain and VSP vines, vine rows should be oriented in a NE-SW direction to avoid steady, high light intensities on the western side. In systems with untrained vegetative growth, such as short and high bush, controlled shoot growth is advisable, so that shoots can sway in the breeze and clusters can be aerated yet sheltered from excess light. We recommend maintaining an open canopy with a large leaf surface area yet good subpenetration to interior leaf layers to ensure high photosynthetic efficiency of canopy foliage.
The main differences between training systems were due to shoot number per vine. A high shoot number per vine can ensure adequate ripening if the photosynthetic activity of leaves is maintained with, for example, irrigation, as the most important limitation in the Mediterranean region is the long period of water deficit during berry ripening. However, the higher photosynthesis levels in high-bush vines do not necessarily result in higher production and quality than the other systems. Because of a lack of space for distribution, the high-bush system had a limited shoot number per vine and thus SA, conditions which were less favorable than the vertical systems. VSP had a clear advantage over the other systems, as high grape yield was guaranteed by large SA and photosynthetic efficiency. The short-bush system presented greater vegetative development resulting in low crop load, making it less efficient. Good crop quality was obtained in all systems.
Footnotes
Acknowledgments: This study was conducted within a research project entitled “Caracterización ecofisiológica de sistemas de conducción y poda de la vid. Evaluación de sus posibilidades de mecanización,” reference C-025/90, supported by the Comunidad Autónoma de Madrid (Spain).
- Received January 2004.
- Revision received March 2004.
- Revision received August 2004.
- Copyright © 2005 by the American Society for Enology and Viticulture
Literature Cited
Vol 56 Issue 2


Jump to section
Related Articles
Cited By...
More from this TOC section
Similar Articles
