


Abstract
The purpose of this study was to assess the relationship between astringency and tannin concentration in red wine using various analytical methods. Forty red wines were selected from a large commercial producer based on preliminary assessment of tannin variation and with selection intended to reflect potential variation in tannin amount. Tannin concentration was determined using previously published analytical methods, including absorption of light at 280 nm, reaction with 4-dimethylaminocinnamaldehyde, protein precipitation, phloroglucinolysis, and gel permeation chromatography. Results indicated that clear differences in tannin quantification existed in terms of the actual amount reported and in the relationship with perceived astringency in red wine. The analytical methods having the strongest correlations with perceived astringency were protein precipitation (r2 = 0.82), phloroglucinolysis (r2 = 0.73), and gel permeation chromatography (r2 = 0.74). Given the equipment availability of most wineries, it was determined that protein precipitation was the most useful analytical method for astringency assessment. Because the protein precipitation method is similar to the physiological response to astringents, it could become an important in vitro tool for understanding how tannin structure modification leads to modification in astringency perception.
Tannins are critically important to the quality of red wines, providing them with astringency (Gawel 1998). Tannins are derived from the solid parts of the grape berry and are partially extracted during maceration (Prieur et al. 1994, Souquet et al. 1996, Cortell et al. 2005). Given their importance in red wine quality and their complex sensory response, research in this area has been active (Haslam and Lilley 1988, Noble 1990, Vidal et al. 2003, 2004). Tannins comprise a significant portion of the phenolic material in red wine; consequently, they are of specific interest because of their potential role in human health (Santos-Buelga and Scalbert 2000). For these reasons analytical method development is an important area of tannin research, and many procedures have been developed that could be useful in the winemaking industry.
The current challenge for many in the wine industry is the selection of an analytical method that correlates well with perceived astringency. Such a method is of obvious importance for quality control. Many analytical approaches have been used for quantifying tannins (Bate-Smith 1973, Hagerman and Butler 1978, Reed et al. 1985, Yebra et al. 1995, Peng et al. 2002, Feng et al. 2002, Antoine et al. 2004), and the challenge is to determine an appropriate method for red wine astringency prediction in a production setting. A successful analytical method for winery use would correlate with perceived astringency, be reproducible and inexpensive, and require minimal analytical skills and equipment for determination.
In research, there is a need to better understand the relationship between tannin structure and perceived astringency so that new strategies for their management during production can be developed. With the increase in knowledge about grape and wine tannin structure (Monagas et al. 2005), the natural progression in research will be to understand the physiological consequences of structure modification. Unfortunately, tannin isolates from red wines having well-defined modifications are available in very small quantities, making human subject testing prohibitively expensive. A synthetic approach to producing larger quantities of modified tannin with a well-defined structure has potential, but it might be unethical from a human testing perspective without prior toxicity testing, and it again becomes prohibitively expensive. What is needed is an in vitro method for the prediction of red wine astringency so that much smaller quantities can be studied.
The purpose of this study was to assess the relationship between tannin concentration in red wines and perceived astringency. Analytical methods appropriate for winery use (Nagel and Glories 1991, Harbertson et al. 2002, Somers and Evans 1974) and methods that might provide additional chemical information (Kennedy and Jones 2001, Kennedy and Taylor 2003) were used to quantify tannins in red wine and then compared to astringency values for the same wines from a production environment.
Materials and Methods
Chemicals.
Acetonitrile, N,N-dimethylformamide, and methanol were HPLC grade and purchased from Fisher Scientific (Santa Clara, CA). NaOH, HCl, acetaldehyde, glacial acetic acid, sodium acetate, and lithium chloride were also purchased from Fisher Scientific. Bovine serum albumin (BSA), phloroglucinol, 4-dimethylaminocinnamaldehyde (DMCA), sodium dodecylsulfate (SDS), triethanolamine (TEA), and (+)-catechin were purchased from Sigma-Aldrich (Saint Louis, MO). The distilled or reverse-osmosis water used in all solutions was purified to HPLC grade using a Milli-Q water system (Millipore, Bed-ford, MA).
Selection of wines.
Forty wines consisting of 32 from the 2003 vintage and eight from the 2002 vintage were selected from 122 production lots at the cooperating winery. These wines consisted of Cabernet Sauvignon, Merlot, and Syrah. Consideration for inclusion in the study was given to an averaged numeric quality score, tannin content by BSA precipitation, color intensity (420 nm + 520 nm), polymeric pigment (520 nm with SO2), and absorbance at 365 nm. This data was entered into a principle components analysis (PCA) based on correlations, and wines were selected that defined the scope of variance across each specific variety.
Wines were bottled in May 2004, directly from tank or barrel without the addition of SO2 or filtration. Wines were stored under cellar conditions and all sensory and analytical data was collected by July 2004.
Instrumentation.
All spectrophotometry was conducted on an Agilent 8453 diode-array spectrophotometer coupled to a Gilson XY autosampler and sipper system (Agilent, Palo Alto, CA). An Agilent 1100 HPLC consisting of a vacuum degasser, autosampler, quaternary pump, diode array detector, and column heater was used. Chemstation software was used for HPLC analyses.
Spectrophotometric analysis.
Tannin concentrations were estimated spectrophotometrically using total phenolic absorption at 280 nm (Somers and Evans 1974), protein precipitation of tannins (Harbertson et al. 2002), and reaction with DMCA (Nagel and Glories 1991). For evaluation of total phenolics (280 nm absorption), wines were adjusted to pH 3.6 with 10% NaOH or HCl, centrifuged, and decanted into sampling tubes before analysis. After dilution (1:41, wine: model wine solution pH 3.6) wine absorbance at 280 nm (1-mm quartz flow cell) was measured. All absorbance values were adjusted to a 1-cm absorbance value. Conversion of absorbance to total phenolics was accomplished as previously described (Somers and Evans 1974).
Tannin concentration by protein precipitation was determined as previously described (Harbertson et al. 2002). Tannins were precipitated from wines by adding 1 g/L BSA solution, followed by centrifugation, collection and resuspension of the precipitate in an alkaline TEA/SDS buffer, measured for background absorbance at 510 nm, and measured for tannin absorbance after the addition of a FeCl3 solution. Values reported for this assay are the averages of two concurrent analyses for each wine. For quantification, results were compared to a (+)-catechin standard and reported as mg/L (+)-catechin equivalents.
For tannin determination by reaction with DMCA, a previously described method was used (Nagel and Glories 1991). DMCA solution was prepared by placing 250 mg DMCA and 833 μL 10 N HCl into 250-mL volumetric flask and filling to the mark with methanol. Analysis was conducted by adding 25-μL sample or standard to 4.0-mL reagent solution and measuring absorbance at 640 nm after 10 min.
HPLC analyses.
To prepare wines for HPLC analysis, wines underwent solid-phase extraction using a previously described method (Peyrot des Gachons and Kennedy 2003). Proanthocyanidin isolates were quantified by acid-catalysis in the presence of excess phloroglucinol followed by reversed-phase HPLC (phloroglucinolysis) using a previously described method (Kennedy and Jones 2001) under modified HPLC conditions (Kennedy and Taylor 2003). Tannin quantification was determined by comparing the sum of known proanthocyanidin products with a (+)-catechin standard. Isolates were also analyzed by high-performance gel permeation chromatography (GPC) using a previously described method (Kennedy and Taylor 2003), and tannin quantity was estimated by comparing the peak area (280 nm) of material eluting prior to the monomeric anthocyanin peak (malvidin-3-glucoside reference) with a (+)-catechin standard.
Sensory evaluation.
The tasting panel consisted of three winemakers and two enologists for a total of five production panelists. Given the numerous wines and repetitions requiring analysis, it was decided that a small, well-trained panel could provide accurate sensory data. Three training sessions were held before collecting data.
All sensory sessions consisted of six wines. Wines were coded randomly within each flight with letters A through F. For each session, panelists were presented with a randomized order in which to evaluate the six wines. A commercial red wine produced by the winery was presented at each flight as an anchor standard wine. Judges were instructed to taste and score the six wines in the order presented, leave the room for 15 minutes, and return to evaluate a second flight of six wines. In this manner 12 wines were presented in a prerandomized order over two flights for each day for a total of 20 flights in 10 days of tasting. Astringency intensity was scored from zero to 10, with zero values being assigned when there was an absolute absence of astringency and an intensity score of 10 representing the highest imaginable astringency. All panelists were present for all flights.
Data processing.
Spectrophotometric and sensory data acquisition and analysis was conducted with Access 2000 (Microsoft Corp, Redmond, WA). Statistical data analysis was conducted using the JMP 5.0.1.2 statistical platform (SAS Institute, Cary, NC). For sensory data and following astringency assessment, the raw data was imported into a Access 2000 database for normalization and combination with other flights. All wines were normalized to a mean of zero and a standard deviation of 1.0 for each judge within each repetition across all 40 wines.
Results and Discussion
Tannins generally comprise the largest phenolic component in red wines and are important because of their astringency. It is therefore important to understand the relationship between tannin measurement and astringency perception and how the modification of tannin structure is interpreted at the sensory level. The purpose of this study was two-fold: to identify analytical methodologies that could be used in a winery setting for astringency assessment and to determine the utility of chromatographic methods for providing chemical information related to red wine astringency.
Several analytical methods were selected and included absorption of light at 280 nm, reaction with DMCA, protein precipitation, phloroglucinolysis, and GPC. Results indicated that absorption of light at 280 nm (r2 = 0.40) and reaction with DMCA (r2 = 0.46) were not acceptable methods for astringency perception. Given that absorption of light at 280 nm and reaction with DMCA are nonspecific assays, the lack of correlation with perceived astringency was somewhat predictable (Gawel 1998).
When the normalized astringency results were compared with the three remaining analytical methods, a good relationship was found in each case (Figures 1⇓, 2⇓, 3⇓). Given the general analytical limitations of most wineries coupled with associated costs, protein precipitation appears to be the most likely method for most wineries. Other protein precipitation-based methods (Glories 1984, Edelmann and Lendl 2002, de Freitas et al. 2003, Carvalho et al. 2004, Llaudy et al. 2004) would likely produce a similar relationship between reported quantity and perceived astringency in addition to those that use other precipitants (e.g., metals, polysaccharides, or synthetic polymers). It is also likely that other analytical methods specific for tannins would have some correlation with perceived astringency.

Normalized red wine astringency versus normalized tannin concentration by protein precipitation.

Normalized red wine astringency versus normalized tannin concentration by phloroglucinolysis.

Normalized red wine astringency versus normalized tannin concentration by gel permeation chromatography.
One challenge in the quantification of tannins in red wine is that tannins are heterogeneous and therefore reported values can vary considerably depending on the analytical method. In this study, the tannin concentration range by protein precipitation was 387 to 1655 mg/L compared to 119 to 376 mg/L for phloroglucinolysis and 2194 to 4265 mg/L for GPC. While all methods used a (+)-catechin standard, the analytical approach is different in each. For protein precipitation, the method is designed to measure the precipitable amount of phenolic material. For phloroglucinolysis, the reported amounts were lower than protein precipitation, perhaps because of incomplete depolymerization of phenolic material into known proanthocyanidin subunits. For GPC, the high values reported can be partially explained by the inclusion of pigmented polymers in the quantified amount and, thus, because of the comparatively high molar absorptivity of this material, an overestimation of tannin results. Despite the differences in absolute amounts reported by the different methods, a reasonable correlation with perceived astringency was observed.
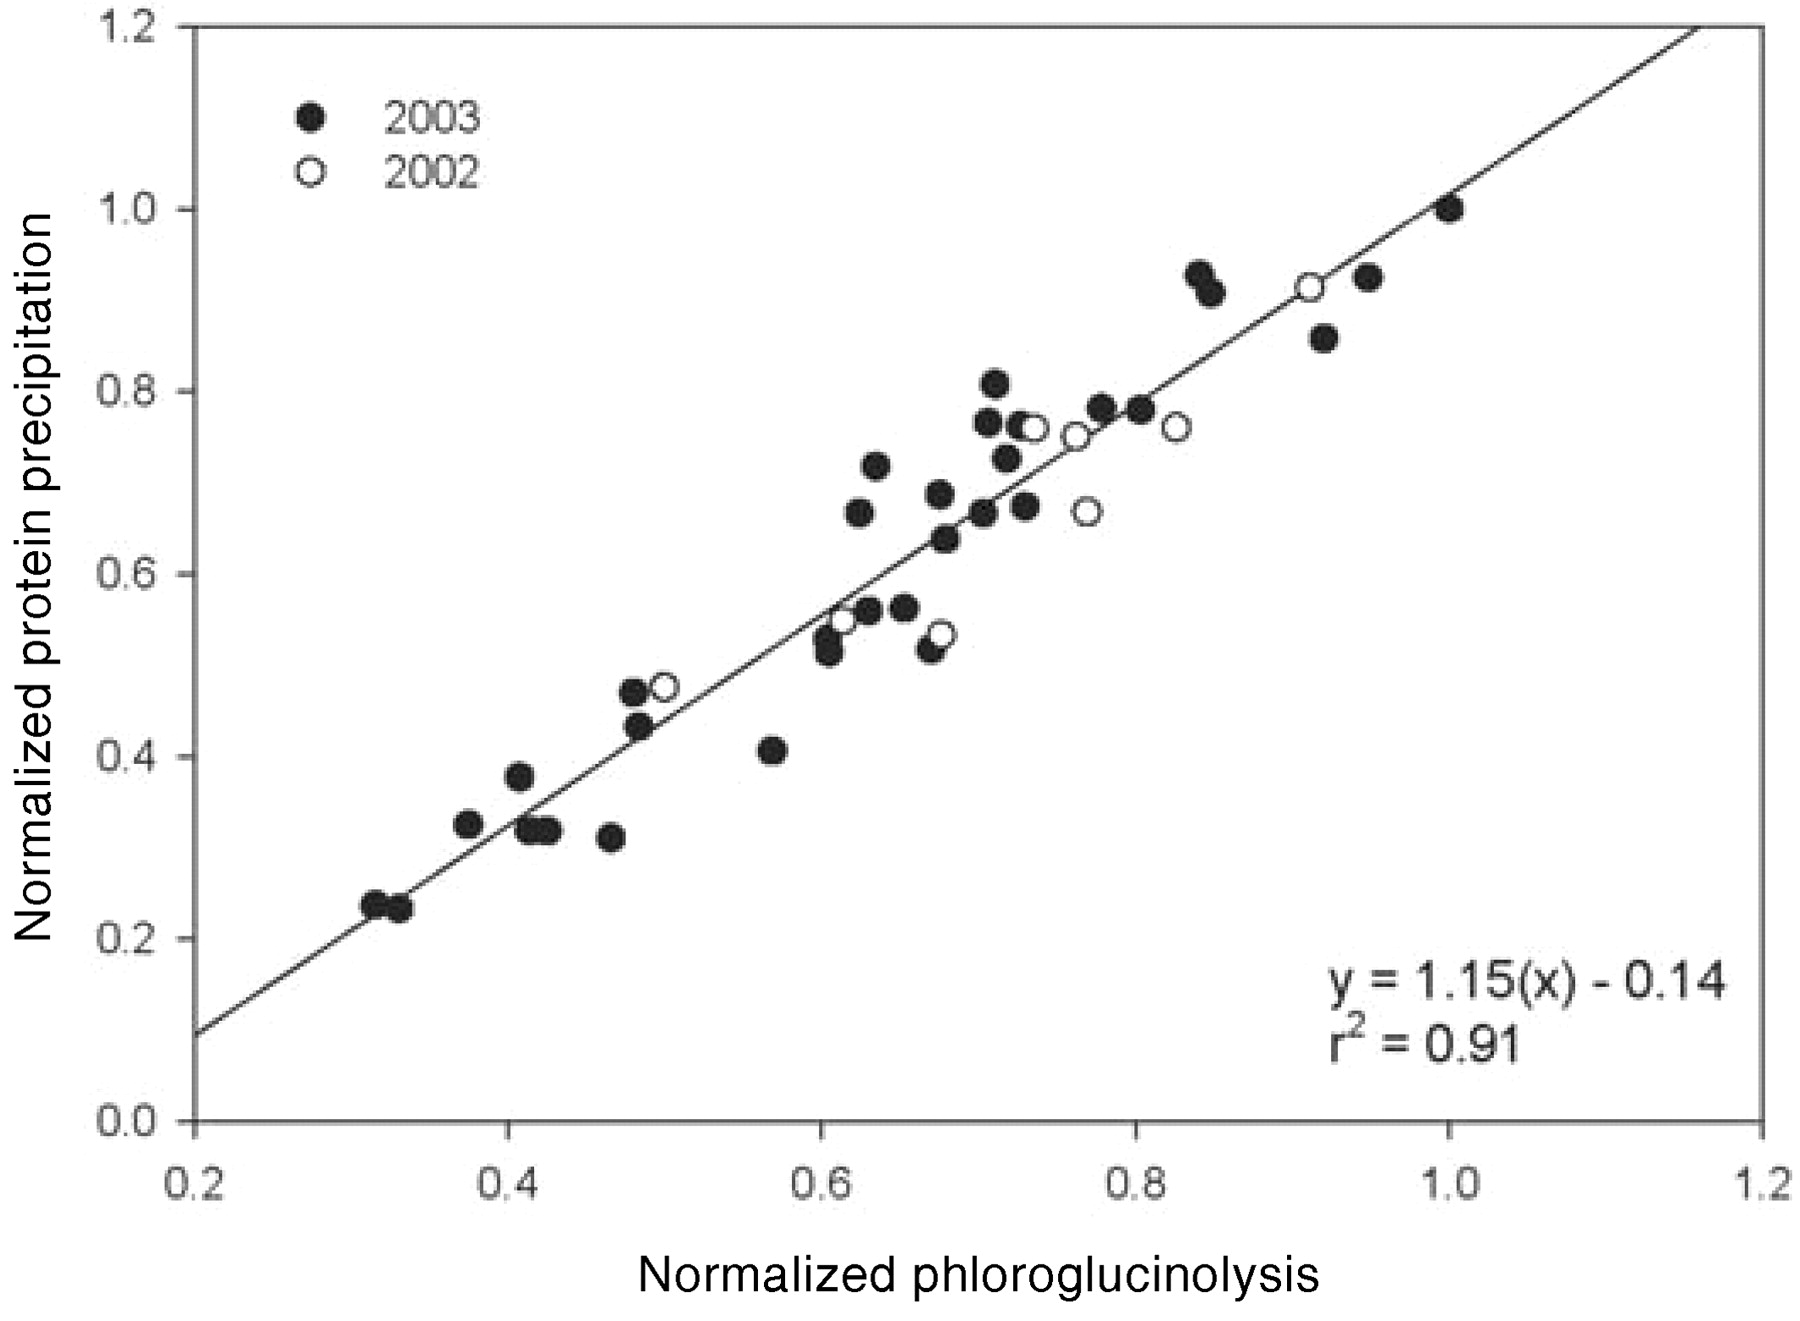
Given the expense of conducting controlled sensory evaluation, in vitro methods that are correlated with red wine astringency are needed. Because of its correlation and theoretical equivalence to the physiological response to astringents (i.e., precipitation of salivary proteins), the protein precipitation method may have utility in the laboratory for understanding how tannin structure relates to protein activity. The ability to have an in vitro assessment of red wine astringency could potentially provide a link between the chemistry laboratory and sensory evaluation. To explore this further, the results of the protein precipitation method were compared with the chromatographic methods (Figures 4⇓ and 5⇓). Clearly the relationships between protein precipitation and chromatographic methods are stronger than those obtained by sensory evaluation. Other factors that influence astringency at the sensory level, such as color, titratable acidity, and polysaccharides (Noble 1990, Vidal et al. 2003, 2004, de Freitas et al. 2003), may be involved, but they would not be expected to influence tannin analysis by the protein precipitation method.

Normalized tannin concentration by protein precipitation versus normalized tannin concentration by phloroglucinolysis.

Normalized tannin concentration by protein precipitation versus normalized tannin concentration by gel permeation chromatography.
Previous sensory studies have shown that the structure of tannins in red wine become increasingly complex as a wine ages (Fulcrand et al. 2004, Saucier et al. 1997) and that variation in tannin structure can influence sensory response (Vidal et al. 2003, 2004). Given this, the potential utility of combining protein precipitation with analytical methods that provide more chemical information was investigated (Figures 4⇑ and 5⇑). Results suggested a tendency for wines produced in 2002 to fall below the best-fit line, and therefore they had a lower protein precipitation value at an equivalent tannin concentration. A partial explanation could be that wines produced in 2002 had an increased proportion of pigmented polymer by GPC and large pigmented polymer by protein precipitation, suggesting that pigment incorporation reduced tannin astringency. Given the current model for astringency (Haslam and Lilley 1988), a reduction in tannin hydrophobicity (by incorporation of anthocyanins into the tannin structure) would result in a reduction in astringency, consistent with the observations here.
Conclusion
The results of this investigation, while preliminary, suggest that application of objective analytical methods that combine astringency estimation with chemical information could lead to new insights into how specific structural modifications lead to differences in protein interaction.
Footnotes
Acknowledgments: The authors thank Hogue Cellars for their interest and involvement in this project. This research was made possible through a grant provided by the American Vineyard Foundation.
- Received October 2005.
- Revision received April 2006.
- Copyright © 2006 by the American Society for Enology and Viticulture
Literature Cited
Vol 57 Issue 4


Jump to section
Related Articles
Cited By...
More from this TOC section
Similar Articles
