


Abstract
Volatile esters are a major by-product in the yeast fermentation of grape juice and can significantly impact wine flavor. Seven strains of Saccharomyces cerevisiae were monitored for their production of seven important volatile esters during fermentation of Chardonnay juice. Significant differences were observed in the rate of ester accumulation and the maximum and final ester concentrations among the wines made with the different yeast strains. Three of these strains, a “low,” “medium,” and high” ester producer, were further studied to determine the effects of different types of nitrogen additions on ester production. Chardonnay juice was supplemented with either diammonium phosphate (DAP), a common nutrient additive in the wine industry, or amino acids, and the ester production was monitored in the same manner as for the yeast strain experiment. The kinetics of ester formation for each nitrogen treatment were dependent upon yeast strain (in our experiment only one strain responded to nitrogen addition), and the DAP addition resulted in more significant increases in volatile esters than did the amino acid addition. From measurements of ammonium and amino acid utilization, our results could indicate that in this study, most of the volatile esters were not formed from the degradation of the added amino acids, but rather, at least in large part, by other biosynthetic mechanisms.
Volatile acetate esters (e.g., ethyl acetate, isoamyl acetate, and hexyl acetate) and fatty acid ethyl esters (e.g., ethyl butanoate, ethyl hexanoate, ethyl octanoate, and ethyl decanoate) contribute important aromas to wine, including floral, fruity (banana, apple, pear), solventlike, sweaty, or soapy characteristics, depending on the ester structure and carbon chain length (Meilgaard 1975, Gomez and Ledbetter 1994, Boulton et al. 1998, Kotseridis and Baumes 2000). Esters greater than 10 to 12 carbons in length are much less volatile and do not contribute as significantly to the aroma of wine as do the shorter chain esters (Boulton et al. 1998).
In wines, volatile esters are typically formed in concentrations well in excess of their equilibrium concentrations (Herraiz and Ough 1993). These concentrations are often greater than aroma threshold values and can impact the aroma of young wines, particularly white wines. As wines age, chemical hydrolysis occurs so that some of the esters found in high concentrations in young wines decrease to concentrations below their aroma thresholds (Ramey and Ough 1980, Shinohara and Watanabe 1981, Maric and First-Baca 2003). Even at low concentrations, however, the volatile esters may impact wine aroma because volatile esters have an additive effect with one another and therefore can be perceived when present in mixtures at concentrations below their individual aroma thresholds (Meilgaard 1975). In addition, when volatile esters are present at concentrations at or near their individual aroma thresholds, small changes in the concentrations of these esters can have dramatic effects on the aroma (Hammond 1993).
Most volatile esters in wines do not occur naturally in grapes but are formed by yeasts during alcoholic fermentation (Nordstrom 1962). One pathway for the synthesis of acetate esters is the reaction of acetyl-CoA with higher alcohols. These higher alcohols may be formed from the degradation of amino acids. Amino acids such as leucine are decarboxylated and deaminated to form an aldehyde, which is subsequently reduced to a higher alcohol by ethanol dehydrogenase. The fatty acid esters, on the other hand, are formed by the enzymatic ethanolysis of acyl CoA, which is produced during the synthesis or degradation of fatty acids (Herraiz and Ough 1993, Malcorps and Dufour 1992, Antonelli et al. 1999, Verstrepen et al. 2003a). Thus, esters may derive from carbon metabolism, from degradation or biosynthesis of amino acids, from fatty acid biosynthesis or degradation, and from yeast modification of grape aldehydes (Boulton et al. 1998).
Several factors can affect volatile ester production in wines, including fermentation temperature, nutritional differences in the juice (e.g., nitrogen concentrations), and genetic variations among yeast species and strains that can influence such factors as nitrogen utilization and the expression of the genes responsible for ester formation and hydrolysis (Killian and Ough 1979, Soles et al. 1982, Jiranek et al. 1995, Antonelli et al. 1999, Majdak et al. 2002, Torrea et al. 2003, Verstrepen 2003b, Estévez et al. 2004). However, little is known about how these factors can influence the kinetics of ester formation since the majority of these previous studies have focused on ester concentrations at the end of the fermentation or at only a few points during the fermentation.
Nitrogen is one of the major nutrients necessary for fermentation by yeast; levels of both ammonium ions and α-amino nitrogen can influence the synthesis of cellular proteins and, in turn, affect the biomass and fermentation rates (Boulton et al. 1998, Salmon and Barre 1998, Jiranek et al. 1995). Ammonium ions are the preferred source of nitrogen by yeasts (Boulton et al. 1998) and can influence amino acid metabolism by reducing catabolic enzyme levels and transport activity through various mechanisms, such as nitrogen catabolite repression (Cooper and Sumrada 1983). As a result, addition of ammonium to a model grape juice increases the utilization of nitrogen by yeast but may delay and reduce utilization of amino acids.
Amino acids may serve a direct role as precursors of esters (Nykänen 1986) or may play an indirect role in supporting cellular metabolic activities. Therefore, since utilization of ammonium and α-amino nitrogen is interrelated, it follows that the total assimilable nitrogen composition as well as levels of individual nitrogen sources in grape juice may affect the concentrations of volatile esters produced during fermentation. However, studies of the effects of amino acids and other nitrogen sources on ester composition have led to varying results depending on the juices used and the amount, timing, and sources (α-amino acids or ammonium ions) of nitrogen addition (Herraiz et al. 1993, Giorgessi et al. 2001, Hernández-Orte et al. 2002, 2005). These previous studies have not followed the kinetics of ester formation throughout fermentation, although knowledge of the factors that influence the kinetics of volatile ester formation may make it possible to increase maximum ester concentrations through optimization of both the rate and total duration of ester formation. It also may be possible to determine the factors that influence the decrease in the concentration of some esters after the maximum concentration is attained. Improved understanding of factors controlling both formation and degradation may prove to be useful in maintaining high ester concentrations for a longer time during fermentation and storage of wines.
Typical ammonium ion concentrations range from 25 to 559 mg nitrogen/L (N/L), with average levels of 125 to 213 mg N/L depending on region, harvest year, and viticultural practices (Ough 1969, Butzke 1998). The concentration of α-amino nitrogen in Chardonnay juice has been found to average ~250 mg N/L, although there was substantial variation (Spayd and Anderson-Bagge 1996, Butzke 1998). Frequently, winemakers adjust ammonium deficient musts to a range of 100 to 120 mg N/L (Boulton et al. 1998). In addition, it has been reported that 200 mg of total assimilable N/L is required for a fermentation to complete to dryness and that ~500 mg total assimilable N/L is necessary for maximal biomass and the most rapid rates of fermentation (Boulton et al. 1998). However, in many cases, winemakers proactively add nitrogen (usually in the form of ammonium ions) to the must to prevent stuck or sluggish fermentation, even without knowledge of the initial nitrogen status of the musts, which can result in high nitrogen levels, beyond the minimum necessary to complete the fermentation. The effects of nitrogen addition on the dynamics of ester production, in cases where total assimilable N is not limiting, are not known.
Although several studies have determined the effects of yeast strain on ester concentrations and a few studies have evaluated the effects of nitrogen source on ester concentrations, little is known about the effects of these parameters individually and in combination on the kinetics of volatile ester formation. Therefore, the present study was undertaken to quantify the extent to which yeast strain and nitrogen source affect the kinetics of volatile ester formation, particularly in cases where nitrogen is added to musts that are not considered limiting in total assimilable N.
Materials and Methods
Grape source.
Vitis vinifera (Chardonnay) grapes were harvested at 22 Brix in October 2004 from the University of California, Davis (UCD) Tyree experimental vineyard. Grapes were hand-picked and no disease was evident. Titratable acidy as tartaric acid equivalents was 6.62 ± 0.16 g/L and juice pH was 3.61 ± 0.02. The grapes were transported to the UCD crushing facility where they were immediately crushed and pressed with a pneumatic membrane press (150 kPa). No sulfur dioxide was added to the juice. The juice was settled overnight, racked off the lees to 400-L stainless-steel containers, and stored at -4°C for further settling and to prevent fermentation. The juice was then sterile filtered and stored in sterile 4-L glass containers at 4° C until used.
Yeasts.
Seven strains of commercial Saccharomyces cerevisiae were used in this study: M1 (UCD VEN 2500), Simi White (UCD VEN 2501), T 306 (UCD VEN 2502), CY 3079 (UCD VEN 2497), DV-10 (UCD VEN 2498), ICV 254 D (UCD VEN 2499) and Uvaferm CEG (UCD VEN2496) (Lallemand, Montreal, Quebec) (UCD culture collection accession numbers given in parentheses). All strains are Saccharomyces cerevisiae var. cerevisiae with the exception of DV-10, which is Saccharomyces cerevisiae var. bayanus. These yeast strains were chosen based on the manufacturers’ claims for levels of ester production, nutrient requirements, and rates of fermentation.
Active dry yeasts from the supplier were rehydrated according to the manufacturers’ specifications. Each yeast strain was then plated on WL nutrient agar (Difco, Detroit, MI) for isolation. From the plate, a colony was isolated and restreaked two times, at which time a colony was suspended in a WL nutrient broth. Each strain was then suspended in a sterile 20% glycerol/deionized water solution and frozen at −4° C. Genus and species of the isolated colony from each strain were confirmed by PCR amplification and DNA sequencing prior to freezing and storage in the UCD culture collection. The strains used for all further experiments were from the frozen solutions of the isolated colonies in the UCD culture collection. For ease of discussion, we have continued to refer to the strains by their commercial names, rather than the UCD accession numbers.
Fermentations.
Fermentations were carried out in separate 1-L bioreactors (Applikon, Schiedam, Netherlands), each equipped with a motor and paddles for constant stirring. The reactor and all ports were sealed and the reactor was autoclaved prior to addition of the juice. Sterile-filtered Chardonnay juice (1 L) was added to each sterilized fermentation vessel by connecting the 4-L carboy containing the juice to a port in the fermentation vessel with sterile tubing and drawing a vacuum through a second port. After filling, a sterile fermentation lock was added to one of the ports before resealing all other ports on the vessel. The Chardonnay juice was stirred at 100 rpm throughout the fermentation and temperatures were held at 20 ± 1° C in a Blue M MR3220A-1 (Chicago, IL) constant temperature refrigerated water bath.
Yeast inoculum was prepared in a mixture of 3 mL sterile deionized water and 4 mL sterile Chardonnay juice in a sterile glass tube by aseptically inoculating with a loopful of frozen yeast solution prepared as described above. The culture was incubated for four days in a water bath at 20° C. A control inoculum was created in the same manner, except no yeast was added to the inoculum.
The inoculum was added to the juice at a final optical density of 0.02 as determined with a spectrophotometer (model UV160U; Shimadzu, Kyoto, Japan). A control fermentation was prepared in the same manner as the experimental fermentations and was inoculated with the control (no yeast) inoculum.
The fermentation rate was monitored daily by weight loss (evolution of CO2) and the progress of each fermentation was reported as percent weight loss relative to the weight at the beginning of the fermentation. The fermentation was considered complete when the weight stabilized and the reducing sugar was ≤ 0.05 mg/L. Clinitest tablets (Bayer Inc, Elkhart, IN) were used to estimate the reducing sugar remaining in the wine at the end of fermentation (Ough and Amerine 1988). For selected treatments, separate fermentations were conducted to monitor cell growth and viability. These fermentations were performed exactly the same as for all other treatments except that twice each day a sterile-tipped Pipetman was used to transfer a 0.5-mL sample from the center of the fermenting juice to a sterile flip-top tube. Samples were diluted with sterile water (1/10) when necessary. Each tube was shaken thoroughly before a small sample was withdrawn using a glass Pasteur pipet. Samples were loaded into a Bright-Line Hemacytometer with improved Neubauer ruling (Reichert, Buffalo, NY) with a polished glass cover-slip (VWR LabShop, Batavia, IL), and examined under 40x magnification. The total number of cells in each of three 0.004 mm3 squares was recorded. Cell viability was also determined using these diluted samples by a modified version of an established method (Painting and Kirsop 1990). A drop of the sample was mixed with a drop of 0.4% methylene blue reagent (buffered with 0.4 M KH2PO4 in 10% ethanol) on a microscope slide. Three fields of view at 40x magnification were selected at random and the total number of live and dead (stained) cells recorded.
GC-FID analysis of esters.
A gas chromatography-flame ionization detection (GC-FID) method for analysis of volatile esters was adapted and modified from existing methods (Vianna and Ebeler 2001, Lee et al. 2004). Volatile esters were separated using a Hewlett-Packard 5890 GC equipped with a FID and a DB-1701 column (30 m x 0.32 mm x 0.25 μm; J&W Scientific, Folsom, CA). All injections were performed manually with a splitless injection (0.75 mm glass split/splitless liner). The carrier gas was helium (1.3 mL/min), the FID gases were hydrogen gas (37 mL/min) and air (300 mL/min), and the make-up gas was nitrogen (30 mL/min). Initially, the purge flow was 0 mL/min for 5 min, at which time it was increased to 33 mL/min.
The initial temperature of the GC oven was 40° C, which was held for 4 min after which time the temperature increased at 5° C/min to 100° C. When the oven reached 100° C, the temperature rate was increased to 10° C/min to a final oven temperature of 220° C which was held for 9 min; total run time was 37 min. Both the injector and detector were operated at 250° C.
Seven esters were analyzed and the identity of the esters in the wines was confirmed by comparison of retention times with those of authentic standards of each ester injected under identical conditions (Table 1⇓). All esters were purchased commercially (Aldrich Chemical Co, St. Louis, MO, for all esters except ethyl acetate, which was purchased from Fisher Scientific, Fair Lawn, NJ) and were ≤ 98% pure.
Aroma thresholds, retention times, and standard curve concentration ranges and r2 values for esters used in this study.
SPME sampling.
Esters were sampled from wines and standard solutions using solid-phase microextraction (SPME) with a poly-dimethylsiloxane (PDMS; 100 μm) fiber from Supelco (Bellefonte, PA) as described elsewhere (Vianna and Ebeler 2001, Lee et al. 2004). The SPME needle was inserted through a septum on the top of the 1-L fermentor. Prior to injection of the needle through the septum, the exterior of the needle was swabbed and the septum was sprayed with a 70% ethanol solution to avoid contamination. The fiber was extended into the head-space for an absorption time of 40 min and was followed by immediate injection into the GC-FID inlet, where it was allowed to desorb for 5 min. During sampling, the tip of the SPME fiber was ~4 cm above the surface of the juice (or standard solution) in the fermentor and was offset from the center of the fermentor by ~3 cm to avoid hitting the stirrer.
Each fermentation was sampled prior to inoculation and then sampled once per day after inoculation. The fermentations continued to be sampled until the weight of the fermentors stabilized and the reducing sugar was ≤ 0.05%.
Preparation of standards and ester quantification.
Esters were quantified using standard ester solutions prepared in an aqueous model wine solution (12% ethanol, 7.5 g/L tartaric acid equivalents, pH 3.5) as described elsewhere (Vianna and Ebeler 2001, Lee et al. 2004). The model solution was spiked with varying amounts of the seven esters to yield concentrations that bracketed the concentrations typically found in young wines (Table 1⇑).
Standard model wine solutions were transferred to the same 1-L fermentors used for the fermentations, which were sealed in the same manner, and the model wine solutions were stirred at 100 rpm. The headspace was sampled by SPME in an identical manner as used for the wine samples with an absorption time of 40 min and desorption time in the GC-FID inlet of 5 min.
The peak area of each ester from the standard solutions was plotted against the actual standard concentration to create the standard curves for each ester. The linear regression equations obtained were used to calculate ester concentrations in the juice fermentations.
Nitrogen supplementation.
Ammonia and amino acid analysis was performed by cation exchange chromatography on a 6300 Amino Acid Analyzer (Beckman, Fullerton, CA) with a lithium-ion exchange column at the Molecular Structure Facility at UCD.
For selected treatments, ammonia was added to the juice prior to initiating the fermentation by the addition of diammonium phosphate (DAP, [NH4]2HPO4; Sigma, St. Louis, MO) at a concentration of 170 mg nitrogen/L (N/L). Chardonnay juice (500 mL) was poured from a 4-L glass container into a 1-L flask. DAP (5.36 g) was added to the 500 mL of juice and stirred on a stir plate until the DAP was dissolved. This juice was then sterile-filtered back to the sterile 4-L glass container with a Falcon 357104 0.45 μm cellulose nitrate membrane bottle-top filter (BD Biosciences, San Jose, CA) and the entire solution was mixed well.
For treatments where amino acid concentrations were varied, amino acids (≥ 98% pure; Sigma/Aldrich, St. Louis, MO) were added to the Chardonnay juice at a total concentration of 170 mg N/L. The amino acids were added to the juice in the same relative proportion at which they were observed in the juice (Table 2⇓). Chardonnay juice (500 mL) was poured from a 4-L glass container into a 1-L flask. The amino acids were added to the juice and stirred on a stir plate until mostly dissolved. The juice was added back to the 4-L glass container and then stirred to completely dissolve the amino acids. The juice was then sterile filtered to a sterile 4-L glass container with a 0.45-μm bottle-top filter.
Measured amino acid (AA) concentrations and amount added to Chardonnay juice in the nitrogen supplementation experiment.
Experimental design.
Yeast strain and kinetics of ester formation.
Sterilized Chardonnay juice was added to seven 1-L sterilized bioreactors. Each of these fermentors was aseptically inoculated with one of the seven strains of S. cerevisiae so that the fermentations were conducted only by the desired yeast strain. Two fermentations were conducted for each yeast strain; the replicate fermentations were performed at separate times. No nitrogen supplements were added to the juice prior to inoculation. A control with no yeast was run simultaneously with each replication.
Nitrogen supplementation and kinetics of ester formation.
Three of the yeast strains studied in the yeast strain experiment were chosen to determine the effects of nitrogen supplementation: a “low” (Simi White), “medium” (254 D), and “high” (M1) ester producer. In the nitrogen supplementation experiment, two different nitrogen treatments were evaluated, one in which DAP was added to the juice (+DAP) and one in which amino acids (+AA) were added to the juice. Two fermentations were conducted for each yeast strain under both conditions; the replicate fermentations were performed at separate times. Control fermentations without addition of nitrogen were also conducted simultaneously with each replication.
Data analysis.
The effects of yeast strain and nitrogen source on the kinetics of ester formation for the seven volatile esters measured in this study were evaluated by plotting the individual ester concentrations throughout the fermentation. From each ester profile, several parameters were obtained, including the rate of ester accumulation, the maximum ester concentration, and the final ester concentration at the conclusion of fermentation. The rate of accumulation was calculated from the slope of a straight line drawn between the onset of ester accumulation and the maximum ester concentration. The low number of data points during the time in which the esters were accumulating at their most rapid rate can make it difficult to accurately assess rates of accumulation in this study. However, the information is still valuable in providing comparisons among treatments. The concentration at which the rate of accumulation dramatically slowed or stopped was considered the maximum concentration. The final ester concentration was determined at 250 hr when all fermentations were complete.
Data was analyzed by one- and two-way analysis of variance using SAS (SAS Institute, Cary, NC), Minitab 14 for Windows (Minitab, State College, PA), and Excel (Microsoft, Redmond, WA). Treatment means were compared using Fisher’s least significant difference (LSD) to determine differences in the rates of ester accumulation, maximum and final ester concentrations, and ammonium and amino acid utilization among the treatments.
Results
Yeast strain and kinetics of ester formation.
The control (no yeast added) juice did not ferment, indicating no contamination of the juice in this experiment. In addition, there were no changes in ester concentrations in the control juice throughout the experiment. All yeast strains had similar initial fermentation lag times (~42 hr) and profiles (monitored as weight loss), except for strain CY 3079. Strain CY 3079 did not ferment to dryness within the timeframe of the experiment (250 hr), maintaining a residual sugar level of ~0.2%. For comparison, the average of the fermentation curves for all strains, except CY 3079, is shown in Figure 1⇓.

Ester concentrations throughout fermentation for wines made from seven different yeast strains. UCD accession numbers for the isolated strains are indicated in the text.
The kinetics of ester formation for all seven esters of interest was dependent upon yeast strain (Figure 1⇑, Table 3⇓, Table 4⇓). The measured rate of ester accumulation was not simply the rate of ester formation, but a function of the combined rates of ester formation, hydrolysis, and volatilization.
Mean values for rate of initial formation and maximum and final concentration of acetate esters for fermentations using different yeast strains (n = 2). (UCD accession numbers for the isolated strains are indicated in the text.)
Mean values for rate of initial formation and maximum and final concentration of fatty acid ethyl ester production for fermentations using different yeast strains (n = 2).
Acetate esters.
There were significant differences in the rates of accumulation, maximum concentrations, and final concentrations of the acetate esters due to yeast strain (Figure 1A-C⇑, Table 3⇑). The rates of acetate ester production varied 2- to 3-fold across the strains and maximum concentrations varied similarly. Although strain M1 did not consistently have the highest rate of accumulation, it generally produced wines with the highest maximum and final concentrations of the acetate esters. Wines fermented with the Simi White, CY 3079, and T 306 strains tended to have the lowest maximum and final concentrations of these esters. There was no apparent correlation between the rate of accumulation and the maximum or final acetate ester concentrations; however, maximum and final acetate ester concentrations in the fermentations were correlated across most strains.
In all cases, the maximum acetate concentrations were reached at about the midpoint of the fermentation when most rapid weight loss occurred (Figure 1A-C⇑). Ethyl acetate and isoamyl acetate remained at relatively constant concentrations after reaching the maximum levels; however, hexyl acetate concentrations began to decrease rapidly after reaching their maximum, suggesting that the rate of formation of hexyl acetate was less than the rates of volatilization and/or hydrolysis after the midpoint of the fermentation. As a result, the concentration of hexyl acetate at the end of the fermentation was less than the maximum concentration.
Ethyl acetate concentrations were below the aroma threshold throughout the fermentation while the maximum and final concentrations of isoamyl acetate were above the aroma threshold for all treatments (Figure 1A, B⇑). Maximum concentrations of hexyl acetate were greater than that of the aroma threshold for fermentations with the M1, CEG, CY 3079, 254 D, and Simi White strains. However, none of the wines had concentrations of hexyl acetate greater than the aroma threshold at the end of fermentation (Figure 1C⇑).
Fatty acid ethyl esters.
Significant differences in the rates of accumulation, maximum concentrations, and final concentrations of the fatty acid ethyl esters were observed when different yeast strains were used for the fermentation of Chardonnay juice (Figure 1D-G⇑; Table 4⇑). Differences in rates of production of the ethyl esters were generally less than 2-fold. That was also true for differences in maximal and final concentrations. Again, there was no correlation between the rates of accumulation and the maximum or final concentrations of these esters.
Rates of accumulation and maximum concentrations of ethyl butyrate were greatest for fermentations with strain T 306, although fermentations with strain M1 also had high maximum and final concentrations in the wines (Figure 1D⇑, Table 4⇑). Fermentations with strains CY 3079 and Simi White typically had the lowest accumulation rates and maximum and final concentrations of ethyl butyrate. Generally, ethyl butyrate concentrations did not decrease significantly after reaching maximum concentrations.
Kinetics of ethyl hexanoate production were similar to those observed for hexyl acetate; that is, after the maximum concentration was reached (near the midpoint of the fermentation), the concentration of ethyl hexanoate began to decrease, suggesting that the rate of formation of ethyl hexanoate was less than the rates of volatilization and/or hydrolysis after the fermentation midpoint (Figure 1E⇑, Table 4⇑). No differences in rate of ethyl hexanoate accumulation were observed among fermentations with the different yeast strains. However, M1 fermentations had the highest maximum and final ethyl hexanoate concentrations while Simi White fermentations had the lowest maximum and final concentrations.
The greatest rates of accumulation for ethyl octanoate were observed in fermentations using strains CEG and 254 D, while greatest maximum concentrations were obtained with strains M1, CY 3079, and 254 D (Figure 1F⇑, Table 4⇑). After maximum concentrations of ethyl octanoate were reached, concentrations decreased slightly but at different rates for all yeast strains studied. After reaching maximum ethyl octanoate concentrations, fermentations with strains M1 and CEG had the greatest rate of decrease (−0.0038 and −0.0033 mg/L/hr, respectively), which was approximately 2-fold faster than the other strains. As a result of the rapid decrease in concentration, the M1 treatment, which had the greatest maximum concentration, had only a relatively moderate concentration at the end of the fermentation. On the other hand, fermentations with yeast 254 D also had high maximum ethyl octanoate concentrations, but concentrations did not decrease significantly and therefore finished with the highest ethyl octanoate concentrations. Again the Simi White fermentation had one of the lowest rates of accumulation and the lowest maximum and final wine concentrations.
For ethyl decanoate production, fermentations with strains M1 and 254 D had the greatest rates of accumulation and reached the highest maximum concentrations (Figure 1G⇑, Table 4⇑). However, fermentations with the M1 (and CEG) strains had higher rates of decrease in ethyl decanoate concentration after the maximum levels were reached than did fermentations with the other strains. Therefore, even though fermentation with M1 resulted in high maximum ethyl decanoate concentrations, the final concentration in the wine was the lowest of the strains studied.
Nitrogen supplementation and kinetics of ester formation.
Differences in the kinetics of ester formation due to different nitrogen supplements were evaluated for three yeast strains: M1, 254 D, and Simi White. These strains were chosen based on the results from the yeast strain experiment, as typically high, moderate, and low ester producers, respectively. Although the CY 3079 strain often produced low ester concentrations, it was not used in the nitrogen supplementation experiment because it did not successfully complete fermentation in the previous experiments.
Although at the low end of the recommended ranges, the Chardonnay juice used in this experiment had ammonium and total assimilable N levels that were within those recommended for optimal fermentation (Table 5⇓). After supplementation, addition of both DAP and amino acids resulted in similar total assimilable N levels (511 ± 65 and 438 ± 55 mg N/L, respectively); for both nitrogen treatments, the levels after addition were still within the suggested range for the most rapid fermentations.
Ammonium, α-amino, and total assimilable N concentration in Chardonnay juices used in the nitrogen supplementation experiment.
After addition of diammonium phosphate (DAP) to the DAP treatment, the measured nitrogen from ammonium increased to 289 ± 35 mg N/L, a difference of 177 mg N/L and consistent with the actual amount added (170 mg N/L) (Table 5⇑). After the addition of amino acids to the amino acid treatment, the measured concentration of nitrogen from amino acids increased to 326 ± 48 mg N/L). This increase in nitrogen from amino acids was 104 mg N/L, an amount less than the actual amount added (170 mg N/L). It is possible that losses in amino acids occurred during the filtration process that was used to prevent contamination of the juice. Autoclaving the juice after adding the amino acids led to an even greater loss in amino acids, presumably due to thermal degradation, so this method was not used for this experiment.
Concentrations of each individual amino acid in the control, the DAP treatment, and the amino acid treatment are shown in Table 2⇑. Amino acids were added in the same ratio as was measured originally in the juice.
Yeast strain effects.
The effects of nitrogen source on the kinetics of ester formation were dependent upon the yeast strain utilized in the fermentation, with strain 254 D showing the greatest influence of nitrogen source. For fermentations with strains M1 and Simi White, no significant effects of nitrogen source on kinetics of ester formation were observed (data not shown); therefore, it appears that these two strains are less sensitive to effects of the nitrogen source than strain 254 D, which was the “moderate” ester producer. As a result, and to simplify data presentation, only the effects of nitrogen source on the kinetics of ester formation of strain 254 D will be further discussed.
Fermentation profiles for strain 254 D.
The lag phase of the fermentations (measured as % weight loss) was slightly shorter for the +DAP treatment than for the control and amino acid treatments (Figure 2⇓). The +DAP treatment began to ferment before 23 hr, whereas the control and +AA treatments did not begin to ferment until after 23 hr. The rate of fermentation began to slow at ~75 hr for all treatments; however, the +AA and control treatments had a greater decrease in fermentation rate than the +DAP treatment. The +DAP treatment completed fermentation at ~165 hr, while the control and +AA treatments did not complete fermentation until ~206 hr and 215 hr, respectively. All treatments lost the same percentage of weight because of CO2 evolution, completed fermentation, and had residual sugars of ≤ 0.05% (Figure 2⇓).

Ester concentrations throughout fermentation for wines in the nitrogen supplementation experiment (yeast strain 254 D; accession UCD VEN 2499).
Ester formation in strain 254 D.
The dynamics of ester formation varied with the different esters and with the different nitrogen treatments. However, as with the yeast strain experiment, ethyl acetate and ethyl decanoate concentrations were always below the aroma threshold throughout the fermentations (Figure 2A, G⇑). Hexyl acetate concentrations typically reached maximum levels that were above the aroma threshold but then decreased to below the threshold by the end of the fermentations (Figure 2C⇑). All other esters were above the aroma threshold at the end of the fermentations (Figure 2B, D-F⇑).
Acetate esters.
Ethyl acetate.
The rate of ethyl acetate accumulation was not statistically different among the treatments, although the control and +DAP treatments tended toward faster rates (Figure 2A⇑; Table 6⇓). Maximum and final concentrations of ethyl acetate were highest for the +DAP treatment and lowest for the +AA treatment.
Mean values for rate of initial formation and maximum and final concentration of acetate esters in fermentations with yeast strain 254 D and nitrogen supplementation from either DAP or amino acids (AA) (n = 2). (Accession number for the isolated strain is UCD VEN 2499.)
Isoamyl acetate.
The +DAP treatment accumulated iso-amyl acetate at a significantly faster rate than the control and +AA treatment (Figure 2B⇑, Table 6⇑). Maximum and final isoamyl acetate concentrations were highest when DAP was added and lowest when amino acids were added, although at the end of fermentation there were no statistically significant differences in final isoamyl acetate concentration between the control and +AA treatments.
Hexyl acetate.
The rate of hexyl acetate accumulation was statistically similar for all three treatments; however, the +DAP treatment had a significantly greater maximum concentration of hexyl acetate than the +AA treatment (Figure 2C⇑, Table 6⇑). After the maximum hexyl acetate concentration was reached, the concentration decreased dramatically for all treatments, and by the end of the fermentation, all treatments had statistically similar hexyl acetate concentrations.
Fatty acid ethyl esters.
Ethyl butyrate.
There was no significant difference in the maximum rate of accumulation of ethyl butyrate among the treatments (Figure 2D⇑, Table 7⇓). Maximum and final ethyl butyrate concentrations in the wines were highest for the +DAP treatment and lowest for the +AA treatment, although statistically there were no significant differences among treatments at the end of fermentation.
Mean values for rate of initial formation and maximum and final concentration of fatty acid ethyl esters in fermentations with yeast strain 254 D and nitrogen supplementation from either DAP or amino acids (AA) (n = 2). (Accession number for the isolated strain is UCD VEN 2499.)
Ethyl hexanoate.
The control fermentation had the highest rate of accumulation of ethyl hexanoate, while rates of accumulation were statistically similar for +DAP and +AA treatments (Figure 2E⇑, Table 7⇑). The control and +DAP treatments had statistically similar maximum concentrations, which were significantly greater than the maximum concentration of ethyl hexanoate in the +AA treatment. After maximum concentrations were achieved, ethyl hexanoate concentrations decreased dramatically for all treatments. By the end of the fermentation, the concentrations of ethyl hexanoate in the control and +DAP treatments were statistically similar and significantly higher than in the +AA treatment.
Ethyl octanoate and ethyl decanoate.
The control fermentation accumulated ethyl octanoate faster than the two nitrogen treatments and had the highest maximum and final concentrations of this ester (although there were no significant differences in ethyl octanoate concentration at the end of fermentation between the control and +DAP treatments) (Figure 2F⇑, Table 7⇑). The maximum rates of accumulation and maximum and final concentrations of ethyl decanoate were highest for the control treatment (Figure 2G⇑, Table 7⇑).
Ammonium and amino acid utilization.
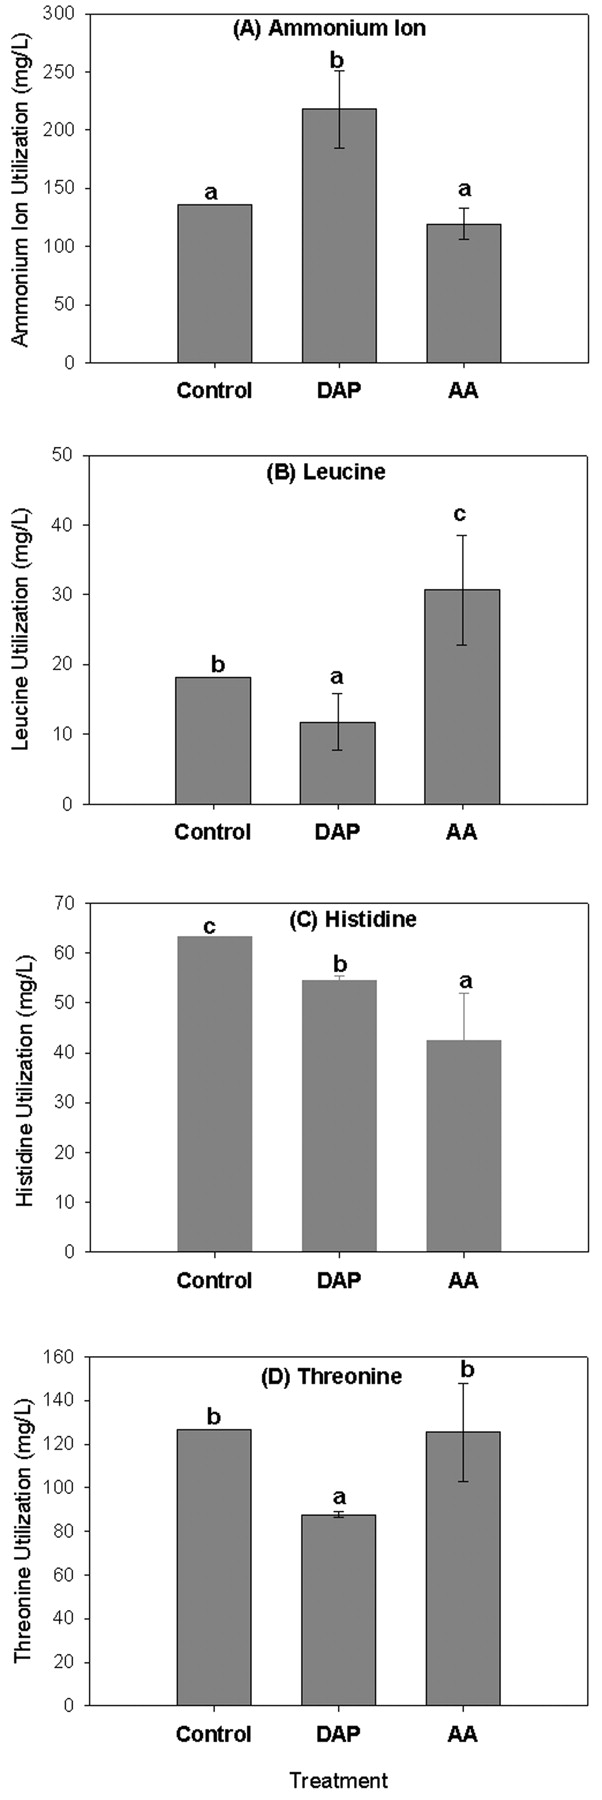
To further evaluate factors contributing to the differences in ester production associated with addition of nitrogen sources, the utilization of ammonium and amino acids by the yeasts was compared. The amount of ammonium utilized varied depending upon treatment (Figure 3A⇓; calculated as the difference in ammonium ion concentration from beginning to end of fermentation). When amino acids were added to the Chardonnay juice, there was no significant difference in the amount of ammonium utilized by the yeast relative to the control. However, when DAP was added to the juice (resulting in an increase in total concentration of ammonium), there was a significant increase in ammonium utilized. This was true for all three strains studied (254 D, M1, and Simi White), although only data for strain 254 D is shown.

Ammonium ion and amino acid utilization for fermentations with strain 254 D. Error bars represent mean standard error and bars with different superscripts are significantly different at p < 0.05; n = 2 (except for control n = 1, sample inadvertently lost during amino acid analysis).
When DAP was added to the juice, the utilization of all amino acids decreased relative to the control for all three yeast strains (Figure 3B-D⇑; data shown only for strain 254 D and selected amino acids as discussed below) (amino acid utilization was calculated as the difference in amino acid concentrations from beginning to end of fermentations). However, the effect of the amino acid addition on amino acid utilization varied depending on the specific amino acid. For example, utilization of leucine, isoleucine, methionine, phenylalanine, tryptophan, tyrosine, and valine increased when the concentration of these amino acids in the juice increased. On the other hand, utilization of histidine, glutamine, and alanine decreased when the concentration of these amino acids increased in the juice. For all other amino acids there were no differences in the amount utilized when amino acids were added.
Discussion
Yeast strain effects on kinetics of ester formation.
In agreement with previous studies, these experiments showed significant differences in ester production depending on the yeast strain used (Antonelli et al. 1999, Estévez et al. 2004, Herjavec et al. 2003). In most cases, the fermentations conducted with the M1 strain had the highest maximum and final ester concentrations, while the fermentations conducted using the CY 3079 and Simi White strains had the lowest maximum and final ester concentrations. However, when considering the two highest molecular weight esters, ethyl octanoate and ethyl decanoate, M1 produced a moderate final concentration of ethyl octanoate and a low final concentration of ethyl decanoate relative to the other strains, despite producing relatively high maximum concentrations of these esters. In addition, the CY 3079 strain produced a relatively high level of ethyl decanoate. Overall, the 254 D, T 306, CEG, and DV 10 strains typically produced moderate maximum and final concentrations of all esters.
The rates of accumulation varied from strain to strain and ester to ester and did not correlate with the maximum or final concentrations. There was no yeast strain that had a higher rate of accumulation for every ester studied relative to the other strains. However, the Simi White and CY 3079 strains, which often produced the lowest ester concentrations, did often have the lowest rates of ester accumulation.
Maximum concentration appears to be dependent upon multiple factors, including rate of accumulation, duration of the lag period, and time required to reach maximum concentration. Final concentration is dependent upon the maximum concentration, as well as rates of formation, volatilization, and hydrolysis after reaching maximum concentration.
The rates of accumulation calculated in this study are only approximations because of the limited number of data points during the time in which the esters were accumulating at their most rapid rate. In future work, more analyses should be performed during this initial time to reach more accurate conclusions about the accumulation rates. Additional data points early in the fermentation would also help to better define the duration of lag phase, the onset of ester formation, and the time to maximum ester concentration. In the current study, the number of sampling times was limited so that more yeast strains could be monitored simultaneously.
The kinetics of ester formation for hexyl acetate and ethyl hexanoate formation were different relative to the formation profiles of the other esters. For these two esters, concentrations decreased dramatically after maximum concentrations were reached. Similar results have been observed previously (Vianna and Ebeler 2001, Lee et al. 2004). The reasons for differences in production profiles for hexyl acetate and ethyl hexanoate relative to the other esters are unknown. However, hexyl esters are thought to derive from a grape precursor, hexyl aldehyde, that is modified by yeast metabolism (Boulton et al. 1998). Therefore, production of hexyl acetate and ethyl hexanoate may be primarily associated with cell growth; as cell growth slows or ceases, the formation of hexyl acetate and ethyl hexanoate dramatically decreases, resulting in volatilization and/or hydrolysis rates that are greater than formation rates.
By monitoring ester profiles over the entire fermentation, it became clear that the M1 and CEG strains produced unique profiles for ethyl octanoate and ethyl decanoate concentrations relative to the other strains. For M1 and CEG fermentations, the concentrations of ethyl octanoate and ethyl decanoate decreased much more dramatically after the maximum concentrations were reached than they did for the other yeast strains, perhaps indicating that M1 and CEG produced much less ethyl octanoate and ethyl decanoate late in the fermentation than the other strains. Alternatively, the M1 and CEG strains may have greater rates of enzymatic hydrolysis for these esters compared with the other strains. It has been observed elsewhere that fermentation conditions (e.g., initial Brix and level of yeast inoculation) had the most significant effects on overall profiles of ester production for these two esters relative to other esters (Lee et al. 2004). Clearly, further work is needed to evaluate the factors influencing metabolism of these higher molecular weight esters.
For all yeast strains, maximum and final concentrations of isoamyl acetate, ethyl butyrate, ethyl hexanoate, and ethyl octanoate in the wines were greater than the aroma thresholds, in agreement with previous studies (Shinohara and Watanabe 1976, 1981). Therefore, these esters can directly contribute to the aroma of these wines immediately after fermentation. However, some of the strains, such as Simi White and CY 3079, produced wines with maximum and final concentrations of some esters that were very near the aroma thresholds. As a result, these ester concentrations will likely fall to levels below the aroma detection thresholds more rapidly than in the other treatments because of hydrolysis and volatilization. It is likely that the use of strains such as M1 or DV 10, which generally produced higher final ester concentrations, will result in wines with longer lasting, more intense volatile ester aromas. However, no sensory analyses were performed in this study and future work is necessary to evaluate the long-term changes in ester concentrations that occur during storage of wines made with these yeast strains.
Effects of nitrogen supplementation on kinetics of ester formation.
When DAP was added to the juice, resulting in an increase in ammonium nitrogen, fermentations had a shorter lag phase and completed fermentation more rapidly compared with the control and +AA treatments for all three strains, possibly because at wine pH and potassium ion concentrations, S. cerevisiae is able to transport ammonium ions across the plasma membrane more easily than other nitrogen sources (Boulton et al. 1998). Alternatively, the observed differences in fermentation profiles could be due to the differences in availability of total assimilable N among the treatments. Although we attempted to match total assimilable N for the two nitrogen addition treatments, the final measured nitrogen level of the +AA juice was lower than the amount added, indicating that amino acid losses occurred during preparation of the +AA treatment. However, for all treatments, total assimilable N was within the recommended range of 200 to 500 mg/L for rapid and complete fermentation (Boulton et al. 1998).
For strain 254 D the volatile esters measured in this study began to accumulate at approximately the same time for all treatments; however, the rate of accumulation was different for each of the different esters. For example, addition of nitrogen from either ammonium or amino acids had little significant effect on the rate of ethyl acetate, hexyl acetate, and ethyl butyrate accumulation early in fermentation but significantly slowed the rate of production of ethyl hexanoate, ethyl octanoate, and ethyl decanoate during the exponential growth phase of fermentation. Total cell counts were not significantly different among treatments, though some differences in cell viability were observed (data not shown). At the end of the exponential phase, the +DAP treatment contained a greater percentage of viable cells than the control. This observation is likely an artifact of the method used to quantify cell viability, which is less accurate when cells are alive but unable to divide (Painting and Kirsop 1990). As sugar conversion slowed, no difference in cell viability was noted until the last 48 hr of fermentation, at which point the control contained a greater percentage of viable cells than the +DAP treatment. As previously noted, juices treated with DAP tended to complete fermentation more rapidly than those left untreated, which explains why cell viability dropped off more rapidly in the +DAP treated juices. Taken together, these observations imply that differences in biomass alone cannot explain the observed differenced in ester formation among treatments.
Addition of nitrogen differentially affected ester production for the different yeast strains, consistent with previous studies (Torrea et al. 2003). Only for strain 254 D (the “moderate” ester producer in the yeast strain experiment) were differences in ester production observed as a result of nitrogen addition. Since amino acids are precursors to some esters, particularly the acetate esters, it might be predicted that addition of amino acids to the juice would increase the maximum and final concentrations of these esters in the wines (Hernández-Orte et al. 2002). However, for strain 254 D in this study, addition of amino acids consistently resulted in fermentations with the lowest maximum and final concentrations for all esters. On the other hand, addition of DAP resulted in the highest maximum and final wine concentrations for the acetate esters and ethyl butyrate. For the three highest molecular weight ethyl esters (ethyl hexanoate, ethyl octanoate, and ethyl decanoate) either the control or +DAP treatment always produced wines with the highest maximum and final concentrations and typically there was no significant difference between these two treatments for these esters. It is possible that when juice is sufficient in nitrogen, as was the case for all treatments in these experiments, the excess amino acids are not used as a nitrogen source and feedback inhibition may prevent the amino acids from entering the pathway to ester formation (Kunkee et al. 1971). It is also possible that under the conditions of our experiments, the esters were not produced as a result of the degradation of amino acids but could have formed from biosynthetic processes. Biosynthesis would be more active when there is more ammonium available (Boulton et al. 1998), and as a result, the +DAP treatment would result in greater concentrations of esters, as was observed here. Further studies are needed to monitor the relative rates of biosynthesis, amino acid degradation, and ester hydrolysis throughout the fermentation and as a function of nitrogen availability from various sources. In addition, an improved understanding of the mechanisms by which nitrogen addition influences ester production for different yeast strains is needed.
Ammonium and amino acid utilization.
To further study the interactions between nitrogen utilization and ester production for the various strains, utilization of ammonium and amino acid nitrogen for the treatments in the nitrogen supplementation experiment was monitored. When nitrogen as either ammonium ions (DAP) or α-amino acids was added to the juice, nitrogen utilization varied. When DAP was added to the juice, ammonium utilization increased, amino acid utilization decreased, and volatile ester concentrations increased for the three yeast strains used in this experiment. It may be that, because of a large pool of ammonium nitrogen in the +DAP treatment, the amino acids were not used for cellular structures and growth but, rather, were available to produce high levels of secondary metabolites such as volatile esters.
These results once again suggest that ester formation observed in our study may have been via a biosynthetic mechanism rather than from amino acid degradation. In future studies, activities of key enzymes and levels of precursors need to be monitored to determine which of these, or other, possibilities is most likely.
When amino acids were added to the juice, utilization of the individual amino acids varied depending on the amino acid but was similar across the three different yeast strains. In cases where amino acid consumption decreased, feedback inhibition may have resulted in decreased utilization of these amino acids by the yeast (Kunkee et al. 1971). However, that is unlikely to have affected the production of esters since the only amino acids for which a decrease in consumption was observed in the +AA treatment were histidine and alanine, which are not known to be precursors to ester formation.
There were several cases in which the consumption of amino acids increased when amino acids were added to the juice but the production of corresponding esters did not change or actually decreased. One such example is leucine, a precursor to isoamyl acetate (Boulton et al. 1998); therefore it seems logical that addition of leucine to the juice should result in an increase in isoamyl acetate. However, when the concentration of leucine was increased (+AA treatment), the final concentration of isoamyl acetate was statistically similar to the control even though leucine utilization increased (Figure 2B⇑, 3B⇑; Table 6⇑). In addition, the rate of accumulation and the maximum concentration of isoamyl acetate were significantly lower than the control and +DAP treatments. Furthermore, the utilization of leucine decreased in the +DAP treatment, while the production of isoamyl acetate actually increased. In this case, since total assimilable nitrogen was not limiting and was within recommended ranges, the leucine and other amino acids could have been utilized for cellular processes that do not result in ester production. Although some previous studies have shown that amino acid utilization varies among yeast strains (Jiranek et al. 1995) and that addition of amino acids to juice can result in increases in concentrations of some esters (Herraiz et al. 1993, Hernández-Orte et al. 2002), most previous studies were done in low nitrogen media. In a recent study, addition of amino acids to Airen juice with sufficient free α-amino nitrogen (175 mg N/L) resulted in significant changes in concentrations of only two esters, ethyl lactate and ethyl 3-hydroxybutyrate (Hernández-Orte et al. 2005); however, there are few other studies available where the effects of amino acids on ester production were evaluated in a nitrogen rich media.
Interestingly, differences in ammonium and amino acid utilization were similar among the three yeast strains studied, even though ester production varied, indicating that ammonia and amino acid utilization alone cannot completely explain the observed effects of nitrogen source on ester production. Further comparisons with a higher number of yeast strains are needed.
Conclusions
The kinetics of volatile ester formation were significantly different for the seven strains of S. cerevisiae investigated here. There were no apparent correlations between the rate of accumulation of the esters and the maximum or final acetate ester concentrations. Similarly, there was typically no correlation between the maximum ester concentrations and final concentrations because the rates of decrease in concentration varied among strains.
In this study, nitrogen supplies were not limiting even in the control fermentations. However, significant effects on ester formation were observed depending on nitrogen source and yeast strains studied. For some, but not all yeast strains, addition of amino acids did not increase concentrations of any of the esters, while addition of ammonium increased concentrations of acetate esters and ethyl butyrate but not the higher molecular weight fatty acid ethyl esters (ethyl hexanoate, ethyl octanoate, ethyl decanoate).
Results point to important genetic differences among yeast strains in the expression and activity of the genes involved in ester formation and degradation. The significant interactions between yeast strain and the effects of nitrogen source and concentration on ester formation indicate that winemakers may be able to optimize ester formation by varying yeast strain and nitrogen supplementation regimens. However, further work examining the relationships between gene expression, enzyme concentrations, ester formation, and nitrogen utilization at all stages of the fermentation and for a wide range of yeast strains is needed.
Footnotes
Acknowledgments: This work was partially funded by a grant from the American Vineyard Foundation and the California Competitive Grants Program for Research in Viticulture and Enology.
We thank Lucy Joseph for technical assistance.
- Received March 2007.
- Revision received July 2007.
- Copyright © 2007 by the American Society for Enology and Viticulture
Literature Cited
Vol 58 Issue 4


Jump to section
Related Articles
Cited By...
More from this TOC section
Similar Articles
