


Abstract
Vine size and soil texture effects on yield components, soil, vine tissue, fruit composition, and wine sensory attributes were measured in an Ontario Riesling vineyard to clarify the potential basis for terroir. Sentinel (sample) vines were geolocated using global positioning systems. Geographic information systems delineated spatial variation in soil texture and soil vine tissue composition (1998) and in yield components, berry composition, and weight of cane prunings (vine size) over four years (1998 to 2002) from each sentinel vine. Vines were classified as large or small based on previous season vine size within each of two soil texture classes (clay and sand); fruit from these four categories was separated for winemaking; berry, must, and wine chemical compositional data were determined; and wine sensory descriptive analysis was conduced. Correlations were observed between soil texture and composition versus berry weight and potentially volatile terpenes (PVT). There were no consistent soil texture or vine size effects on berry, must, or wine composition. Large vine size increased berry titratable acidity (TA) (2001) and PVT (2002), decreased must pH (1999), and increased wine free volatile terpenes (2001). Sandy soil reduced wine TA and must PVT (1999) and increased berry TA and must soluble solids (2002). Vine size and soil texture did not consistently affect wine sensory attributes across vintages. High vine vigor decreased mineral aroma (1999) and citrus flavor (2001) and increased apple attributes (2001). Clay soil increased mineral aroma (1999 and 2001) and citrus attributes (1999) but decreased apple aroma (1999). Citrus aroma and petrol flavor increased in some vine size x soil texture combinations in 2002. Vintage and wine age had greater impacts on wine sensory attributes than vine size or soil texture.
- fruit composition
- global positioning systems
- geographic information systems
- precision viticulture
- sensory analysis
Old World viticulturists are sincere advocates of the “terroir” concept of defining wine quality, which in the simplest sense refers to the effects of vineyard location. In many terroir models, soil classification plays a primary role (Wilson 1998). The terroir concept as it pertains to wine quality first appeared in the 1980s (Seguin 1983). The definition has been refined to include physical and chemical aspects of soil, configuration of the terrain, mesoclimate, rootstock, cultivar, vine age, cultural practices, and grape berry microflora (i.e., yeasts and malolactic bacteria), vinification practices, and transport of the fruit and finished wines. Jourjon et al. (1991) redefined terroir by integrating mesoclimate characteristics (heat accumulation and precipitation) with soil classification. Terroir as described by Riou et al. (1995) closely parallels the New World concept of wine quality insofar that soil is recognized as a factor that impacts root growth, photosynthesis, and shoot growth.
Sensory descriptive analysis has been used to relate wine sensory attributes to soil type for describing differences in Cabernet franc wines produced from several sites in the Loire Valley (Asselin et al. 1983). Brown calcareous soils with appreciable chalk content produced wines with greatest aroma and flavor intensity. Further work using principal component analysis indicated that sensory differences between the wines were, surprisingly, greater between sites within appellations than between appellations and that attempted relationships between soil type and sensory variables were not attributable to any specific site feature (Morlat et al. 1984). Similarly, cluster analysis and other statistical tools were useful in defining adjacent viticultural zones in Spain based upon wine chemical composition (Larrechi et al. 1988).
The concept of terroir was redefined in the early 1990s to focus on soil water content in general and the availability of water to the vines during various parts of the growing season. Loire Valley soils previously associated with intense wine varietal character were found to be free-draining sandstones that provided mild water stress to the vines during fruit maturation (Penavayre et al. 1991). Conversely, sandy soils overlying clays allowed for unlimited water supply during the growing season, more vigorous vines, and less intense varietal character. Among the many soil types within the Loire Valley, the well-drained tuffeau chalk conferred the greatest varietal typicity upon Cabernet franc wines (Morlat and Asselin 1992). These authors acknowledged that the various soil types examined were associated with specific vigor levels in the vines and suggested that soil played an indirect role in the determination of varietal typicity and intensity. They furthermore related concentration of sugars and phenolics in the fruit at harvest with varietal typicity of Cabernet franc (Morlat and Asselin 1992).
The effects of soil and mesoclimate have been investigated widely in Europe but not in North America. Guinard and Cliff (1987) were successful in discriminating between Pinot noir wines produced from the Carneros, Napa, and Sonoma regions through the use of principal component analysis applied to sensory descriptive data. Similar techniques were applied to distinguish between commercial British Columbia Pinot noir and Chardonnay wines produced from different parts of the Okanagan Valley (Cliff and Dever 1996). In Ontario, subappellations were proposed based on sensory descriptive analysis of commercial Riesling (Douglas et al. 2001), Chardonnay (Schlosser et al. 2005), and Bordeaux red winegrape cultivars (Kontkanen et al. 2005).
The specific impact of site on flavor compounds and wine sensory quality has not been widely addressed. Rodopoulo et al. (1974) indicated that Crimean muscat wines contained higher terpene concentrations than Armenian counterparts. Di Stefano and Corino (1986) found small site-based differences in terpene concentrations of Moscato bianco and Moscato giallo grapes and wines from several locations in Piemonte and Val d’Aosta in Italy. In these cases, and in Loire Valley, Italian, and Spanish studies, both soil and mesoclimate varied simultaneously. Differences in both terpene concentration and wine sensory attributes were found in Gewürztraminer and several early-season muscat cultivars that could be attributed to mesoclimate only (Reynolds and Wardle 1997), since soil type and viticultural practices were kept constant.
The use of remote sensing techniques and geographic information systems (GIS) to study vineyards is a relatively recent development. GIS was used to map soil type and rootstock in 2,000 ha of the Loire Valley, but relationships between soil and wine varietal typicity were not clarified (Morlat and Asselin 1992). A similar study was made of the vineyards of the Rheingau (Hoppman 1999). In California GIS was used to map viticultural regions in terms of phylloxera damage based on leaf reflectance (Baldy et al. 1996). These techniques were also used to relate yields and soluble solids of Concord (Davenport et al. 2001) and to distinguish between high and low vigor “management zones” in Cabernet Sauvignon and Zinfandel vineyards in California (Greenspan and O’Donnell 2001) and in vineyards throughout Australia (Bramley 2005, Bramley and Hamilton 2004).
Wine composition is determined primarily by vineyard factors such as site (mesoclimate), soil, and canopy management. Relationships exist among canopy management, flavor compounds in grape berries, and intensity of wine varietal character, as well as among mesoclimate, flavor compounds, and wine sensory attributes with soil type held constant. It has become somewhat of an academic controversy, whereby European viticulturists maintain that soil is a primary determinant of wine composition, whereas their New World counterparts consider soil as a medium that impacts vine growth and vigor, and therefore the skill by which this vigor is accommodated determines wine composition. Our intent was to address this controversy through the use of global positioning systems (GPS) and GIS analysis techniques.
Ontario vineyards are often located on sites that contain heterogeneous soil types. We hypothesized that soil texture plays a minor role in the determination of yield components, fruit composition including aroma compound concentration, and wine sensory attributes and that vine vigor, crop size, and fruit environment play the major roles. This hypothesis was tested in a related study through a series of experiments in commercial Chardonnay vineyards in the Niagara Peninsula of Ontario (Reynolds and de Savigny 2001), with two major objectives: first, to determine the impact of soil texture on yield components, fruit composition, and wine sensory attributes with mesoclimate and vine size kept constant and, second, to compare the comparative magnitude of effects of soil and vine size on wine varietal typicity. This study was an attempt to resolve this continuing question of direct soil effects by bringing forward evidence of the independent effects of soil and vine vigor on yield components, berry, must and wine composition, and wine sensory attributes of Riesling. Cultivars such as Riesling contain substantial concentrations of monoterpenes (Reynolds et al. 1994, 1996), so these aroma compounds were specifically chosen as indicators of fruit maturity and as variables to associate with commensurate wine sensory attributes. Elucidation of unique flavor profiles from specific vineyard blocks could lead to unique cultural practices. Such knowledge could have significant consequences for choice of future vineyard sites, cultural practices, grape cultivars, and root-stocks used in New World areas such as the Niagara Peninsula. There might also be implications from this type of study for precision viticulture, if spatial variability in vine vigor and yield were found to be highly correlated, and if spatial variation in yield was found to be consistent from year to year within individual vineyard blocks.
Materials and Methods
Experimental design.
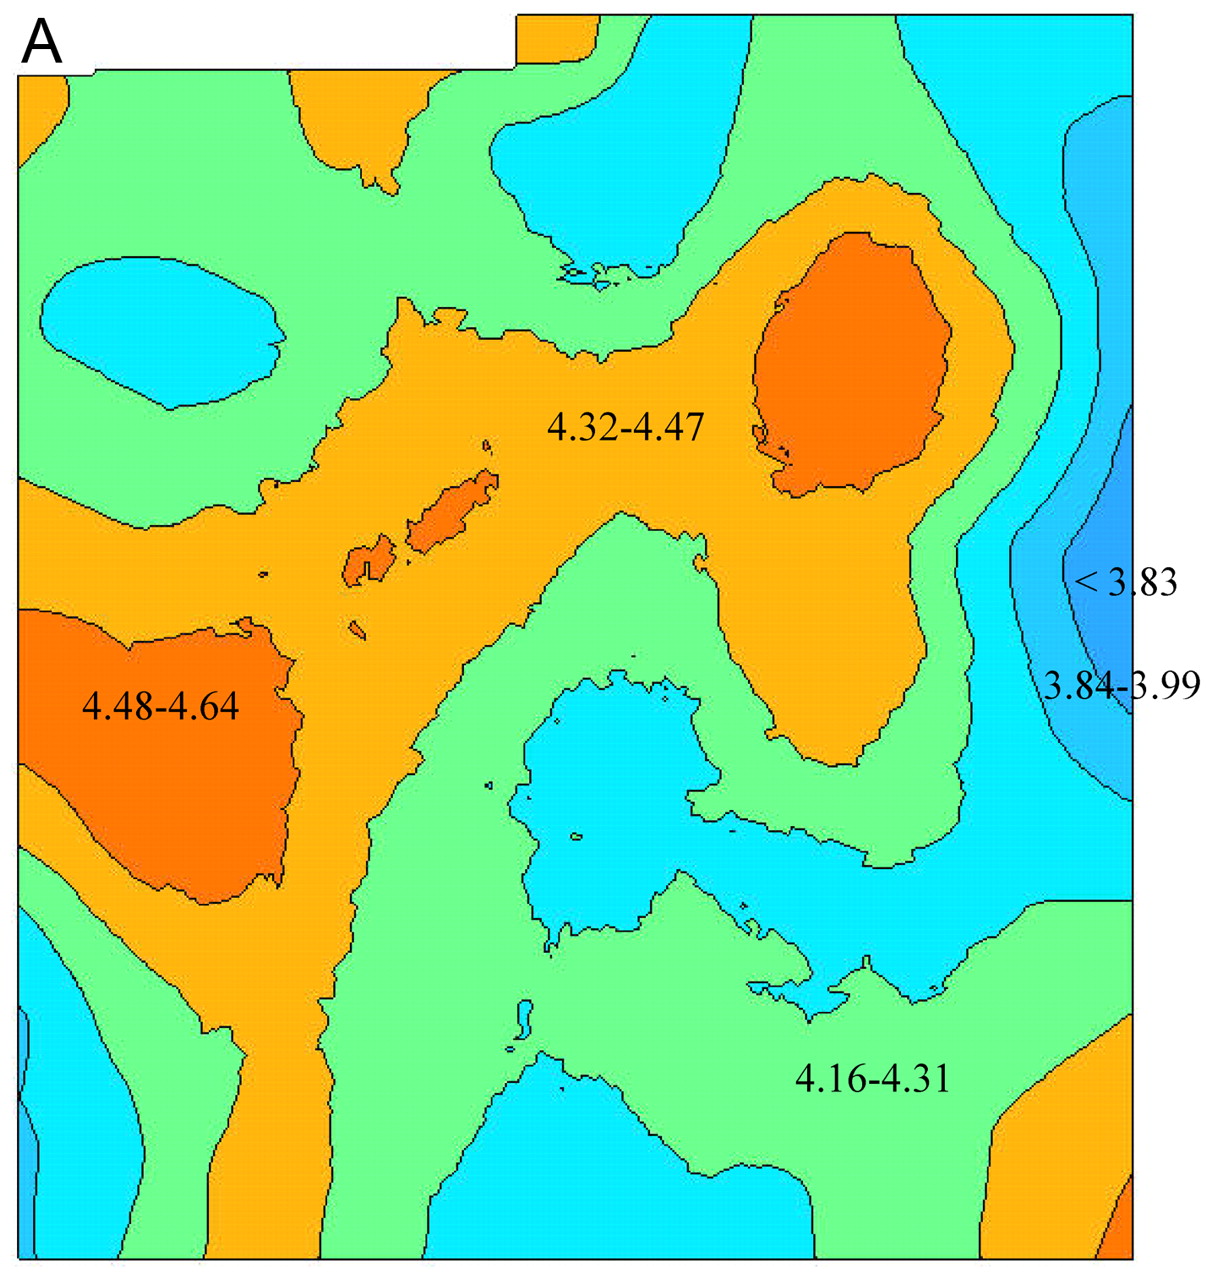
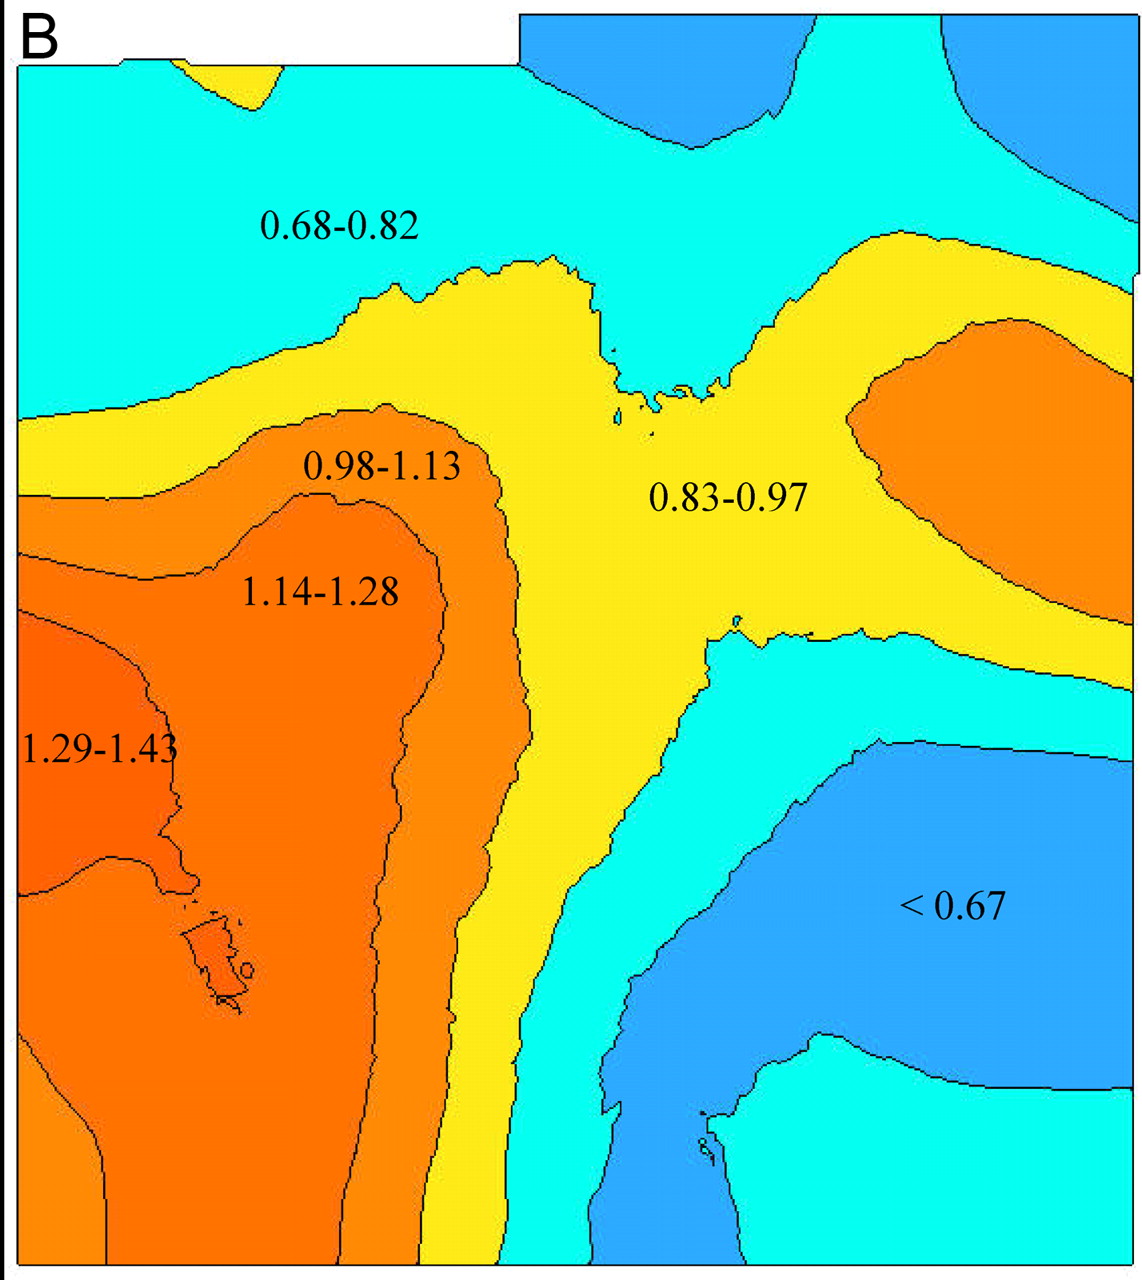
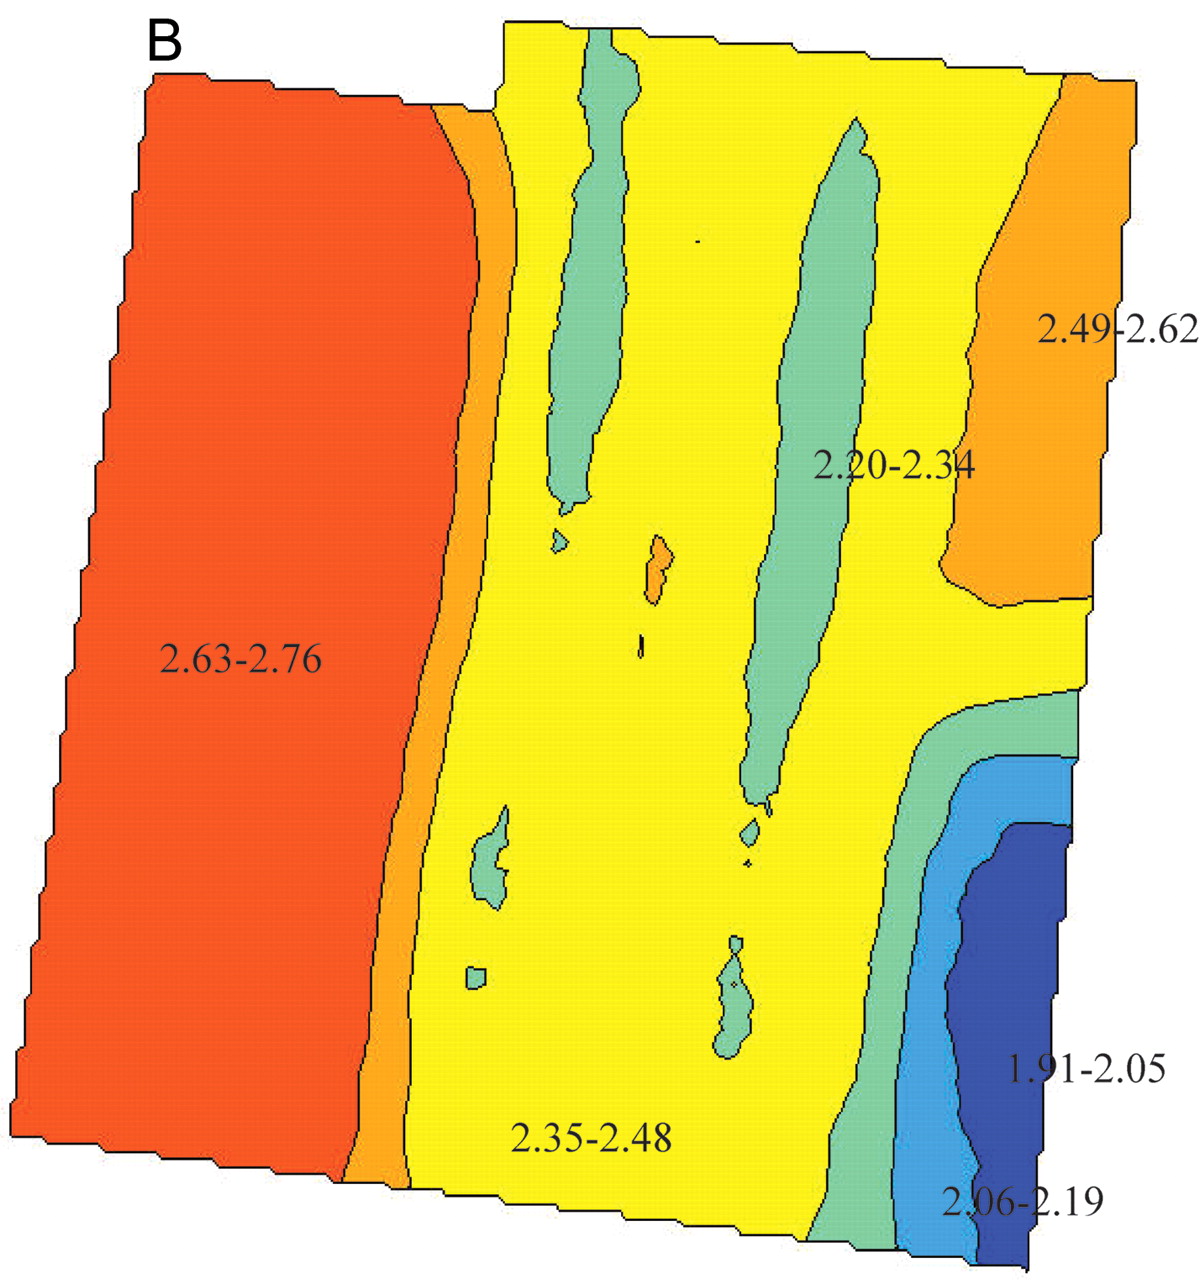
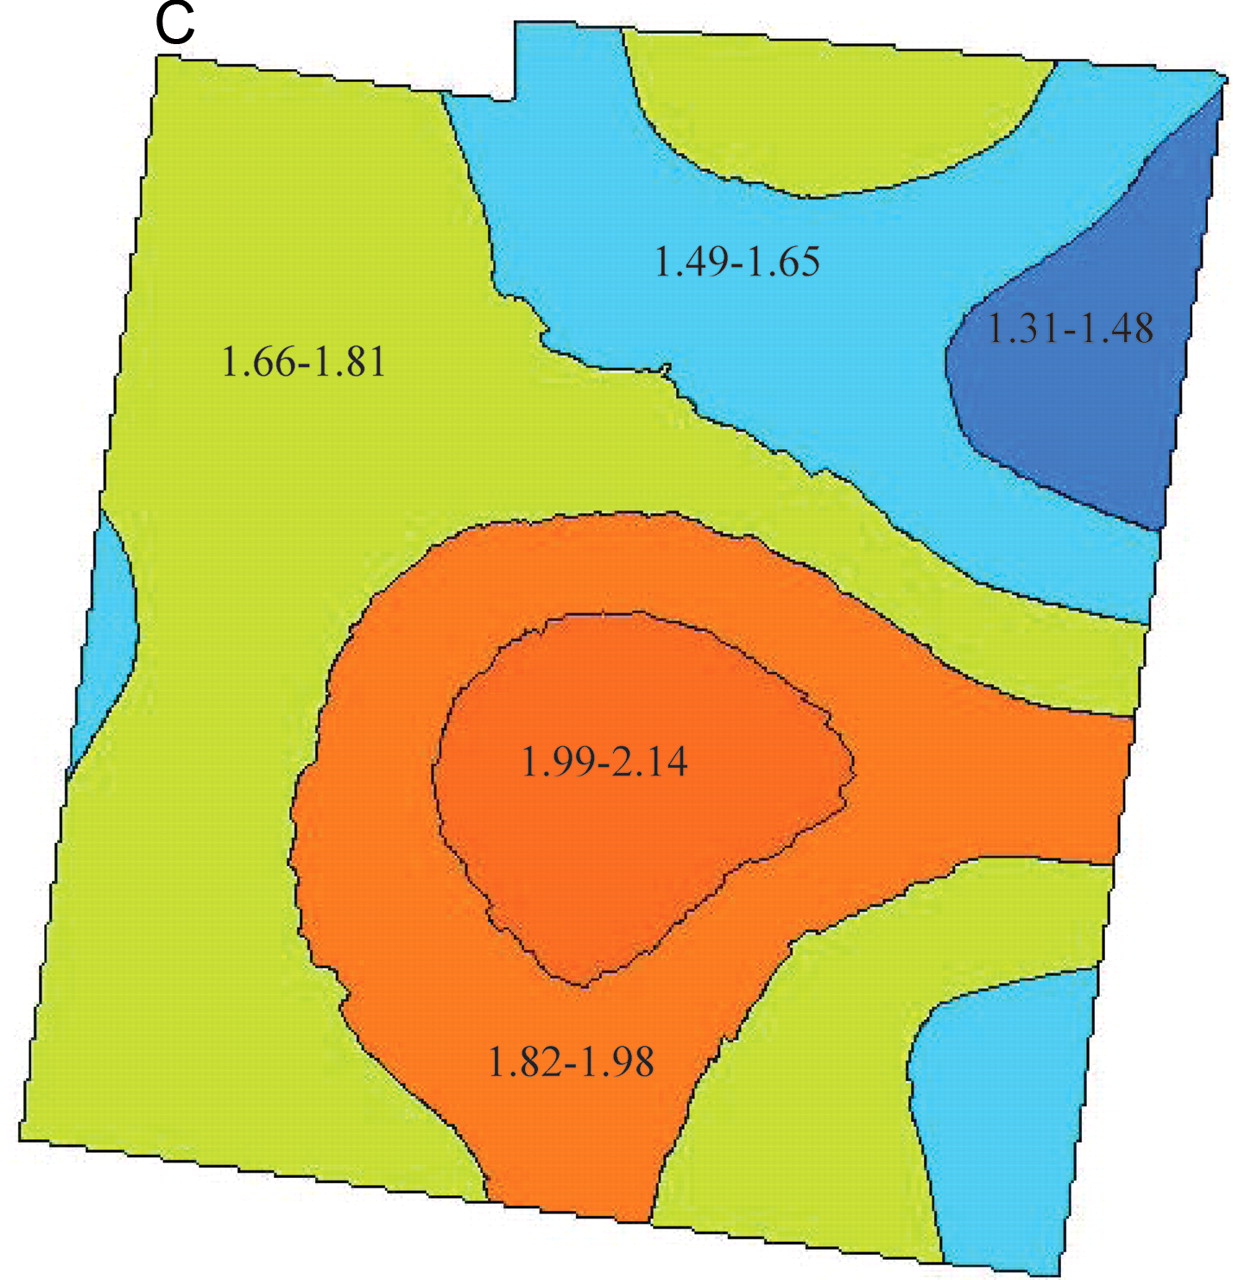
Investigations were conducted in the 4-ha St. Urban Vineyard, Vineland Estates Winery, Vineland, ON, between 1998 and 2002. Soils were a combination of two Chinguacousy clay loam series (CGU8, CGU10; gleyed brunisolic grey-brown luvisol), composed of clay loam till parent material, with natural drainage ranging from moderately well-drained to imperfect (CGU8) through imperfect to poor (CGU10) (Kingston and Presant 1989). In general, soil was deficient in Mg and B (Table 1⇓). The vines were Riesling clone 21B Weis, grafted to SO4 and planted in 1987. Vines were trained to a pendelbogen (low head, arched cane) system, pruned to two ~12-node canes plus two renewal spurs, and spaced at 1.2 x 2.4 m (vine x row). Floor management was permanent sod with ~1-m herbicided strips under the vines. A global positioning system (GPS) at <1 m accuracy was used in May 1998 to delineate the shape and size of the vineyard and to geolocate each of 215 sentinel vines used for data collection (Figure 1⇓). These vines were selected based upon a grid sampling pattern of 10 m x 18 m (within row x between row). A GBX-12R GPS unit (CSI-Wireless, Calgary, AB) was used in conjunction with an MGL-3 antenna, receiving beacon differential on frequency 322 (Youngstown, NY). In total, 21 of the 82 overall rows were used for data collection. Soil samples (~200 g) were collected using a 3 cm x 75 cm (diameter x length) soil probe at or near each sentinel vine (~20 cm from the trunk) in Sept 1998. Petiole samples (~50 g) were collected in August 1998 from positions adjacent to basal clusters on each sentinel vine. Geographical information system (GIS; MapInfo and Vertical Mapper, Northwood GeoScience, Ottawa, ON) analyses were used to determine soil texture spatial distribution (percent clay, sand, and silt) (Table 1⇓), and detailed soil maps of the vineyard were thereby created (Figure 2⇓). The inverse distance weighting interpolation algorithm was used to construct the grid files. Spatial distribution of soil texture showed that the southeast corner of the vineyard had the highest clay content (Figure 2C⇓). Following pruning of each sentinel vine and determination of weight of cane prunings, those vines one standard deviation above or below the mean weight of cane prunings were designated as “large” or “small,” respectively. Trunk diameter was measured using calipers immediately above the graft union and was used as an estimate of vine size following the 1998 season. Pruning weight ranges and means (± SD) were 0.1 to 2.4 kg, mean 0.9 ± 0.33 kg (1999 to grown); 0.1 to 2.2 kg, mean 0.7 ± 0.39 kg (2000); 0.1 to 2.1 kg, mean 0.7 ± 0.35 kg (2001); 0.1 to 1.6 kg, mean 0.7 ± 0.28 kg (2002). Prior to harvest 1999 to 2002, small and large vines on both sandy sections (>23.3% sand) and clay sections (<18.3% sand) of the vineyard were identified as study vines in four distinct categories that were factorial combinations of two levels of vine size (high and low) and two soil textures (clay and sand). Two replicate vine groups of each category were designated and chosen to span the entire vineyard to avoid bias because of elevation, shading from adjacent woodlots, or other positional confounding effects unrelated to soil texture.
Soil and petiole analysis.

Sampling sites and elevations (m), St. Urban Vineyard, Vineland, Ontario.


Spatial distribution of soil texture variables (%): (A) sand, (B) silt, (C) clay.
Soil and petiole composition.
Soil samples were oven-dried for 2 days at 35°C, pulverized, and sieved to remove particles >2 mm diam. Soil P was extracted using a 0.5 M sodium bicarbonate solution; K, Ca, and Mg were extracted using 1N ammonium acetate; Cu, Fe, and Zn were extracted with 1% diethylenetriaminepentaacetic acid; soil Mn was extracted using 0.1 N phosphoric acid; and soil B was extracted using boiling water (CSSS 1993). Subsample extracts were retained for available elemental analysis (P, K, Ca, Mg, Mn, Fe, Cu, Zn, B) using an Optima 3000 inductively coupled plasma (ICP) emission spectroscopy (Perkin-Elmer, Shelton, CT). Organic matter (OM) analysis was performed using standard colorimetric methods (CSSS 1993). Cation exchange and base saturation were calculated from soil K, Ca, and Mg values. Petiole samples were dry-ashed at 550°C and extracted with concentrated hydrochloric and nitric acids (CSSS 1993). Samples were then analyzed for total N, P, K, Ca, Mg, Mn, Fe, Cu, Zn, and B using ICP as previously described. All soil and petiole analyses were carried out at Agri-Food Laboratories (Guelph, ON) using derived methods (CSSS 1993).
Yield components.
One day prior to harvest, 100-berry samples were taken randomly from each sentinel vine. Harvest dates were chosen at the discretion of the winery: 5 and 6 Oct 1998; 17 and 18 Sept 1999; 25 and 26 Sept 2001; and 7 and 8 Oct 2002. Grapes were harvested commercially before data collection in 2000. Fruit from the two replicate vine groups for each soil texture x vine vigor category was retained for winemaking. Each berry sample was placed in a labeled zip-lock bag and frozen at −25°C for further analysis. Fruit from each vine was harvested and weighed using an electronic scale. Clusters were counted and mean cluster weight was calculated. Berries per cluster was estimated from the means of cluster weight and berry weight.
Winemaking.
The grapes from each category replicate were crushed and destemmed in the CCOVI pilot winery using an electric crusher/destemmer into 20-L plastic buckets, 50 mg/L of SO2 was added, and crushed grapes were given 24 hr pomace contact at 4°C. Following skin contact, the musts were pressed to 2 bar of pressure using a water bladder press. Duplicate 250-mL must samples were taken from each replicate at pressing and placed in the −25°C freezer for further analysis for soluble solids, pH, titratable acidity (TA), and monoterpenes. The juice was returned to 4°C for settling, racked into 18-L glass carboys, allowed to reach room temperature (18°C), and inoculated with Saccharomyces cerevisiae strain VL1 (Lallemand Inc., Montreal, QB) at 5 g/18 L. Three days into fermentation, the carboys were transferred to a 15°C room to reduce fermentation rate and to prevent loss of volatile compounds. The wines were fermented to dryness, removed from the 15°C room, and racked into clean carboys. Each wine was sulfited to 50 mg/L SO2 and transferred to a −2°C chamber to undergo cold stabilization. Thereafter, the wines were racked and stored for ~3 months at −2°C until bottling. Wines were filtered through 0.45-μ pads and 0.2-μ cartridge filters at bottling. Bottled wines were stored at 12°C.
Berry, must, and wine composition.
The frozen berry samples were weighed using an electronic scale (model SB3200; Mettler Toledo Canada, Mississauga, ON) to determine berry weight and separated into two portions: 100 g for monoterpene analysis and ~20 to 50 g for soluble solids, TA, and pH determination. Berries designated for terpene analysis remained frozen and were returned to the −25°C freezer, while the remainder was thawed at room temperature in 100-mL beakers. Thawed samples were heated to 80°C for 1 hr using a Isotemp 228 water bath (Fisher Scientific, Ottawa, ON) to dissolve any precipitated tartaric acid. The berry samples were cooled, homogenized in a juicer (model 500; Omega Products, Harrisburg, PA), and clarified using an IEC Centra CL2 Centrifuge (International Equipment, Needham Heights, MA) to remove large particles. Soluble solids were measured as Brix using a temperature-compensated Abbé bench refractometer (model 10450; American Optical, Buffalo, NY), while pH was measured using an Accumet pH/ion meter (model 25; Fisher Scientific). Titratable acidity was measured on 5-mL samples that were titrated to an 8.2 endpoint with 0.1 N NaOH using a PC-Titrate autotitrator (model PC-1300-475; Man-Tech Associates, Guelph, ON).
As with the berry samples, must samples were thawed at room temperature. An ~50 mL subsample was heated to 80°C for 1 hr in a water bath and allowed to cool. The soluble solids, pH, and TA were measured using the same methods described for berry samples. The remaining 200 mL was retained at −25°C for subsequent monoterpene analysis. TA and pH of all wine samples were measured as per berry and must samples. Fifty-mL samples of wine were used to determine ethanol concentration with an ebulliometer (J. Salleron Dujardin, Paris, France) calibrated to atmospheric pressure every hour using 30 mL deionized water.
Monoterpene analysis.
Berries and musts.
Determination of monoterpene concentration in fruit, must, and wine was based on the method described by Dimitriadis and Williams (1984) as modified by Reynolds and Wardle (1989), and consisted of distillation of terpenes in free and bound fractions, followed by colorimetric analysis. Frozen berry samples (100 g) were thawed at room temperature in 250-mL beakers. Immediately before distillation, the sample was homogenized using a commercial laboratory blender. Must samples were likewise thawed at room temperature. Sample pH was adjusted to between 6.6 and 6.7 by addition of 20% NaOH. Distillation was carried out using an ensemble consisting of a 2-L steam generation flask, a distillation flask (containing the sample), and a Friedrich condenser (Lurex, Vineland, NJ). Steam was generated using a submersible heating coil connected to a variable transformer (model 3PN1010B; Staco Energy, Dayton, OH), which controlled the temperature and thus the speed of distillation. The condenser was kept cold by circulated tap water that ran through a 5-mm diam copper coil placed in an ice-water bath immediately before entering the condenser. The first fraction containing free volatile terpenes (FVT) was collected within 10 to 15 min into a 25-mL volumetric flask held in an ice bath. Exactly 10 mL of 50% H3PO4 was then added to the distillation flask to adjust the pH to ~2.0. The resultant potentially volatile terpene (PVT) fraction was then collected within the next 15 min into a 50-mL volumetric flask held in an ice bath. The flasks containing the condensates were sealed and placed in 4°C until colorimetric analysis. The FVT and PVT fractions from berry homogenates and musts and the PVT fraction from wines were treated in the same manner throughout the distillation process.
FVT analysis of wine.
Monoterpene analysis of all wines occurred at the same time as sensory analysis so that relationships might be drawn between chemical and sensory data. At this point, the 1999, 2001, and 2002 wines were 3.5, 1.5, and <1 year old. The PVT fraction from the wines required no unique procedures before analysis. However, the FVT fraction from wine required an additional procedure to remove interfering compounds from the aliquot. Because of the presence of ethanol and SO2 in the wines, the FVT fractions contained indeterminate concentrations of both of these compounds along with the FVT. SO2 did not interfere with the colorimetric analysis, whereas ethanol did interfere (J. Schlosser, 2003, unpublished data). Other potential interfering compounds in wine FVT analysis include trans-hex-2-en-1-ol (Dimitriadis and Williams 1984), 2-hexen-1-al, and other unsaturated C6 compounds (Reynolds and Wardle 1997). Therefore, all FVT distillates from wine were subjected to a carbon column cleanup to remove ethanol and possible other interfering substances before colorimetric analysis. Sep-Pak Plus C Cartridges (Waters, Bedford, MA) were attached to Teflon tips in the top of a vacuum chamber, and a reservoir with stopcock was attached above each cartridge. The columns were charged by passing 5 mL distilled water through them at <5 psi of vacuum pressure, followed by successive 5 mL fractions of methanol and distilled water. The stopcock was then closed, and the 25 mL FVT distillate was added to each reservoir. The distillate was diluted by the addition of 50 mL distilled water. The diluted sample was then passed through the column under ≤5 psi of pressure and the stopcock was closed. The FVT adsorbed onto the column was washed into 25-mL volumetric flasks using 5 mL methanol and made up to volume with distilled water for ultimate colorimetric analysis. A separate set of linalool standards for subsequent colorimetric analysis was prepared in 20% methanol to account for this methanol column wash.
Colorimetric analysis.
An aqueous stock solution of 1 g/L linalool was made, and 0.5, 1.0, 2.0, 5.0, and 10.0 mg/L standard solutions were made using the stock solution to construct a standard curve. Duplicate 10-mL samples were taken from each standard and distillate and were placed in 20-mL glass test tubes. These were placed in an ice-water bath before adding 5 mL 2% vanillin solution in concentrated sulfuric acid (w/v) to each. Tubes were vortexed and heated at 60°C for 20 min in a Fisher Scientific Isotemp 205 water bath. Tubes were cooled to 25°C, and the absorbance was read at 608 nm within 15 min using a Pharmacia Biotech Ultrospec UV/visible spectrophotometer (model 1000E; Amercham Biosciences, Little Chalfont, UK).
Wine sensory descriptive analysis.
Sensory analysis was performed on the 1999, 2001, and 2002 vintage wines in a series of tastings between January and June 2003. The first of three taster training sessions consisted of a subset of wines from the three vintages, during which the judges developed aroma, flavor, and mouthfeel descriptive terms. The terms that most judges found across all wines were chosen, aroma standards were produced to represent the chosen attributes (Table 2⇓), and they were presented during a second training session to familiarize the judges with these standards. In the third and final training session before formal tasting, the standards were presented again, along with the original subset of wines and a prototype scorecard, to ascertain the accuracy and intensity of each standard and to verify that each panelist was detecting each attribute in a similar order of magnitude.
Preparation details of aroma standards used for sensory evaluation of Riesling wines, 1999, 2001, and 2002.
The formal tasting sessions took place in the sensory evaluation laboratory at CCOVI. Each of the 12 judges had an individual cubicle and assessed all wines under red light. Each judge was presented with a total of eight wines in standard ISO glasses that were coded and randomized in two flights of four wines in each of six sessions. All wines presented were evaluated for aroma, flavor, and mouthfeel attributes; data were analyzed using Compusense 5.0 software (Compusense, Guelph, ON). There was a minimum 3-min break between flights to reduce palate fatigue. Over six sessions, judges evaluated each wine in duplicate.
Statistical analysis.
The SAS statistical package (SAS Institute, Cary, NC) was used for analysis of the results of all portions of the experiment. Analysis of variance (ANOVA; PROC GLM) was used to analyze soil texture and vine vigor effects on berry weight, berry, must and wine composition, and wine sensory attribute, and to detect differences due to vine size, soil type, or their interaction. Results of sensory evaluation were also subjected to principal component analysis (PCA). Correlations were also determined (PROC CORR) between soil composition, soil texture, yield components, and berry composition for all vintages, and PCA was conducted on the 1998 data set to elucidate possible relationships among soil, petiole, yield, and berry compositional variables. MapInfo and Vertical Mapper (Northwood GeoScience, Ottawa, ON) were used to construct maps of soil texture and composition, petiole composition, yield components, vine size, and berry composition (including FVT and PVT). These maps were used to examine spatial variation for selected variables in each season and to compare spatial relationships between correlated variables.
Results
Relationships among soil and vine characteristics.
Correlations among the many variables were numerous and can be placed into two groups: those that support the initial hypothesis that soil texture and/or vine size are critical to the determination of berry composition, and hence, terroir, and those that support an alternative hypothesis that specific aspects of soil composition are determinants of terroir. In 1998, yield and clusters per vine were not correlated with any soil or petiole variables, although cluster weight displayed three positive correlations (soil B; petiole N, Ca) and two negative variables (petiole Zn, Fe), while berries per cluster positively correlated with soil pH, B, CEC and inversely correlated with % sand and soil Mn (Table 3⇓). Berry weight displayed positive correlations with six soil and petiole variables (% sand, OM, soil Mn, Fe; petiole N, Ca) and seven inverse variables (% clay, soil pH, Ca, CEC, % base saturation as Ca; petiole K, Mn). Only three correlations were observed between berry composition variables and soil/petiole composition: both soluble solids and pH were inversely correlated with petiole Mn, while pH was also positively correlated with petiole N. PVT was positively correlated with % clay, soil pH, P, K, Ca, Cu, B, CEC, and petiole B and inversely with soil Mn, Fe, and petiole Mg, Zn, Fe. No variables were correlated with vine size in 1998 (data not shown). Most of these correlations had absolute r values ≤0.3, and these putative relationships were considered tenuous. However, the relatively strong negative correlation between % clay and berry weight is worthy of further interpretation.
Correlation coefficients and p values for soil and petiole composition, yield components, and berry composition variables, 1998.
Principal component analysis of the 1998 data accounted for 21.3% (PC1) and 11.9% (PC2) of the total variance in the data set (Figure 3⇓). Yield components such as yield per vine, clusters per vine, and berry weight were positively loaded along PC1 and were closely aligned with % sand, OM, and % base saturation as Mg and K, several soil elements, and petiole N and B. These were oriented roughly 180° from soluble solids, % clay, soil pH, CEC, % base saturation as Ca, soil Ca, and petiole P, K, Cu, Mn, and Zn. Berry TA, FVT, and PVT were loaded positively along PC2 and aligned with cluster weight, berries per cluster, soil P, K and B, and petiole Ca, whereas eigenvectors representing berry pH, % silt, and petiole Mg and Fe were oriented 180° from these variables.

Distribution of principal components of soil, petiole, yield, and fruit composition variables along PC1 (21.3% of variance) and PC2 (11.9% of variance), 1998.
The 1999 data also displayed few strong correlations between yield components and the soil and petiole variables from the previous season (Table 4⇓). Yield was not correlated with any variable; clusters per vine was inversely correlated with petiole Mn; while cluster weight showed a weak negative correlation with soil K. Again, berry weight displayed numerous correlations, some consistent with the previous season. Three of these were positive (soil Mn, Fe, % base saturation as Mg) and five were negative (% clay, soil pH, Ca, CEC, % base saturation as Ca). Berry composition was primarily associated with soil texture: soluble solids was correlated with % clay and soil pH and inversely correlated with % silt and soil Fe; while TA was correlated with % sand and soil Zn, and negatively with % clay and soil pH. Only two inverse correlations were found among FVT and the various soil and petiole variables (petiole Ca, Zn). There were three positive correlations for PVT (% sand, soil Mn, petiole Mg) and several inverse correlations (% clay, soil pH, P, Ca, B, CEC, % base saturation as Ca). Vine size again showed no correlative relationships. Many of these putative relationships were considered tenuous because of the relatively low absolute r values, although those between soluble solids, TA, and soil texture were noteworthy.
Correlation coefficients and p values for soil and petiole composition (1998) and yield components and berry composition variables (1999) of Riesling.
In 2001, yield components were more correlated with soil and petiole variables than in previous seasons (Table 5⇓). Yield was positively correlated with soil Mn and petiole Mg and inversely correlated with petiole K and B. Clusters per vine was positively correlated with soil Mn, % base saturation as Mg, and petiole Mg and inversely with soil pH, Ca, CEC, % base saturation as Ca, and petiole K. Cluster weight was positively correlated with petiole N and Ca and inversely with % base saturation as Mg, while berries per cluster were correlated with soil K and petiole N, and inversely with % sand. Berry weight continued to be correlated with soil and petiole variables, including two positively (petiole N and Ca) and four negatively (soil OM, K, Mg; petiole Mg). Soluble solids displayed weak positive correlations with soil OM and petiole B; TA was positively correlated with petiole Ca and inversely with petiole K; and pH displayed four positive correlations (soil OM; petiole N, K, B) and an inverse relationship with soil K. Vine size was positively correlated with petiole N and Ca, inversely correlated with soil Mg, and showed positive correlations with yield, cluster weight, and berry weight.
Correlation coefficients and p values for soil and petiole composition (1998) and yield components and berry composition variables (2001) of Riesling.
By 2002, the petiole data collected in 1998 were not considered sufficiently valid for use in determining correlations with current season yield and fruit composition variables, and they were therefore omitted from the analysis. Yield and clusters per vine showed positive correlations with soil variables organic matter, Zn, Cu, Fe, and B, while clusters per vine additionally displayed a correlation with % sand and two inverse correlations with soil Ca and % base saturation as Ca (Table 6⇓). Berry weight was correlated with soil Mn and Fe and inversely to several variables (% clay, soil pH, P, K, Ca, CEC, % base saturation as Ca). Soluble solids was correlated with % sand, soil K, and % base saturation as K and inversely with % silt. TA was correlated with soil Zn and Fe and inversely with % clay, while pH was correlated with % sand and soil Mn and inversely with soil Cu, B, and CEC. FVT showed only one weak inverse correlation with soil K, but PVT was correlated with five variables (soil pH, P, Ca, CEC, % base saturation as Ca), inversely with seven (soil OM, Mg, Zn, Mn, Cu, Fe, % base saturation as Mg), and negatively correlated with yield, clusters per vine, and berry weight. FVT and PVT were not correlated with any soil texture variable or with vine size. Vine size displayed correlations with soil Fe and inverse relationships with soil Ca, CEC, and % base saturation as Ca, as well as positive correlations with the various yield components.
Correlations between soil composition and texture (1998) and yield components and berry composition (2002) of Riesling.
Spatial and temporal relationships among variables.
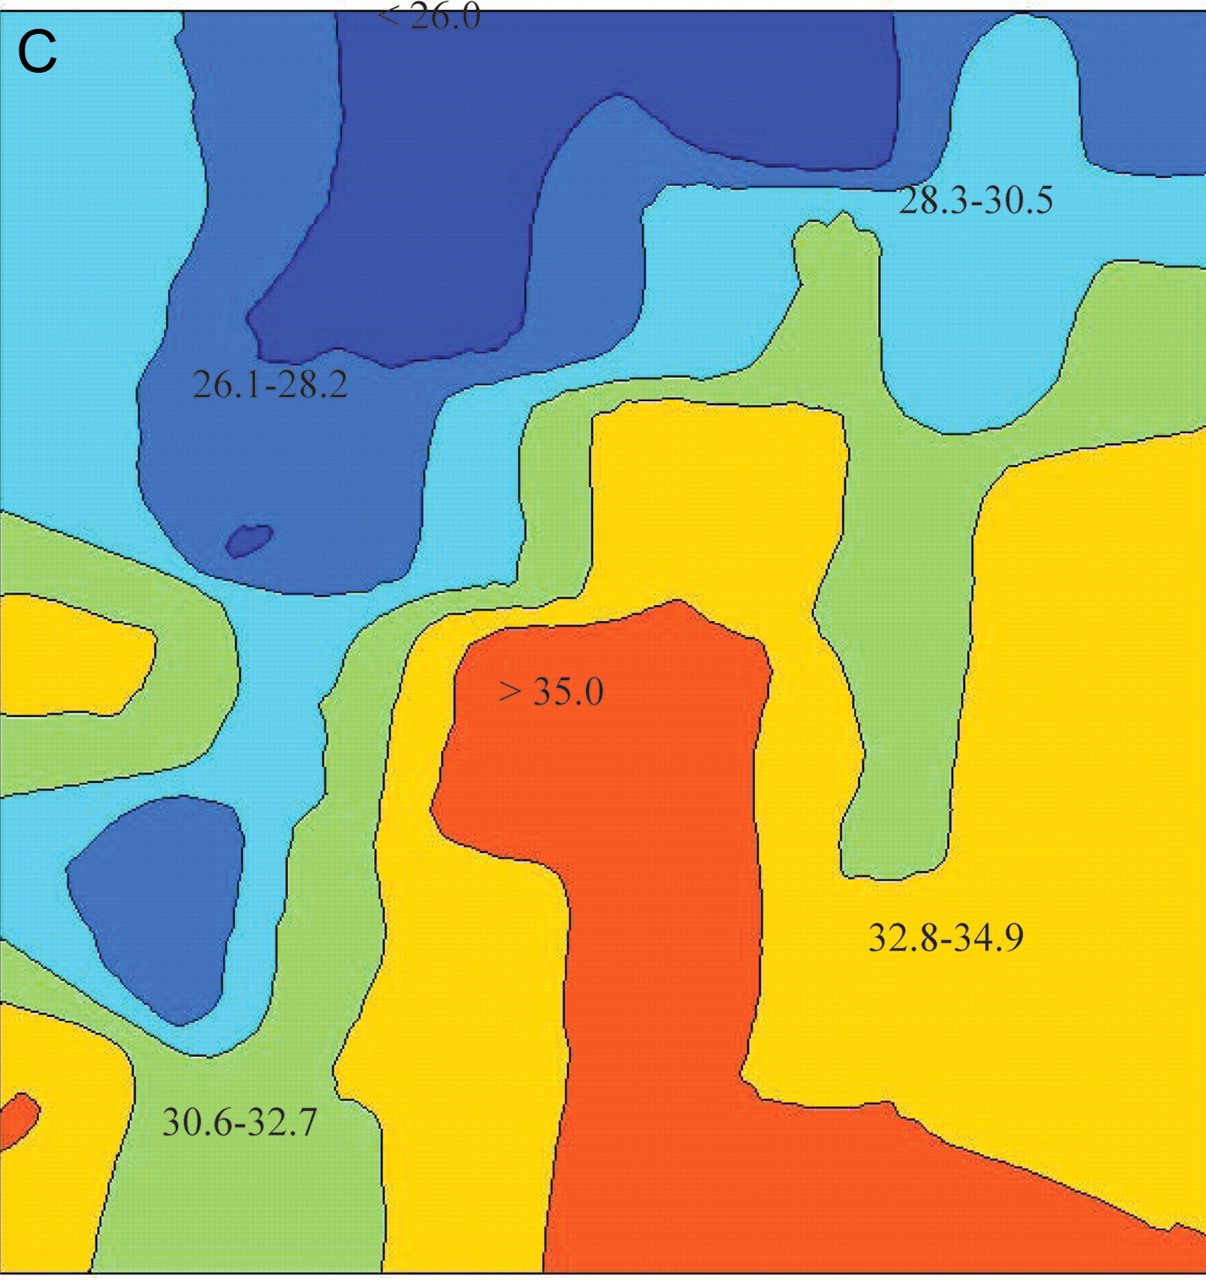
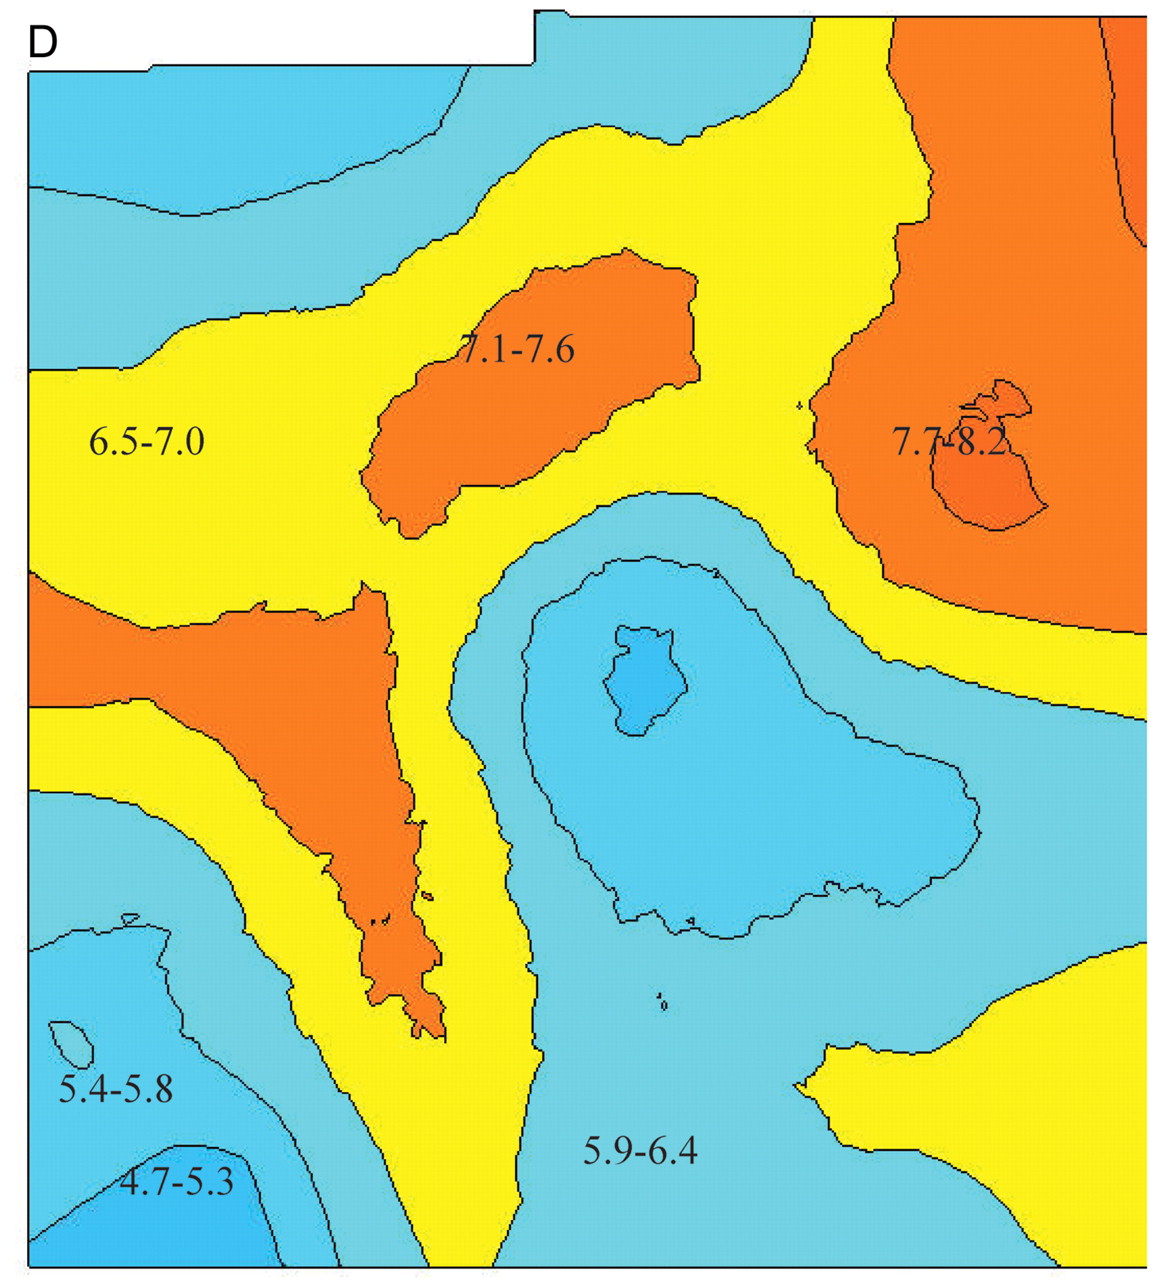
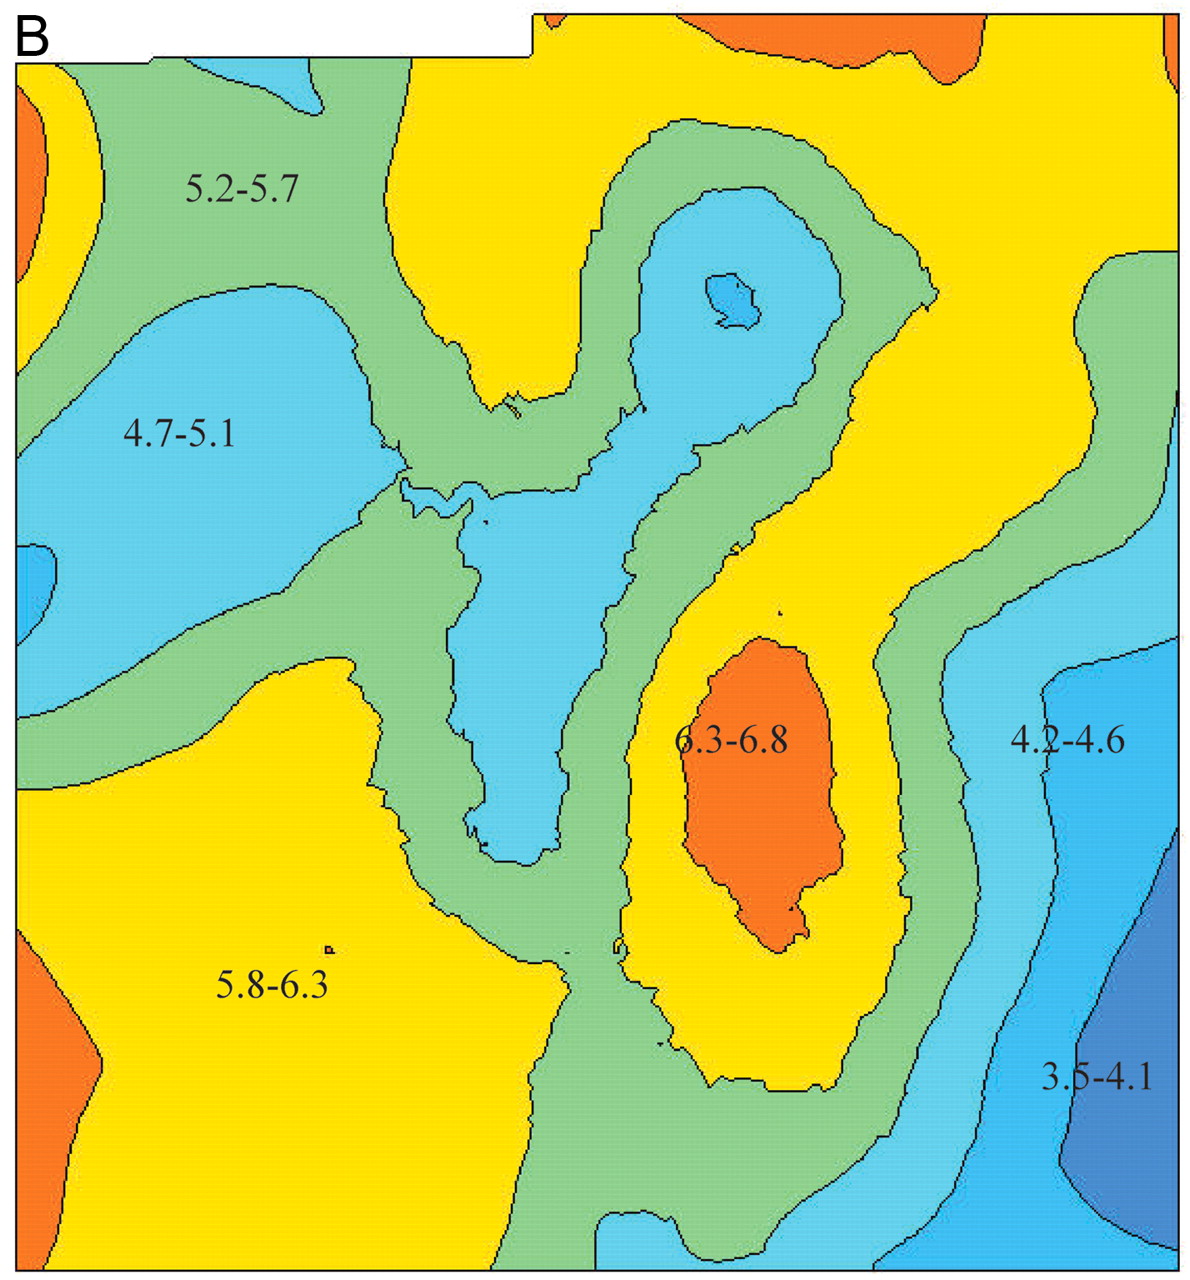
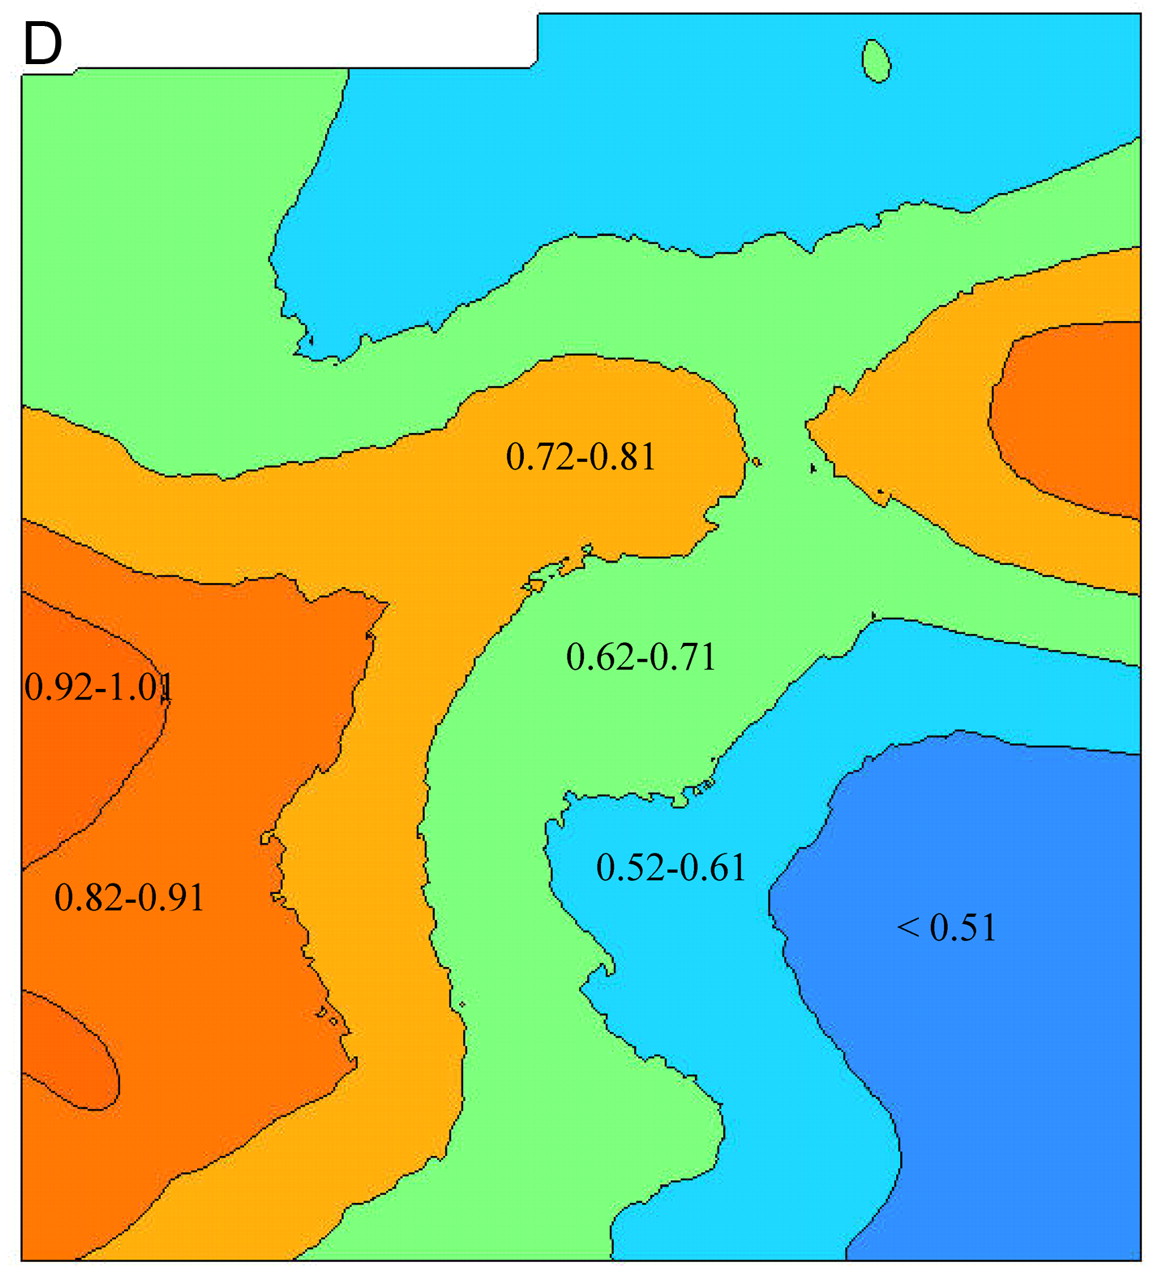
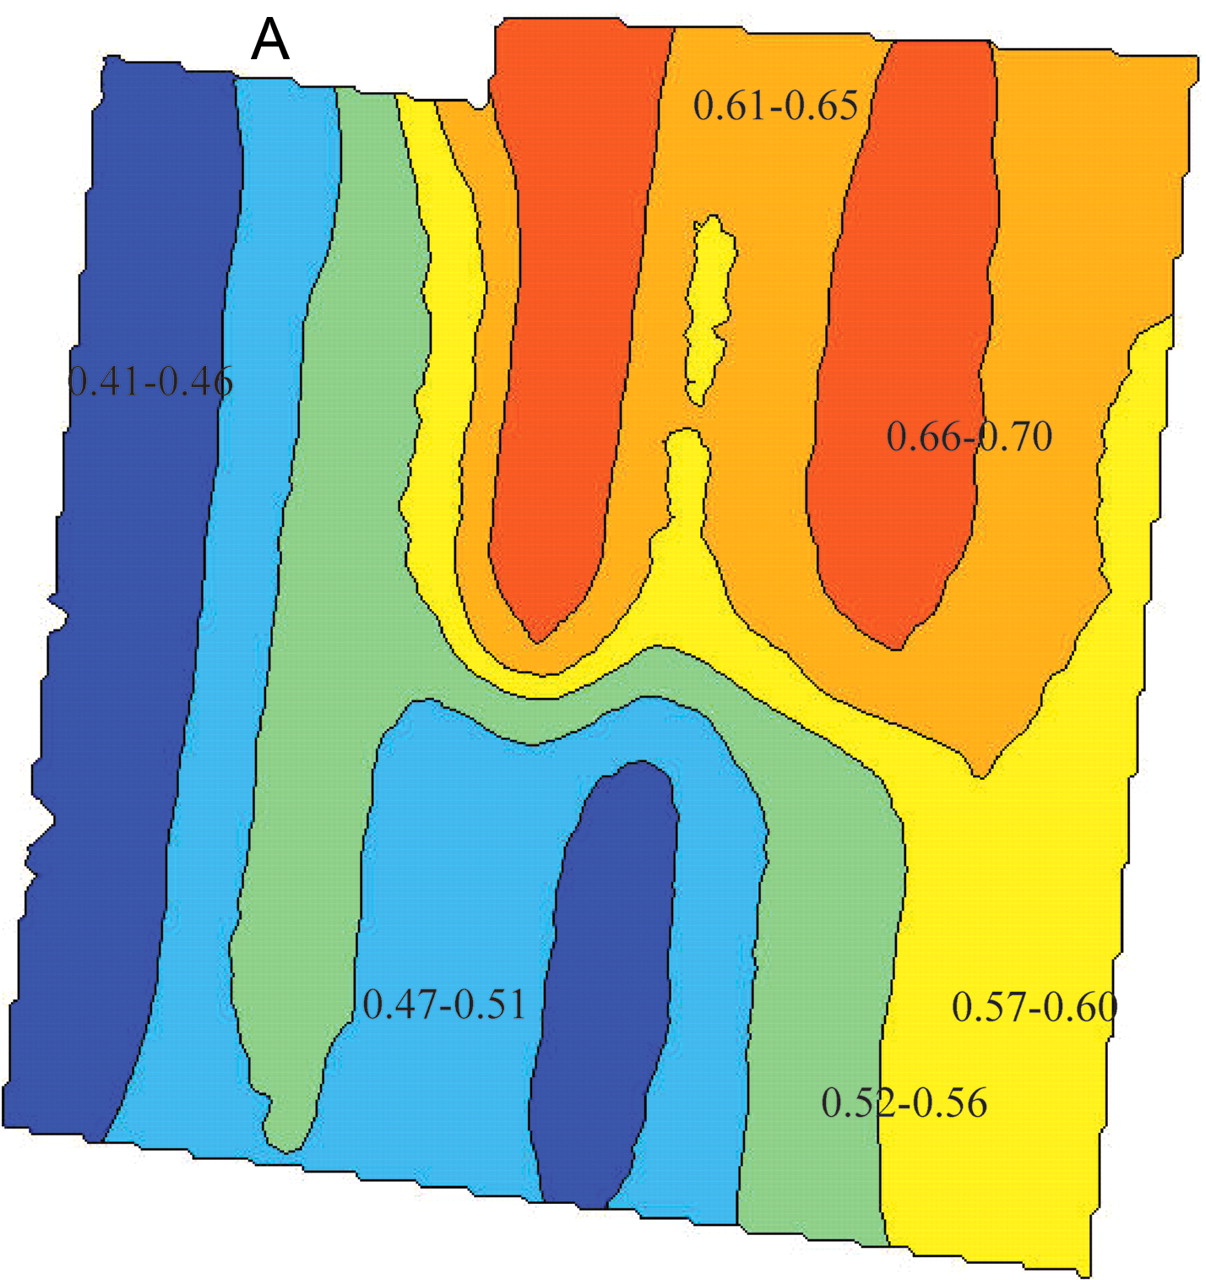
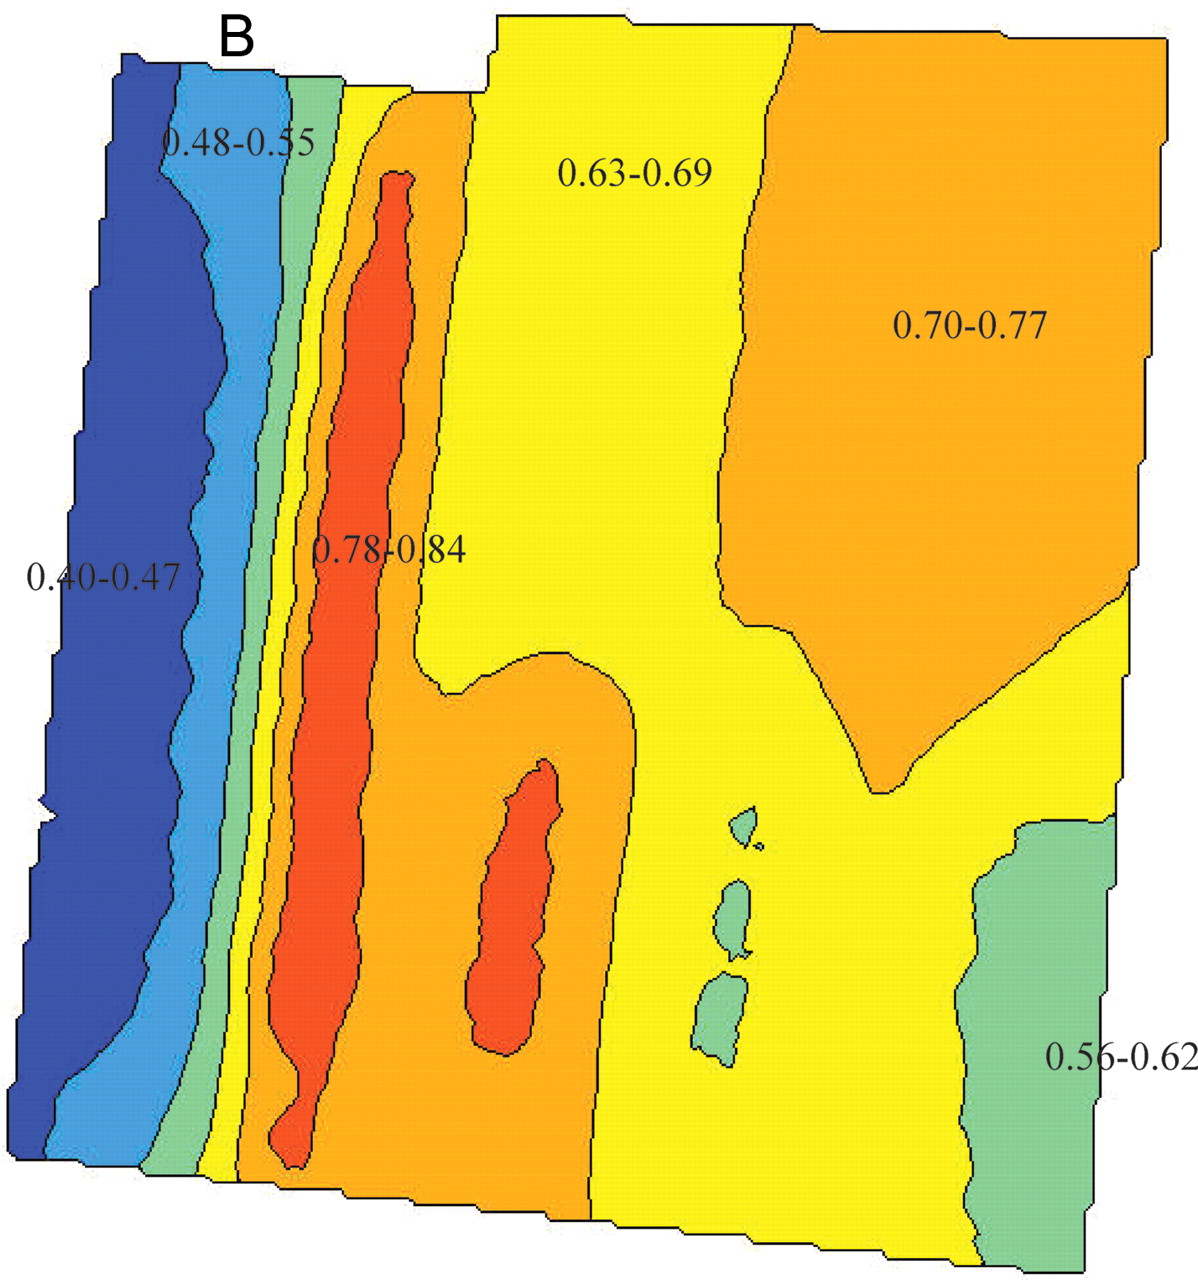
Yield spatial distribution changed substantially over the four vintages studied (Figure 4⇓). In 2002, the southeast area of the vineyard tended to have low yields (Figure 4D⇓). Actual mean yields (t/ha), variabilities (±SD), and ranges across the four seasons were similar: 1998 (10.7 ± 3.5; range 0.3 to 22.9); 1999 (13.0 ± 5.3; range 0.1 to 24.4); 2001 (13.5 ± 4.1; range 3.0 to 25.2); 2002 (15.6 ± 4.5; range 2.2 to 27.6). However, mean yield increased over the study period, as did the range, but the SD was relatively consistent. Vine size spatial distribution was relatively stable throughout this period (Figure 5⇓). In 2002, the west and southwest portions of the vineyard had the largest vines, while the east and southeast had the smallest vines (Figure 5D⇓). Spatial distribution of monoterpenes varied across vintages (Figures 6⇓, 7⇓). In 1998, FVT was highest in the northeast quadrant of the vineyard (Figure 6A⇓), and this region of high FVT expanded to include the majority of the vineyard in 1999 (Figure 6B⇓). In 2002, the central area of the vineyard tended to have lowest FVT, which increased gradually toward the west or east (Figure 6C⇓), similar to the spatial distribution of soil K (data not shown). PVT displayed a similar spatial distribution to FVT in 1998 (Figure 7A⇓), but inexplicably, PVT was highest in the western portion of the vineyard in 1999 (Figure 7B⇓). In 2002, the southeast area of the vineyard tended to have highest PVT concentrations (Figure 7C⇓).


Spatial distribution of yield (kg/vine): (A) 1998, (B) 1999, (C) 2001, (D) 2002.


Spatial distribution of weight of cane prunings (vine size): (A) 1999–grown, estimate, expressed as trunk diam (cm), (B) 2000 (vine size, kg/vine), (C) 2001 (vine size, kg/vine), (D) 2002 (vine size, kg/vine).


Spatial distribution of berry free volatile terpenes (mg/kg berry): (A) 1998, (B) 1999, (C) 2002.


Spatial distribution of berry potentially volatile terpenes (mg/kg berry): (A) 1998, (B) 1999, (D) 2002.
Berry composition.
Vine size and soil texture affected berry composition, but no consistent effects were observed among the three growing seasons (Table 7⇓). No effects of vine size or soil texture were observed for soluble solids or pH in 1999, 2001, or 2002. Titratable acidity was affected by vine size and soil type in 2001 and 2002, but not 1999. In 2001, TA increased with increased vine size while in 2002 TA was affected most by soil texture, with sand having higher TA than clay. There were also soil x vine size interactions for TA in both 2001 and 2002; the 2001 data suggested that the vine size effect was confined to clay soils only, while the 2002 data suggested that the magnitude of effect of sandy soil was greatest in large vines. In 2002, berries also showed a vine size effect on PVT, whereby small vines produced berries with higher concentrations of PVT than did large vines (1.87 and 1.59 mg/L, respectively).
Impact of soil texture, vine size, and interactions on composition of Riesling berries, 1999, 2001, 2002; n = 80 (1999, 2001); n = 75 (2002) (no FVT or PVT in 2001).
Must composition.
Vine size and soil texture affected several must components, including monoterpenes; how-ever, all were vintage-specific and there were no consistent effects across seasons (Table 8⇓). For example, soluble solids was higher on sand than on clay in 2002, but this trend was not observed in 1999. There were no effects of vine size or soil texture on TA in 1999 or 2002. Must pH was higher in small vines than in large vines in 1999, but this trend was not present in 2002. Must FVT were unaffected by vine size and soil texture in 1999. The 1999 musts from vines grown on clay had higher PVT than those from vines on sand (3.29 and 1.94 mg/L, respectively). This trend did not continue in the 2002 musts, which showed no differences in either FVT or PVT among vine size or soil type. No 2001 must samples were available for analysis.
Impact of soil texture, vine size, and their interactions on composition of Riesling musts, 1999 and 2002 (no must samples were available for 2001).
Wine composition.
As with berry and must composition, there were no consistent effects of vine size or soil texture on wine composition across vintages (Table 9⇓). The oldest wines (1999), 3.5 years at time of analysis, displayed the highest number of effects (three) that could be attributed to soil or vine size, suggesting that vineyard effects such as vine size and soil texture may not appear immediately in wine but may appear after some bottle age. There were no main effects of vine size or soil texture on ethanol or pH but vine size x soil interactions were found for ethanol and pH in the 1999 wines, suggesting that ethanol was not impacted by vine size on clay soils but was reduced slightly by increased vine size on the sandier portions of the vineyard. Sand-grown wines had higher TA than clay-grown wines in 1999, yet soil texture had no impact on TA in 2001 and 2002 wines. Wine pH was reduced slightly with increasing vine size in sandy soils. FVT was affected by vine size in 2001 (0.29 and 0.23 mg/L for high and low vine size, respectively), but was not affected in 1999 or 2002. Wine PVT was unaffected by both factors in all three vintages. Overall, the 2001 wines showed only one main effect, while the 2002 wines showed none.
Impact of soil texture, vine size, and their interactions on composition of Riesling wines, 1999, 2001, and 2002.
Sensory analysis.
Sensory descriptive analysis of the St. Urban Vineyard Riesling wines revealed several vine vigor and soil texture effects, some of which were found in more than one vintage, and some of which were vintage-specific. The vine vigor and soil texture effects were opposites of one another in the 1999 and 2001 vintages.
Vine vigor main effects.
In 1999 wines, low vigor tended to result in higher mineral aroma than did high vigor (Table 10⇓). In 2001, the fruit-based attributes (apple and citrus) were affected by vine vigor, such that apple aroma and flavor increased with increased vine size, while citrus flavor decreased. Acidity also decreased with increased vine vigor in 2001. The 2002 wines appeared to be unaffected by vine vigor.
Summary of aroma, flavor, and mouthfeel attributes of 1999, 2001, and 2002 Riesling wines based on vine vigor, soil texture, and their interaction.
Soil texture main effects.
Soil texture affected the fruit-based attributes (apple and citrus) in 1999; apple aroma tended to be higher in wines from sandy portions of the vineyard, while citrus aroma and flavor tended to be lower (Table 10⇑). Wines from sandy areas also displayed increased astringency in 1999. Mineral aroma appeared to be the only attribute affected consistently through two vintages; clay soil resulted in higher mineral aroma than did sandy soil in both 1999 and 2001. As with vine vigor, soil texture did not appear to affect the 2002 wines.
Interactions.
Grassy/vegetal flavor was unaffected by vine vigor or soil texture independently in any vintage (Table 10⇑). However, a vine vigor x soil texture interaction appeared in the 1999 wines, whereby large vines on clay and small vines on sand produced wines with increased grassy/ vegetal flavor intensity. Petrol aroma, on the other hand, was lower in wines from large vines on clay and in small vines on sand in 2001, while petrol flavor increased under the same conditions in 2002. The same interaction also decreased citrus aroma in 2002. There was a vine vigor effect on acidity and length in 2001 that seemed to be isolated to wines from sandy soils.
Discussion
Soil nutrient impact on berry composition and aroma compounds.
The main hypothesis was that soil texture and vine size were potential determinants of terroir. Percent sand positively correlated with several variables of potential significance to wine sensory quality: berry weight (1998), soluble solids (2002), TA (1999), pH (2002), and PVT (1999). Percent clay also positively correlated with soluble solids (1999, 2001) and PVT (1998) and inversely correlated with berry weight (1998, 1999, 2002), TA (1999, 2002), and PVT (1999). Although not numerous, these results suggest that soil texture may play some role in fruit composition and varietal typicity, albeit a nonconsistent one among seasons. No variables correlated with vine size in 1998 or 1999, and very few correlative relationships of consequence were displayed in 2001 or 2002 with the exception of those between vine size and certain yield components, suggesting that vine size, at least in the range used in this study, does not play a major role in determining fruit composition.
An alternative hypothesis might involve other soil or nutritional factors and their putative impacts on variables associated with varietal typicity. There has been extensive research on soil nutrient effects on vine growth and berry composition (Kliewer et al. 1983); however, little to no work has focused on the impact of vine nutrition on concentrations of aroma compounds in grapes. Specifically, since low berry weight is frequently considered desirable enologically, it is possible that soil and vine nutritional factors associated with berry weight may also be determinants of terroir. Those variables we found inversely correlated with berry weight (other than soil texture) included soil pH (1998, 1999, 2002), soil organic matter (2001), soil P (2002), soil K (2001, 2002), soil Mg (2001), soil Ca (1998, 1999, 2002), CEC (1998, 1999, 2002), % base saturation as Ca (1998, 1999, 2002), petiole K (1998), petiole Mg (2001), and petiole Mn (1998). Positive correlations associated with monoterpenes included several with PVT: soil pH (1998, 2002), soil P (1998, 2002), soil K (1998), soil Ca (1998, 2002), soil Cu (1998), soil B (1998), CEC (1998, 2002), % base saturation as Ca (2002), and petiole B (1998). A few studies have found correlations between mineral nutrition and fruit composition; for example, excessive soil K has been shown to increase pH and lower TA (Morris et al. 1980). Direct connections between soil nutrients and aroma compounds, however, have been difficult to determine. In one study, increased K application increased polyphenol concentration in tea, but Mg had inconsistent effects (Ruan et al. 1999). Another study found an increase in PVT in Riesling with increased nitrogen fertilization, but there was little impact on FVT except where increased vegetative growth led to greater shading (and thus lower FVT) (Webster et al. 1993). The impact of soil K, Mg, and other nutrients on monoterpenes or other flavor compounds in grapes and tender fruit is an area for further research.
Effects of vine vigor and soil texture.
Our original hypothesis was that vine vigor has an effect on berry composition and wine sensory attributes, while soil does not. Vine vigor occasionally impacted composition of berries, must, and wines and also impacted sensory perception of aroma, flavor, and mouthfeel in wine. Soil texture affected composition of berries, musts, and wines as well, but not consistently. Thus, within the conditions of this trial (4-ha vineyard, narrowly defined soil and vine vigor categories, and four vintages), wine sensory attributes cannot be ascribed to either vine size or soil texture exclusively. Factors other than those tested apparently impacted wine sensory attributes and hence form much of the basis for so-called terroir effects.
There was large and noteworthy variability in certain data among vintages. For example, the 1999 and 2002 musts showed large differences in monoterpene concentration, particularly in FVT, where 2002 musts had half the concentration of 1999 musts. Another study found FVT concentrations from 0.6 to 1.2 mg/L in Riesling berries (Reynolds et al. 1996), while the range in this study was from 0.25 to 0.6 mg/L. Sensory analysis suggested that vintage variables such as rainfall, temperature, and solar radiation could have played a more significant role than vine vigor or soil texture. Similar conclusions were drawn with respect to Riesling sensory attributes in the Rheingau (Fischer et al. 1999). Although the seasons in question were very similar, all having above average temperatures and below average precipitation, the distribution of growing degree days and precipitation varied considerably across the three years. It is likely that variations in berry, must, and wine composition and wine sensory attributes were partially due to climatological factors. Some of the wine sensory attributes (e.g., petrol) can also be attributed to wine aging effects.
The literature has suggested that cultural practices—such as trellis system (Reynolds et al. 1996), leaf removal (Reynolds and Wardle 1997, Reynolds et al. 1996), shoot density (Reynolds et al. 1994), and irrigation (Kliewer et al. 1983)—play significant roles in composition of wine grapes, aroma compound concentration, and sensory perception of flavor. However, cultural practices were the same throughout all vintages, so their impact should not have been a concern. Certain growing season canopy-management practices such as hedging, basal leaf removal, or vertical shoot-positioning may have mitigated the effect of vine vigor in any one vintage, since one of their main purposes is to improve fruit microclimate by controlling or accommodating vigor.
Wine sensory attributes were less likely influenced by soil texture in one vintage, but on a more long-term basis. Unfortunately, the number of vintages involved in this research made it difficult to fully assess the long-term impact of soil texture on wine sensory attributes. It may require many years of data to understand how soil affects wine varietal typicity, if at all. Such anecdotal evidence has existed for centuries in some wine growing regions and is the basis for the terroir models of Europe (Wilson 1998). In a new wine region such as Niagara, there has not been sufficient time to gather as much scientific or anecdotal evidence of the influence of soil, topographic, and climatic peculiarities (i.e., terroir) as in many other regions of the world.
Bottle aging and monoterpenes and sensory attributes.
Vintage effects on berry composition and wine sensory attributes have been already acknowledged. There was strong evidence in this experiment of the likely influence of bottle age on the presence of terpenes and other flavor compounds. Chemical analysis of the wines revealed higher FVT in 2002 versus 2001 wines (putative short-term aging) but lower FVT in 1999 versus 2001 (putative long-term aging), while PVT appeared to decrease relative to increasing bottle age. Aging has been shown to increase certain Riesling wine aroma compound concentrations. One study found that 11 months of aging wines increased concentrations of cis-3-hexen-1-ol, citronellol and α-terpineol, and decreased concentration of linalool and that tasters identified aged wines as having more ripe-fruit flavors and younger wines as having more green-fruit characteristics (Reynolds et al. 1994). Simpson and Miller (1983) found that aging caused increases in oxidative flavor compounds such as 1-hexanol (cis-rose oxide) and 3-methyl-1-butanol (trans-anhydrolinalool oxide) and decreases in other volatile compounds such as ethyl n-octanoate. Such results suggest the 2002 wines may not have developed sufficient varietal character and would have perhaps shown more vine vigor and soil effects with some bottle age.
Implications for precision agriculture.
Although research on using GPS and GIS technology to determine spatial relationships in the vineyard has been relatively recent, there is already evidence of its value when applied to vineyard management practices. Studies have suggested that maps could help identify specific zones in a vineyard for more precise management including segmented harvest, fertilization, and differential irrigation (Bramley 2005, Bramley and Hamilton 2004, Davenport et al. 2001, Greenspan and O’Donnell 2001, Lamb et al. 2004). New vineyard planning could benefit substantially from more precise knowledge of soil texture profile and water relations (Lamb et al. 2004). Pierce (2001) suggests that future vineyard establishment could be carried out using this technology and autopilot and robotic tractors. Technologies such as airborne remote imaging devices using infrared sensing could be used to determine areas of variation in biomass and/or plant stress to determine canopy structure more precisely and thus predict yield (Lamb et al. 2004, Pierce 2001). Disease monitoring, specifically of blackleaf, could be done with similar systems (Davenport et al. 2001). Our data suggest there might be an inherent flaw in the basis for precision agriculture in perennial horticultural crops, for two reasons. First, spatial distribution of yield may vary temporally, which makes delineation of management zones based on yield very challenging. Second, the lack of consistent and strong correlations between yield and vine size is a fundamental issue; the basis for implementation of variable-rate technology is founded on the assumption that high-yielding areas are also areas of high vigor and would therefore require less fertilizer inputs than areas with lower yield (Pierce 2001).
It is difficult to know whether precision agriculture tools are simply determining quantitatively what had been known qualitatively previously as terroir or whether previously unknown relationships might be discovered. These new technologies could revolutionize agriculture, allowing the viticulturist to instantly amass detailed information about complex relationships among soil texture, soil nutrients, vine vigor, and canopy microclimate. The ultimate question of precision viticulture’s impact on the improvement of wine quality remains unanswered.
Conclusions
The initial hypothesis that vine vigor would have a measurable effect on berry, must, and wine composition was shown to be true. Soil texture was also shown to have an impact on berry, must, and wine composition. A consistent effect from either vine vigor or soil texture from one year to another was not observed. Often, an effect of vine size or soil texture found in one year was either nonexistent or opposite in the following year. Soil texture, vine size, and vintage played a role in wine sensory attributes, and the influence of bottle aging of the wines may have been a contributing factor to the vintage effect. Numerous correlations and spatial relationships between berry compositional variables and soil/ petiole nutrients were also observed and suggested that factors other than the experimental variables may have influenced fruit and wine composition, particularly with respect to monoterpene concentrations. However, specific areas of the vineyard that produced high yields and highest concentrations of monoterpenes appeared to be transient, and their spatial distribution varied temporally. This research therefore has implications for implementation of precision agriculture in perennial horticultural crops by showing the difficulties in delineating management zones for differential cultural practices on a particular vineyard site.
Footnotes
Acknowledgments: The authors thank Brian and Allan Schmidt, Vineland Estates Winery, for their cooperation. Efforts of the many sensory panelists are also acknowledged. This paper represents work included in the undergraduate thesis of I. Senchuk (2003) and data from the thesis of C. van der Reest (2001).
Financial assistance from the Natural Sciences and Engineering Research Council of Canada is acknowledged.
- Received January 2006.
- Revision received June 2006.
- Revision received October 2006.
- Copyright © 2007 by the American Society for Enology and Viticulture
Literature Cited
Vol 58 Issue 2


Jump to section
Related Articles
Cited By...
More from this TOC section
Similar Articles
