


Abstract
Four Vitis vinifera L. cultivars grown at five locations throughout California were studied to determine the relationships among temperature and vapor pressure deficit (VPD) and leaf water potential (Ψl) measured under clear skies at midday (solar noon) or in some instances midmorning to midafternoon. Stem water potential (Ψstem) was also measured on several occasions. Vines were irrigated at 100% or greater of measured or estimated vineyard evapotranspiration, and deficit or nonirrigated vines were included for comparison. Temperature and VPD were determined at the time of measurement. The highest and lowest values of Ψl measured on well-watered grapevines were −0.51 and −1.15 MPa, respectively. Leaf and stem water potentials were linearly related to VPD and ambient temperature. The coefficient of determination was greater for the relationship between Ψl and VPD (R2 = 0.74) than ambient temperature (R2 = 0.58). Based on the regressions, estimates of Ψl at a VPD of 2 and 5 kPa for fully irrigated grapevines would be −0.65 and −0.89, respectively, while those of Ψstem at the same VPDs would be −0.37 and −0.57 MPa, respectively. Leaf water potential of water-stressed vines was less responsive to VPD or temperature when Ψl values ranged from −1.2 to −1.45 MPa. The values of Ψl and Ψstem as a function of VPD or temperature could serve as baselines indicating whether grapevines are fully irrigated or not water stressed under the environmental conditions found in semiarid grapegrowing regions.
Plant-based measurements as a tool in irrigation management are growing in popularity in the California grape industry. The measurement of vine water status is used to determine when to initiate irrigations early in the growing season and the frequency of water applications once irrigation has begun (L.E. Williams, personal observation). Grapevine water status is determined by measuring leaf (Ψl) or stem (Ψstem) water potential at midday or a few hours before or after midday.
Leaf water potential of grapevines undergoes diurnal changes (Williams et al. 1994), with daily minimum values occurring when vine water use is greatest or shortly thereafter (Williams et al. 2003b, Williams and Ayars 2005a) because it is affected by environmental conditions, including light, temperature, and vapor pressure deficit (VPD) (van Zyl 1987, Smart and Barrs 1973). Environmental effects on plant water status extend to other plant species. Grimes et al. (1987) found that Ψl of cotton was a linear function of both VPD and ambient temperature when measured on a diurnal basis. McCutchan and Shackel (1992) found that leaf and stem water potentials of prune during midseason were more highly correlated with VPD than with relative humidity, solar radiation, ambient temperature, or wind speed at midday. Williams and Trout (2005) reported similar relationships between VPD and Ψl or Ψstem of grapevine using a limited data set. The value of measured Ψl will vary depending on environmental conditions at the time of measurement. However, light could be eliminated as a major factor if Ψl measurements were taken on cloudless days and if photon flux density (PFD) measured perpendicular to the leaf blade was greater than 1500 μmol m−2 s−1.
The relationships between either Ψl (Grimes et al. 1987) or Ψstem (McCutchan and Shackel 1992, Shackel et al. 1997) and VPD have been used to establish a nonstressed baseline for those two parameters in cotton and deciduous fruit trees, respectively. In the former study (Grimes et al. 1987), cotton Ψl was “climate-normalized” for scheduling an irrigation event. In the latter study (Shackel et al. 1997), the relationship between Ψstem and VPD was designated the fully irrigated baseline. The ability to determine if grapevines are not water stressed, similar to a fully irrigated baseline, would give growers another tool to develop an objective irrigation management program.
This study was conducted to determine the relationships among Ψl, and to a lesser extent Ψstem, and ambient temperature and VPD for grapevines irrigated at 100% of measured evapotranspiration (ETc) or slightly greater than estimated ETc. Four different cultivars growing in vineyards at five locations in California were studied. At one location, water applications to replenish ETc were determined with the use of a weighing lysimeter (Williams et al. 2003b). Crop coefficients and reference evapotranspiration (ETo) were used at the other four locations to estimate vineyard ETc. Vines were irrigated at 1.12, 1.2, or 1.25 times ETc. All measurements were made on cloudless days to minimize the effects of light on Ψl or Ψstem.
Materials and Methods
A weighing lysimeter was installed in 1986 at the University of California Kearney Agricultural Center located in the San Joaquin Valley (lat. 36°48′N; long. 119°30′W). Two Vitis vinifera L. (cv. Thompson Seedless clone 2A) grapevine cuttings were planted in the lysimeter and in the vineyard surrounding the lysimeter on 9 April 1987. Vine and row spacings were 2.15 and 3.51 m, respectively (7.55 m2 per vine). The length allocated to the canopies of the two vines within the lysimeter was similar to that of the vines down each row in the vineyard surrounding the lysimeter. Row direction was 6° north of the east/west axis. The vineyard was ~1.4 ha (168 x 82 m).
Vines were supported on a trellis that consisted of a 2.13-m wooden stake driven 0.45 m into the soil at each vine. A 0.6-m cross arm was placed atop the stake and wires attached at either end of the cross arm to support the fruiting canes. The trellis for the vines in the lysimeter was self-contained to ensure it was part of the lysimeter mass.
The soil container of the lysimeter was 2 m x 4 m x 2 m deep. The tank was weighed with a balance beam and load-cell configuration, with most of the weight eliminated using counter weights. A detailed description of the lysimeter is given elsewhere (Williams et al. 2003a,b, Williams and Ayars 2005a).
Vines within the lysimeter and the surrounding vineyard were irrigated with 4 L h−1 in-line drip emitters, spaced every 0.30 m in the vine row. Drip tubing was attached to a wire suspended 0.4 m aboveground. The lysimeter was weighed hourly to determine ET of the two vines and was irrigated when the decrease in mass exceeded a 16 kg (a volume of 8 L vine−1) threshold value. The number of irrigations per day throughout the growing season ranged from 0 to 7.
The irrigation pump for the rest of the vineyard was controlled by the lysimeter’s datalogger (21x Micrologger, Campbell Scientific, Logan, UT). When the lysimeter was irrigated, the vineyard pump was activated to irrigate the field. Vines were irrigated with the amount of water the lysimeter vines used. In-line water meters downstream from the solenoid valves in each row measured actual applied water amounts. In another treatment vines were not irrigated. Data used in this study were collected in 2005.
The second site was a Merlot vineyard in Madera County (lat. 36°55′N; long. 120°9′W). The vines were planted on their own roots with 2.13 and 3.66 m vine and row spacings, respectively. The trellis was a cordon wire at a height of 1.28 m and a foliage catch wire 0.3 m above that. Vineyard rows were approximately east/west. Vines were drip-irrigated at either 0.4 or 1.2 of estimated ETc. The two amounts of water were achieved using different numbers of emitters or emitters with different discharge rates. The seasonal crop coefficients (Kc) used to schedule irrigations at this site were developed in the previous four years by measuring the shade cast on the ground beneath the canopy and then using the relationship between the percentage of shade and the crop coefficient (Williams and Ayars 2005b). Reference ET (ETo) was obtained from California Irrigation Management Information System (CIMIS) weather station 145, located ~15 km from the vineyard. Vineyard ETc was calculated as ETo x Kc. Irrigation treatments did not commence until midday Ψl reached −1.0 MPa. Vines were irrigated once weekly, beginning on Friday and ending by Sunday, with applied water amounts equal to that required for the week. Water potential readings were generally measured on Thursday. Data from the 2002 to 2005 growing seasons were used.
The third site was a Cabernet Sauvignon vineyard in Livermore Valley (lat. 37°40′N. long. 121°46′W). Vines were grafted onto 5C rootstock. Two trellis/training treatments were used: vertical shoot-positioned (VSP) and Smart–Dyson. Vine and row spacings were 1.83 m, and row direction was approximately north/south. Irrigation amounts were 1.12 of estimated ETc and applied with a drip-irrigation system. The seasonal crop coefficients for the VSP trellis were developed in a Chardonnay vineyard in Napa Valley (L.E. Williams, unpublished data), adjusted for a row width of 1.83 m and adjusted with the shaded area technique (Williams and Ayars 2005b). The seasonal crop coefficients for the Smart–Dyson trellis/training system at a row width of 1.83 m were established using the shaded area technique in 2000. Reference ET was obtained from a CIMIS weather station located 30 km from the vineyard. Calculation of applied water amounts was similar to that described for the Merlot site, and vines were irrigated 1 to 3 times weekly, depending on the required amounts. Data used were collected in 2002 and 2003. All Ψl readings were taken on the west side of the canopy between 1330 and 1600 hr, Pacific Daylight Time (PDT).
The fourth vineyard site, located near Paso Robles (lat. 35°41′N; 120°39′W), was planted to Cabernet Sauvignon grafted onto 5C. Vine and row spacings in the vineyard were 1.83 and 3.05 m, respectively, with a VSP trellis/training system. Row direction was approximately north/south. In one treatment, vines were irrigated at 1.12 of estimated ETc. A second treatment consisted of irrigating vines once every two weeks with 90.7 L (16.2 mm) of water per vine. The seasonal crop coefficients used were those for a VSP trellis at a row width of 3.05 m. Reference ET was obtained from the PR1 weather station operated by the Paso Robles Wine Country Alliance (PRWCA), located ~3 km from the vineyard. Calculation of applied water amounts was similar to that described for the Merlot site. Vines were irrigated 1 to 3 times weekly, depending upon the required amounts. Data used from this site were collected in 2002 and 2005. Measurements of Ψl were taken on the east side of the canopy in the morning hours (no earlier than 1000 hr PDT) and on the west side in the afternoon (no later than 1600 hr PDT).
The fifth vineyard was located in the Temecula Valley (lat. 33°33′N; long. 117°02′W) of southern California. Chardonnay grapevines on their own roots were planted to vine and row spacings of 2.44 and 3.66 m, respectively. The vines were trained to quadrilateral cordons with a 1.0-m cross arm. Rows were oriented north/south. The seasonal crop coefficients used to schedule irrigations were developed at the site in 1997. The shaded area technique, as in the Merlot vineyard, was used in 1998 and 1999. Reference ET was obtained from CIMIS weather station 137 located ~5 km from the vineyard. Once irrigations began the vines received water five days a week at 1.25 of estimated ETc to ensure they were well watered. Data were collected in 1998 and 1999.
Variables measured and calculations used to determine hourly and daily ETo from CIMIS can be found in Synder and Pruitt (1992). Degree-day data were obtained from the University of California Statewide Integrated Pest Management Project website (www.ipm.ucdavis.edu). Degree days were calculated using the sine method with a lower threshold of 10°C. Temperature data used in calculating degree days were obtained from the CIMIS (or PRWCA) weather station nearest to the vineyard site.
Water potential readings at all locations were measured as described by Williams and Araujo (2002). Specifically, leaf (Ψl) and stem (Ψstem) water potentials were measured with a pressure chamber (model 1000; PMS Instrument, Corvallis, OR). Leaf Ψ was measured on fully expanded, mature leaves exposed to direct solar radiation located on the outside of the canopy. Leaf blades for Ψl determinations were covered with a plastic bag, quickly sealed, and petioles then cut within 1 to 2 sec. The time between leaf excision and chamber pressurization was generally less than 10 to 15 sec. Approximately 30 min before measurements, leaves for determination of Ψstem were enclosed in plastic bags covered with aluminum foil. Leaves chosen for Ψstem measurements were of similar age and type as those used for Ψl but were located on the shaded side of the canopy to minimize any possible heating effects. A single leaf from five to six individual vine replicates was measured and used for data analysis. Stomatal conductance (gs) was measured with a steady-state diffusion porometer (model 1600; LI-COR, Lincoln, NE) on leaves similar to those used for Ψl measurements. The porometer had been sent to the LI-COR factory each year for recalibration (Turner 1991).
Temperature and relative humidity were measured at all locations with two hand-held temperature/relative humidity probes (model DM-84 Multimeter with MultiMeterMate RH/T probe, A.W. Sperry Inst., Inc., Hauppauge, NY) and on occasions a Pocket Sling Psychrometer (Cole-Parmer, Vernon Hills, IL). The probes were positioned just beneath the canopy of vines trained to a VSP trellis (ensuring they were in the shade) and just below the fruiting zone of vines at the other vineyard sites. The probes were placed at two different locations within each vineyard. Measurements with the sling psychrometer were made between rows at a height of ~2 m. The probes were routinely calibrated in the laboratory and the outputs from the two were within 1°C and 2% relative humidity. Photon flux density (PFD) was measured with a quantum sensor (model LI-190SA; LI-COR) or using the quantum sensor on the diffusion porometer.
Data were analyzed via regression analysis using linear and quadratic terms. Regressions with the best fit are presented. Values of Ψl and Ψstem are the means of five to six individual leaf replicates. The homogeneity of linear regression slopes was tested for all individual vineyard data sets. Data were also analyzed using analysis of variance and means separated using the Tukey-Kramer test. CoStat statistics software (CoHort Software, Monterey, CA) was used for data analysis.
Results
The vineyards used in this study spanned a wide distance from northern (Livermore) to southern (Temecula) California. The accumulation of degree days and seasonal ETo differed only slightly from location to location (Table 1⇓). Estimated or measured seasonal grapevine water use ranged from ~450 to 800 mm with vineyard water use dependent on both row spacing and trellis type and individual vine water use dependent on vine spacing within the row and trellis type. Maximum weekly irrigation requirements during the middle of the growing season ranged from 165 to 333 L vine−1 or 30 to 44 mm. In most cases the amount of water requested in this study to meet vineyard ET in the commercial vineyards was applied by the grower/cooperator. Water potential measurements spanned the period at most locations from before bloom until close to fruit harvest.
Seasonal climatic variables, dates of measurements, and water requirements at the five locations of grapevines in this study.
All measurements were made on cloudless days, and photon flux density (PFD) was in excess of 1500 μmol m−2 s−1 at the time Ψl or Ψstem was taken. A wide range of temperatures and vapor pressure deficits (VPD) were recorded at all sites when measurements were taken. The high and low temperatures across all locations at the time of data collection were 44.6 and 20.1°C, respectively (Table 2⇓). High and low values of VPD were 8.71 and 1.19 kPa, respectively. Using all data points, VPD was highly correlated with ambient temperature (Ta) in this study. The linear relationship between VPD and temperature was VPD = −5.69 + 0.289 * Ta (R2 = 0.87, p < 0.001). A second order polynomial regression between VPD and Ta (3.34 − 0.284 * Ta + 0.00886 *  ) increased the R2 to 0.91.
Low and high values of temperature, vapor pressure deficit (VPD), and leaf water potential (Ψl) measured at each location throughout the course of the study.
Differences in the high and low values of Ψl at the various locations were determined by taking measurements at different times during the growing season or at different times during the day. The highest and lowest Ψl values were −0.53 and −1.14 MPa, both measured at the Paso Robles site (Table 2⇑). The lowest values at the other locations ranged from −0.92 to −0.98 MPa.
The relationship between Ψl and VPD did not differ among the five locations. The best fit of the relationships between Ψl and VPD or temperature for the entire data set was a linear function (Figure 1⇓, Figure 2⇓). The coefficient of determination was greater for the regression of Ψl on VPD than for the regression of Ψl and temperature. While fewer measurements of Ψstem were taken during the course of the study, a linear relationship was detected between Ψstem and VPD (Figure 3⇓). The relationship between Ψstem and temperature (y = −0.118 − 0.0185 * VPD) had a R2 value of 0.49 (p < 0.01).

Relationship between leaf water potential (Ψl) measured on four grapevine cultivars and vapor pressure deficit (VPD) at the time of measurement at five locations. The solid line represents the relationship between Ψl and VPD (Williams and Trout 2005). Each data point is the mean of at least five individual leaf replicates (*** indicates significance at p < 0.001; n = 90).
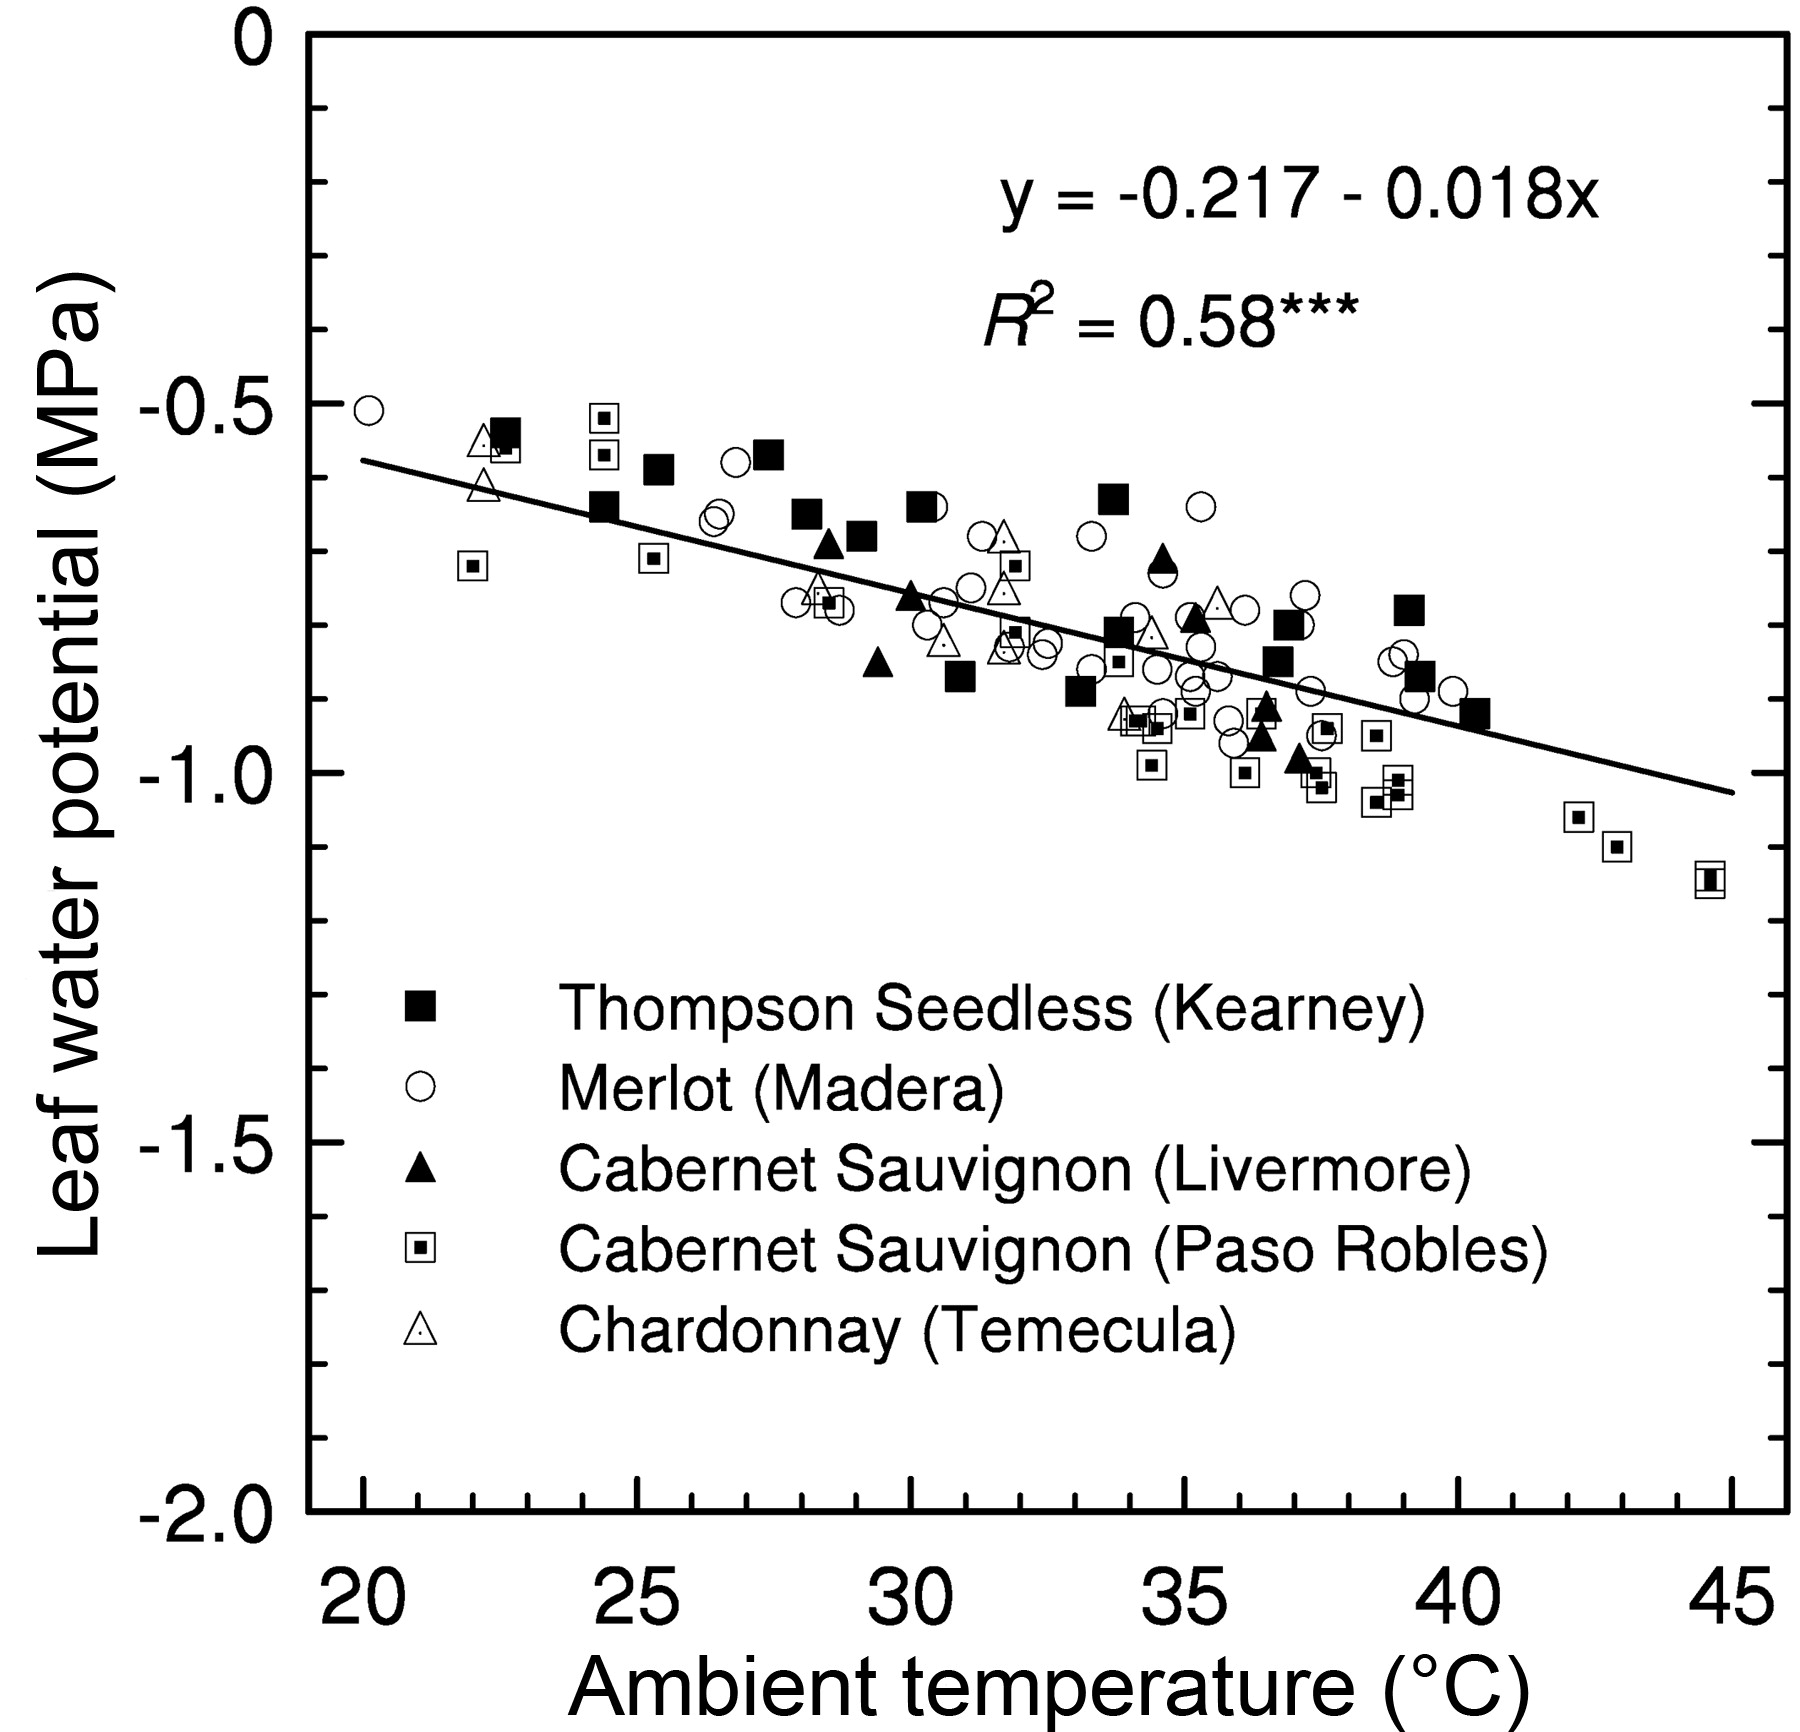
The relationship between leaf water potential and ambient temperature at the time of measurement. Other information is as given in Figure 1⇑.

The relationship between stem water potential (Ψstem) measured on three grapevine cultivars and vapor pressure deficit (VPD) at the time of measurement. Other information is as given in Figure 1⇑ (n = 28).
On several occasions gs and leaf transpiration (E) were measured with Ψl (Table 3⇓). In general, gs increased after the first measurement of the day, was highest around solar noon, and slightly decreased thereafter. Values of gs for the fully irrigated vines were always greater than those of vines that were deficit irrigated or not irrigated at all. Leaf E values of vines irrigated at 1.0 of ETc or greater were highest at solar noon or later. Leaf Ψ of the deficit-irrigated vines (Cabernet Sauvignon and Merlot) tended to decrease during the day, while that of the nonirrigated Thompson Seedless vines remained similar from 1000 to 1600 hr. The relationship between Ψl values lower than −1.2 MPa and VPD was also best fit with a linear regression (Figure 4⇓). However, the slope of that relationship differed from that between Ψl and VPD for vines irrigated at 1.0 ETc or greater (from Figure 1⇑).
Time of day, temperature, vapor pressure deficit (VPD), leaf water potential (Ψl), stomatal conductance (gs), and leaf transpiration (E) measured at that particular time for three cultivars. Vines were irrigated at various fractions of estimated ETc (1.12, 1.2, and 0.4) or measured ETc with a weighing lysimeter.
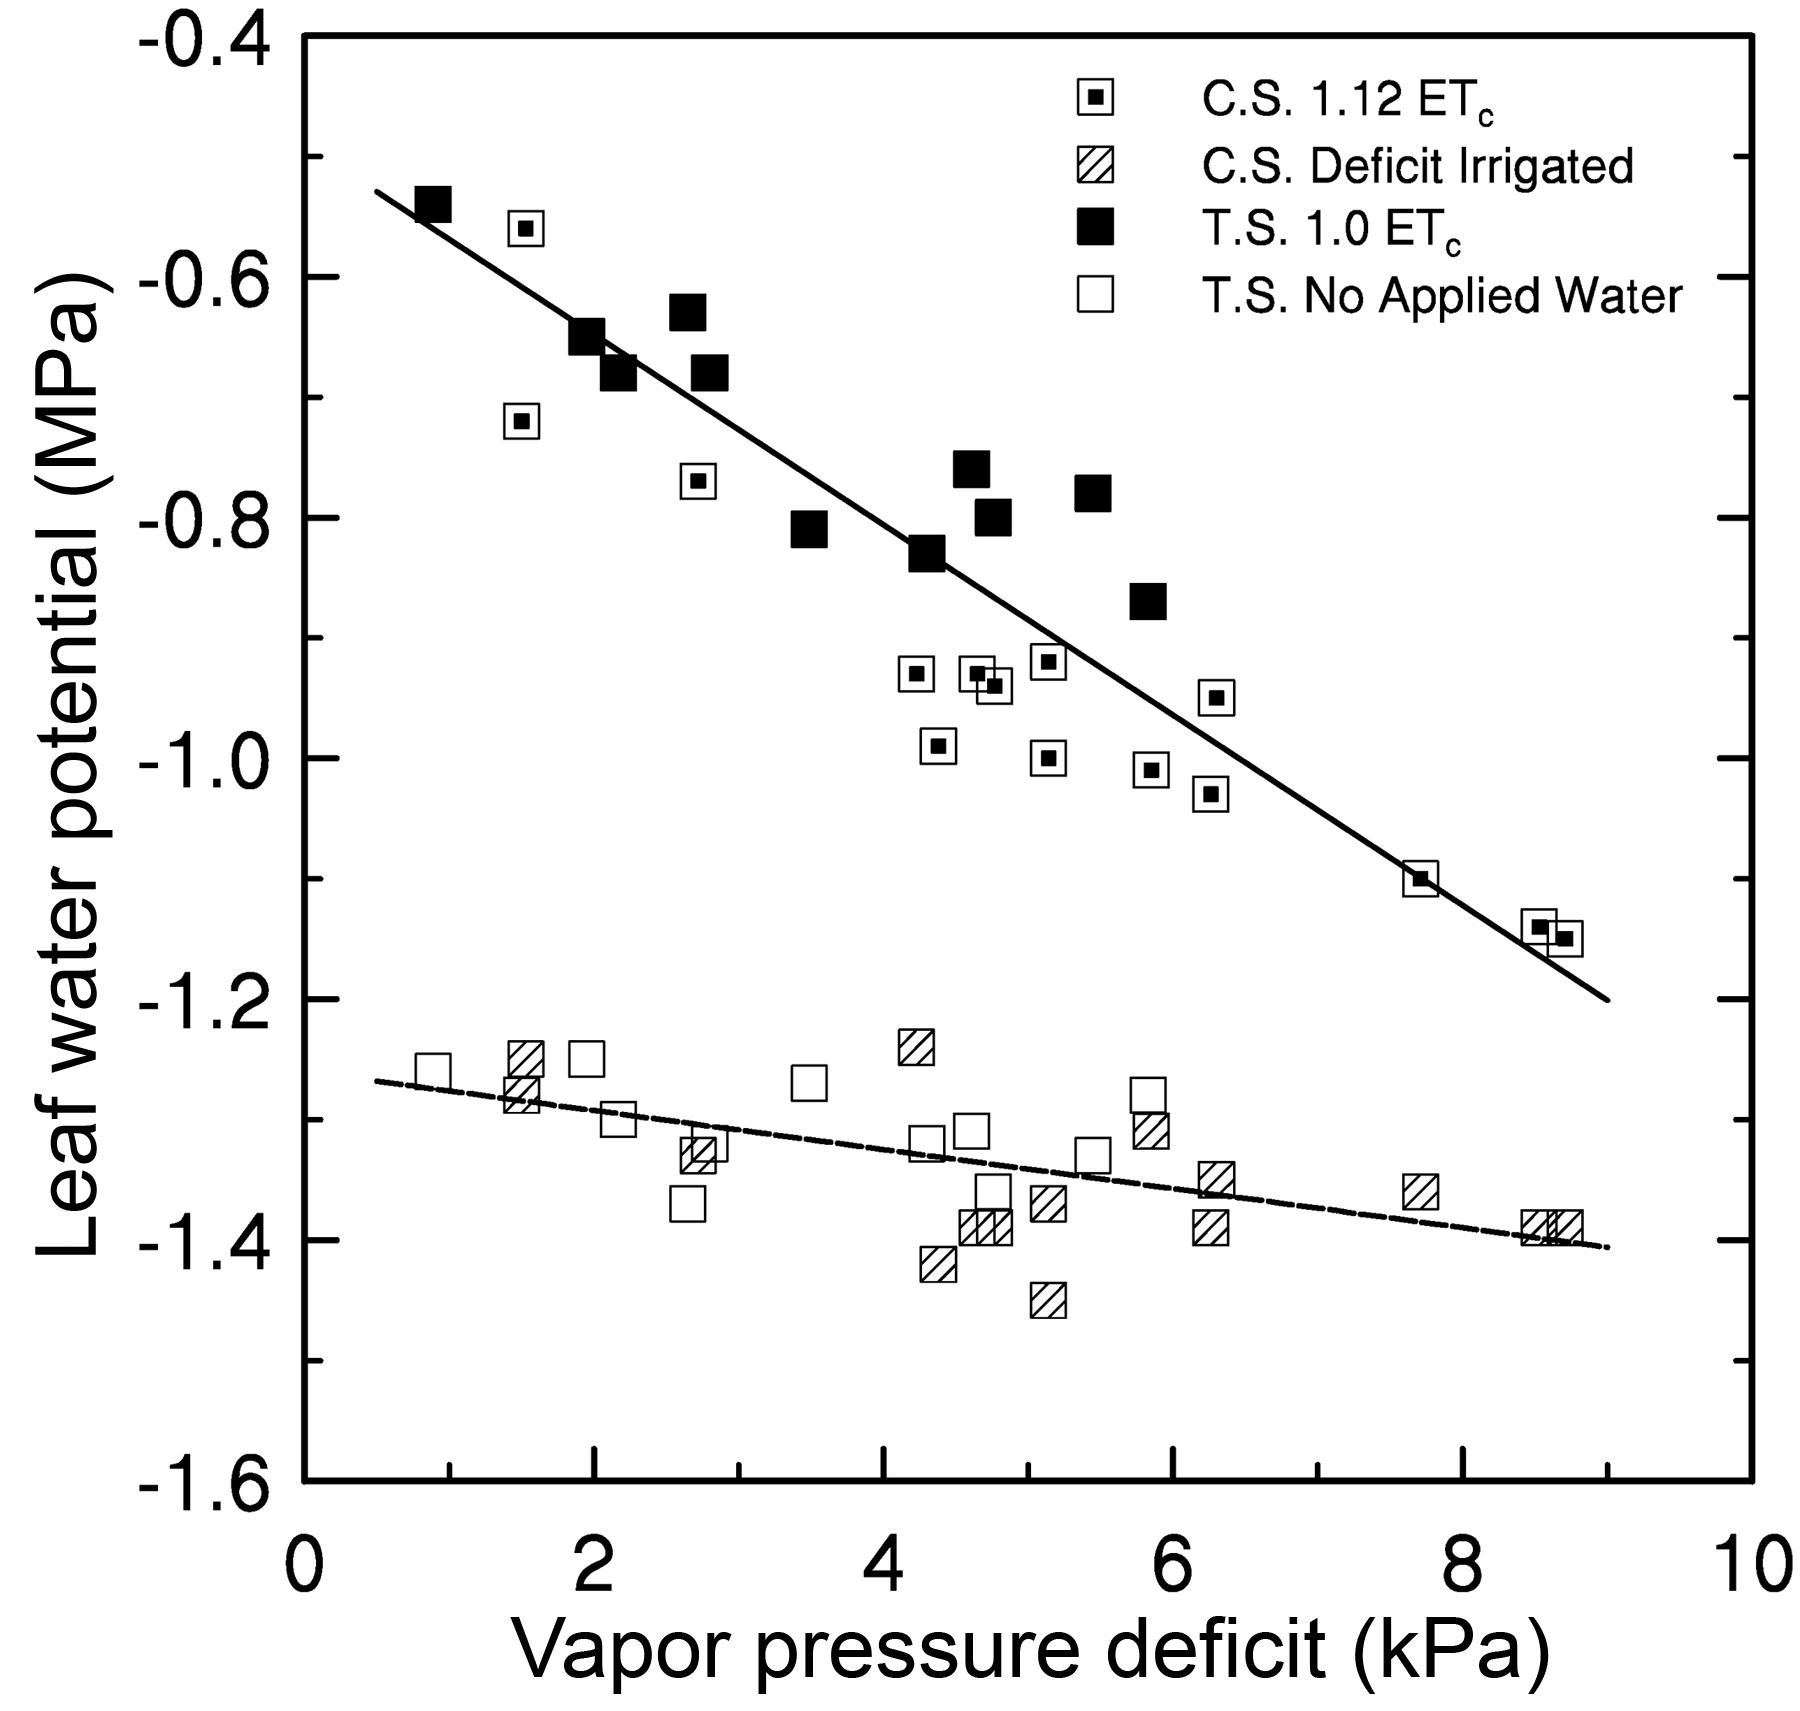
The relationship between Ψl measured on deficit irrigated or nonirrigated grapevines and VPD at the time of measurement, using the equation: y = −1.24 − 0.0179 * VPD, R2 = 0.31**. Measurements were between 1000 and 1600 hr. The regression from Figure 1⇑ and Ψl values of the irrigated treatments for each cultivar measured at the same time are given for comparison. (T.S.: Thompson Seedless; C.S.: Cabernet Sauvignon; ** indicates significance at p < 0.01.) Other information is as given in Figure 1⇑.
Discussion
Previous studies on grapevine have examined the response of Ψl to various environmental parameters on a diurnal basis (Smart 1974, Smart and Barrs 1973, Stevens et al. 1995, van Zyl 1987). The environmental factor having the most influence on Ψl in those studies was PFD and to a lesser extent VPD and temperature. The purpose of our study was to examine the response of Ψl and Ψstem measured at midday to changes in ambient VPD and temperature at the time of measurement, as it is at midday that daily minimum values of either parameter are expected, even for well-watered vines (Grimes and Williams 1990). During the daily measurement period, between 1000 and 1600 hr (PDT) on cloudless days, it was assumed that any changes in Ψl would be in response to other environmental conditions and that PFD was nonlimiting. Differences in temperature and VPD were obtained by taking measurements beginning early in the growing season through to near harvest and on some occasions from midmorning to midafternoon across a range of locations and grapevine cultivars.
It was assumed that the vines used in this study were well-watered, that is, that water was nonlimiting in the soil profile. The Thompson Seedless vines used in 2005 were grown in a weighing lysimeter and irrigated whenever they used 2 mm of water, as reported previously (Williams et al. 2003b). Vines irrigated at less than ETc, with ETc determined with a weighing lysimeter, had lower midday Ψl, Ψstem, gs, and leaf net CO2 assimilation compared with those irrigated at full ETc or greater (Williams and Trout 2005). Vines grown at the other locations used in our study were irrigated based upon the calculation of ETc using ETo and estimated seasonal crop coefficients (Williams and Ayars 2005b) and then using only treatments in which applied water was greater than estimated ETc. Values of gs and E measured on the Merlot and Cabernet Sauvignon vines were similar to those measured on the Thompson Seedless vines (Table 3⇑), indicating that those vines were being irrigated at or close to full ETc.
The maximum values of Ψl, gs, and E for the fully irrigated vines in our study (Table 2⇑) were generally greater than those found in other studies. For example, maximum gs for field-grown vines in Spain having a “sufficient supply of water” was equivalent to 326 mmol m−2 s−2, with most gs values much less (Jacobs et al. 1996). Stomatal conductance for vines receiving full irrigation in a field study in Portugal averaged 300 mmol m−2 s−1 (De Souza et al. 2003). In another study, vines “maintained in a well-watered state” had maximum gs values that approached 500 mmol m−2 s−1 at low ambient temperatures and VPD; afternoon (1600 hr) values of Ψl for the well-watered vines decreased to −1.4 MPa and gs decreased as temperature and VPD increased (Correia et al. 1995). Schultz (2003) reported a maximum gs and a minimum Ψl of ~250 mmol m−2 s−1 and −1.4 MPa, respectively, for vines irrigated weekly with 30 L vine−1 in 1994 and 50 L vine−1 in 1995 from diurnal measurements taken in August. Maximum gs of Ca-rignane and Merlot was estimated as 560 and 440 mmol m−2 s−1, respectively, by Winkel and Rambal (1990). In another study, typical values at midday for stomatal resistance and Ψl of a “wet” treatment were reported as ~1.0 s cm−1 (equivalent to a stomatal conductance of 400 mmol m−2 s−1) and −0.95 MPa, respectively (van Zyl 1987). In an irrigation study on Colombard grapevines, maximum gs and E were 530 and 29 mmol m−2 s−1, respectively (Stevens et al. 1995), while another study reported maximum values of 600 and >15 mmol m−2 s−1, respectively (Cuevas et al. 2006). As seen from the above examples, the values of gs, E, and Ψl found in our study for the fully irrigated vines are equal to or greater than those that others have reported for well-watered vines.
Leaf Ψ of fully irrigated grapevines decreased as VPD and temperature increased, despite measurements being taken at various times during the growing season and different times of day (as long as light was nonlimiting) across locations and cultivars. Based on the regression equation, midday Ψl of well-watered grapevines decreased from −0.65 to −0.89 MPa as VPD increased from 2 to 5 kPa. The slope of the equation used to describe the relationship here was not significantly different from that reported elsewhere (Williams and Trout 2005). McCutchan and Shackel (1992) also reported that prune Ψl was linearly correlated with VPD (R2 = 0.70). The lowest value of Ψl measured in this study for well-watered vines, −1.15 MPa for Cabernet Sauvignon at the Paso Robles site, occurred when VPD was 8.7 kPa at the time of measurement. This Ψl value is still greater than that reported by others at midday for well-watered or control vines (Correia et al. 1995, Schultz 1996).
Stem Ψ of grapevines was also linearly related to VPD in our study. Stevens et al. (1995) reported that Ψstem of their well-watered vines was correlated with VPD (Ψstem = −0.326 − 0.052*VPD, R2 = 0.63). McCutchan and Shackel (1992) found that Ψstem of prune (Prunus domestica L. cv. French) was linearly related to VPD (Ψstem = −0.41 − 0.12*VPD, R2 = 0.81) when some of the early and late season data were excluded from the calculation (all Ψl and Ψstem data collected in our study were used in the correlations with VPD). It was subsequently shown that this baseline also fit data collected on almond (Prunus dulcis (Mill.) Webb.) and was termed a fully irrigated (Shackel et al. 1998) or a nonstressed (Shackel et al. 1997) baseline.
The measurement of predawn leaf water potential (ΨPD) is often considered a more reliable means of assessing grapevine water status than that of Ψl or Ψstem measured at midday (Gruber and Schultz, 2005). One reason for this preference is that Ψl was shown to be highly correlated with daily maximum temperature—it increased or decreased at midday as ambient temperature increased or decreased, respectively, for vines irrigated with large amounts of water (H.R. Schultz and M.A. Matthews, unpublished data, cited in Gruber and Schultz 2005). It was concluded that Ψl measurements taken during the day may be uncoupled from the water status of the soil since Ψl varied with temperature changes. The observation of Schultz and Matthews was also demonstrated in our study, Ψl was inversely related to ambient temperature at the time of measurement, and their data fit the regression we found for Ψl as a function of temperature (Figure 2⇑). Therefore, the results from our study indicate that the variation of Ψl to changes in the environment does not mean Ψl is uncoupled from soil water status. It has also been found that midday Ψl and Ψstem were more highly correlated with soil water content and soil matric potential than was ΨPD. (Williams and Araujo 2002, Williams and Trout 2005).
Transpiration (E) of a plant can be directly related to the liquid phase soil to leaf water potential gradient and inversely related to the total resistance following the Ohm’s law analog (van den Honert 1948):

where Ψsoil is soil water potential, Ψl is leaf water potential, and Rsl is the combined soil to leaf water flow resistance. Rearranging the equation:

it can be seen that any variation in E, brought about by changes in evaporative demand will affect Ψl even when soil water is not limiting. The decrease in Ψl or Ψstem because of the increase in VPD or temperature presented in this paper and elsewhere is a reflection of the increase in evaporative demand and an increase in E. Equations 1 and 2 also explain the results reported in Figure 4⇑. As water is depleted in the soil profile, leaf transpiration decreases (because of reduced gs or increased Rl) and the influence of VPD and temperature on Ψl is diminished and Ψsoil becomes a more dominant factor (Table 2⇑). Therefore, the slope of the relationship between Ψl and VDP is less for water-stressed vines than for well-watered grapevines. These differences in the response to VPD between fully irrigated and water-stressed vines are supported by a report that diurnal Ψl of irrigated grapevines correlated with VPD, but no such relationship was found in vines that had not been irrigated (Smart and Barrs 1973). An extreme example of soil moisture availability having a stronger effect on Ψl than does VPD has been reported; midday Ψl of nonirrigated Chardonnay grapevines in September was −1.81 MPa with a low VPD of 1.9 kPa at the time of measurement (Williams and Araujo 2002).
The relationship between Ψl and/or Ψstem and VPD would be useful as a baseline to determine whether grapevines are well watered. It is often assumed that the application of water, regardless of the amount, results in vines that are not stressed for water. An example is found in a study where Ψl was −1.5 MPa for both irrigated and water-stressed vines by midafternoon on 7 January, which had a maximum temperature of 34.9°C and a noon humidity of 36% (Smart 1974). Based on the regression in Figure 2⇑, the Ψl of well-watered vines at that temperature would be expected to be no lower than −0.85 MPa. The lowest Ψl value obtained in our study at that temperature was greater than −1.0 MPa. The vines in the Smart (1974) study were furrow irrigated approximately every 10 days, but it was not reported when the last irrigation event occurred before January 7 or the amount of water applied each time. Even when vines are irrigated numerous times daily, values of net CO2 assimilation, gs, and Ψl can be significantly lower for deficit-irrigated vines (water applied at 0.6 or less of measured ETc) compared to those irrigated at ETc or greater (Williams and Trout 2005). Therefore, it appears that vines receiving irrigation are not necessarily well-watered with maintained high values of A, gs, and Ψl, as noted elsewhere (Schultz 2003).
Plant species have been classified as having either isohydric or anisohydric stomatal behavior, which affects the differences in the diurnal timecourse of E and Ψl for plants that are fully irrigated compared with those that are water-stressed (Tardieu and Simonneau 1998). It has been assumed that grapevines exhibit isohydric stomatal behavior because Ψl of water-stressed grapevines does not drop significantly below that of watered vines during the day (Medrano et al. 2003). An alternative explanation would be that the Ψl of grapevines at midday is similar across a range of soil water availabilities (Cifre et al. 2005). However, Schultz (2003) concluded that the V. vinifera cultivar Grenache exhibited near-isohydric stomatal behavior while Syrah exhibited anisohydric behavior (i.e., Ψl of water-stressed vines was significantly lower than that of the watered control throughout most of the day). Based on the data presented here, Thompson Seedless, Cabernet Sauvignon, and Merlot could be considered cultivars with anisohydric stomatal behavior. For all three cultivars, Ψl of fully irrigated vines was always significantly greater than that of the deficit irrigated or nonirrigated vines, regardless time of day (Table 3⇑) or VPD at the time of measurement (Figure 4⇑). Under reexamination, the findings of Medrano et al. (2003) indicate that when Ψl of water-stressed vines of Tempranillo and Manto Negro are compared with those of well-irrigated vines (irrigation at 100% of potential evapotranspiration) both cultivars exhibit anisohydric stomatal behavior.
The data presented in this paper has practical applications. The relationship between Ψl or Ψstem and VPD (or temperature) would be useful in determining whether the amount of water in the soil profile is limiting growth early in the season, as the baseline derived here indicates a fully irrigated grapevine. In addition, the time span within which Ψl or Ψstem is measured could be expanded since changes in environmental conditions are taken into account (as long as PFD is nonlimiting). The senior author has found that hourly values of ambient temperature and relative humidity measured in a vineyard were similar to those obtained from CIMIS and PRWCA weather stations. Thus, environmental data are readily available to growers in California. Lastly, the lessened response of Ψl of water-stressed vines to changes in VPD would indicate that once Ψl is less than −1.2 MPa, soil moisture availability could be assumed to be the primary factor affecting vine water status.
A nonstress baseline has been used in the calculation of the Crop Water Stress Index (CWSI) (Idso et al. 1981, Jackson et al. 1988). The nonstress baseline compares the relationship between differences in the canopy temperature of plants minus that of ambient temperature at a specific VPD for plants transpiring at their full potential (fully irrigated). Such a baseline has been developed for grapevines growing in the San Joaquin Valley for use in calculating a CWSI (Grimes and Williams 1990). A fully irrigated baseline, similar to one previously proposed (Shackel et al. 2000), could also used on grapevines with the relationship between either Ψl or Ψstem and VPD found in this study. In Shackel et al. (2000), the water potential deficit equaled a fully irrigated Ψstem value (derived from the fully irrigated or nonstress baseline of Ψstem as a function of VPD, [McCutchan and Shackel 1992]) minus an observed or measured Ψstem. This water potential deficit was highly correlated with the degree of irrigation deficit across several years of study in numerous orchards. The usefulness of this type of calculation currently is being examined by the senior author under different irrigation regimes.
Conclusions
Both Ψl and Ψstem of well-watered grapevines varied as a function of ambient temperature and VPD at the time measurements were made. Approximately 75% of the variation in Ψl of well-watered grapevines—using four cultivars, grown at five locations, measured on different dates and times of day throughout the growing season, across years, and irrigated at different frequencies—was explained by VPD at the time of measurement. Based on the regression here, estimates of Ψl at a VPD of 2 and 5 kPa for fully irrigated grapevines would be −0.65 and −0.89 MPa, respectively. Leaf Ψ of deficit or nonirrigated grapevines was less responsive to VPD than the fully irrigated vines when Ψl was <−1.2 MPa. Such information would be useful in determining whether vines were stressed for water in any vineyard irrigation management program.
Footnotes
Acknowledgments: L.E. Williams thanks Steve Carter of J. Lohr Winery, Mike Wanless of Wente Vineyards, Craig Weaver of Calloway Winery, and John Simpson of Simpson Vineyards for use of their vineyards and their assistance. The authors thank the USDA-ARS Water Management Research Laboratory for their assistance with the weighing lysimeter.
This study was funded in part by grants from the American Vineyard Foundation, Viticulture Consortium, and the California Competitive Grants for Viticulture and Enology. P. Baeza was supported by a grant from the Programa Nacional para la Movilidad de Profesores de Universidad del Ministerio de Educación y Ciencia de España.
- Received May 2006.
- Revision received August 2006.
- Revision received October 2006.
- Copyright © 2007 by the American Society for Enology and Viticulture
Literature Cited
Vol 58 Issue 2


Jump to section
Related Articles
Cited By...
More from this TOC section
Similar Articles
