


Abstract
Grape texture analyses were performed at ripeness on seven grapevine varieties (Barbera, Brachetto, Cabernet Sauvignon, Dolcetto, Freisa, Nebbiolo, and Pinot noir) collected during the 2004 and 2005 seasons in Piedmont, northwestern Italy. Different compression tests were applied on whole berry, skin, and seed and mechanical indices were estimated. Univariate and multivariate statistical analysis were applied to differentiate the varieties and to determine the main sources of variability present in the data sets. The texture indices in the grape characterization depended on variety and harvest season. Moreover, texture profile analysis (TPA) was the most appropriate test for grape differentiation.
A number of morphological and molecular markers have been used to characterize grapevine Vitis vinifera (L.) germplasm (Galet 1979, Botta et al. 1995, Bowers et al. 1993). Unfortunately, these techniques are time-consuming and often depend on multiple factors (Levadoux 1956). In wine production, the composition of grapes at harvest is an important determinant of their quality (Bisson 2001). But there is no single set of parameters that defines ripeness for a particular grape variety under all circumstances and for all purposes. The evaluation of ripeness, expressed in analytical parameters is, by itself, not sufficient to completely predict grape enological potential (Failla et al. 2005). Various research has shown phenolic content to be a key defining factor of grape maturity and enological potential (Saint-Cricq et al. 1998, Romero-Cascales et al. 2005).
Several profound physiological changes occur during grape berry development (Pratt 1971). Plant structure plays a key role in determining texture (Waldron et al. 2003), which represents one of the most important quality characteristics of edible fruits and vegetables. Texture comprises all physical characteristics measured in terms of force, distance, and time, which are related to deformation under an applied force (Bourne 2002). Previous studies have analyzed the modifications of some grape textural properties (Abbal et al. 1992, Robin et al. 1997). Many of these studies focused on table grape varieties (Mencarelli et al. 1994, Sato et al. 1997, Sato and Yamada 2003). Grape mechanical properties can influence the winemaking process; nevertheless few winegrape texture analyses have been conducted (Lee and Bourne 1980, Rolle et al. 2007a).
Texture is a complex attribute influenced by numerous factors. To date, however, few systematic texture studies have been carried out using multivariate statistical analysis. These techniques could provide a powerful means to elucidate the methods and parameters that are potentially useful for grape texture analysis. The mechanical behavior of winegrapes under compression loading was examined to determine the ability of this technique to understand ripening and to differentiate winegrapes.
Materials and Methods
Sampling.
Barbera, Brachetto, Cabernet Sauvignon, Dolcetto, Freisa, Nebbiolo, and Pinot noir grapes were collected from different vineyards located in the same geographical region of Piedmont (northwestern Italy) during the 2004 and 2005 seasons. In 2004, Nebbiolo grapes were sampled from six vineyards and Barbera, Brachetto, Cabernet Sauvignon, Dolcetto, Pinot noir, and Freisa were sampled from three vineyards. In 2005, Nebbiolo grapes were sampled from four vineyards, Barbera, Brachetto, Dolcetto, and Freisa were sampled from three vineyards, and Pinot noir and Cabernet Sauvignon were sampled from two vineyards.
Grapes were sampled at harvest and varied depending upon the style of wine being made from each grape variety in its area of cultivation. A total of 400 berries were randomly hand-picked from designated vines according to a published sampling method (Carbonneau et al. 1991), in which bunch fragments are randomly picked in the midsection of the cane or the cordon, excluding those in the first rank of the parcel. Each berry was detached by cutting its pedicel and visually inspected before analysis. Tests were performed the same day the berries were picked to avoid alterations.
The measurements for the appraisal of grape mechanical properties were made on subsamples of 20 berries taken from the 400 berries, for each variety and for each test. The remaining berries were used for physicochemical determinations. Total soluble solids (Brix), titratable acidity (TA), and pH (EEC 1990) were measured.
Texture analysis procedure.
A Universal Testing Machine (UTM) TAxT2i Texture Analyzer (Stable Micro Systems, Surrey, UK) equipped with a HDP/90 platform and a 25 kg load cell was used for analysis. All acquisitions were made at 400 Hz; data were evaluated using the Texture Expert Exceed software package (version. 2.54 in Windows 2000). Operative conditions (Table 1⇓) were chosen based on research results presented in the literature (Grotte 2001, Bourne 2002, Rolle et al. 2007b).
The operative conditions applied for the texture analysis tests.
A force calibration was required so that the system could calculate the relationship between the signal from the load cell and force. The calibration was first made without using a load and corresponded to what the software recognized as the zero force. A 5 kg weight was then placed on the UTM platform and the result was stored as loaded level. A probe calibration was also required so that the UTM could record all probe movements and locate the tip relative to another surface. The contact force and the return distance varied according to the test.
For the berry skin hardness test, the berries were placed on the metal plate of the UTM with the pedicel in a horizontal plane so that it was consistently punctured in the lateral face. A 2-mm needle probe was used, as it is thin enough to puncture the skin without bursting the berry and to avoid the effect of the flesh pressure on the test (Letaief et al. 2008).
For berry skin thickness measurement, a piece of skin ~0.25 cm2 was removed at the lateral side of each of the 20 berries with a razor blade. Care was taken when removing the pulp from the skin and when positioning the skin sample on the UTM platform to prevent folds in the skin. It was convenient to insert an instrumental trigger threshold equal to 0.05 N that enabled the plane surface of the probe to adhere completely to the skin sample before the acquisition started, allowing a reduction or elimination of the “tail” effect due to the postponement of the contact point (Bourne 2002).
For the seed hardness test, one seed from each of the 20 analyzed berries was carefully removed from the pulp and cleaned with an adsorbent paper before analysis.
For the texture profile analysis (TPA), 20 intact berries were compressed twice, two seconds apart, in a reciprocating motion imitating the action of the jaw under a deformation of the berry of 25% (Drake and Gerard 1999, Friedman et al. 1963). From the resulting force-time curve, the test extracted a number of textural parameters (Table 1⇑).
Statistical analysis.
Analysis of variance was applied to all the variables studied. Mean values obtained in the different categories were compared by one-way ANOVA. Each variety was considered a data vector of 12 texture variables and therefore principal component analysis (PCA) was applied. Univariate and multidimensional statistical analysis were performed with the statistical software SPSS (version 12.0; SPSS Inc., Chicago, IL).
Results and Discussion
Typical force-deformation or force-time curves for the grape berries analyzed with the UTM are shown in Figure 1⇓. The ANOVA results concerning Brix, TA, pH, and the mechanical response to texture tests are reported in Tables 2⇓, 3⇓, 4⇓, and 5⇓.
Brix, titratable acidity (TA), and pH of Barbera, Brachetto, Cabernet Sauvignon, Dolcetto, Freisa, Nebbiolo, and Pinot noir berries measured at harvest, for two vintages (2004 and 2005). Reported values are the mean of vineyards.
Berry skin texture parameters of Barbera, Brachetto, Cabernet Sauvignon, Dolcetto, Freisa, Nebbiolo, and Pinot noir from two vintages (2004 and 2005). Reported values are the mean of vineyards at harvest.
Seed texture parameters of Barbera, Brachetto, Cabernet Sauvignon, Dolcetto, Freisa, Nebbiolo, and Pinot noir from two vintages (2004 and 2005). Reported values are the mean of vineyards at harvest.
Texture profile analysis parametersfor Barbera, Brachetto, Cabernet Sauvignon, Dolcetto, Freisa, Nebbiolo, and Pinot noir from two vintages (2004 and 2005). Reported values are the mean of vineyards at harvest.

Schematic of typical curves corresponding (left to right) to berry skin hardness test, skin thickness test, seed hardness determination, and the two-bite texture profile analysis. Fsk: maximum break force; Wsk: area under the curve limited between 0 point and Fsk; Spsk: distance between the point of probe contact and berry skin (trigger) and platform base; Fs: firstpeak; Ws: area under the curve limited between 0 point and Fs; D1: break distance; Es: slope of stress-strain curve in linear section; A1, A1w, A2, A2w: areas under compression and withdrawal portions of first bite and second bite curve; P1: peak of first compression; d2: crosshead travel corresponding to second compression.
General observations.
Climatic conditions in 2004 were different from those in 2005, which influenced grape development and composition at harvest. The difference between harvest seasons can be justified by climate (Jones and Davis 2000). Climate can influence grapevine phenology and composition. Data from different years must therefore be analyzed separately and not averaged, as has often been done in previous works (Mattheou et al. 1995). In 2005 grapes at harvest were less ripe than in 2004, as revealed in lower sugar content, higher total acidity, and lower pH (Table 2⇑).
Skin characteristics.
At harvest, the grape skin hardness determined by a puncture test was characteristically higher in 2004 than in 2005 for all varieties except Barbera, which had lower break force in 2004 than in 2005 (Table 3⇑). Moreover, grape skins were thicker in 2004. Skin hardness differed significantly among varieties; Barbera grapes had the hardest skin in 2005. Significantly different skin thicknesses were also noted and can be explained by the number of skin hypodermal layers, which depends on the variety (Considine and Knox 1979, Hardie et al. 1996). Thicker skin is not necessarily associated with harder skin, as can be seen with Cabernet Sauvignon.
Previous work on white winegrape varieties such as Chardonnay and Riesling indicated that Brix is highly correlated with puncture force (Lee and Bourne 1980). Consequently, varieties with the same Brix would also have similar skin break force and vice versa, and higher values of the one would correspond to higher values of the other. However, that was not observed in all cases here (Table 3⇑). Varieties with higher Brix did not necessarily have lower skin hardness. The observation of Lee and Bourne (1980) may not be applicable to all grape varieties and in all circumstances.
Seed characteristics.
There is no evidence of a relationship between seed hardness break force and seed break energy. Varieties with the highest break force did not necessarily have the highest break energy. Moreover, both indices did not appear to be related to seed stiffness (expressed with the Young modulus) (Table 4⇑). Therefore, harder seeds such as those of Nebbiolo would have a more lignified innermost layer at ripeness than other varieties. However, this process of seed lignification is not necessarily related to the quality and quantity of phenolics present in the seeds or extracted from seeds during winemaking (Considine and Knox 1979, Ristic and Ilan 2005).
Berry characteristics.
The TPA further demonstrated significant varietal differences (Table 5⇑). In 2004 and 2005, Pinot noir had the hardest berries, Barbera and Dolcetto grapes had the most cohesive berries, and Pi-not noir berries were the least cohesive. Barbera had the highest gumminess, springiness, and chewiness. However, the berries of Barbera, like those of Nebbiolo, had the highest resilience in 2004 but not in 2005. Nebbiolo had the most resilient berries in 2005.
Importance of texture parameters.
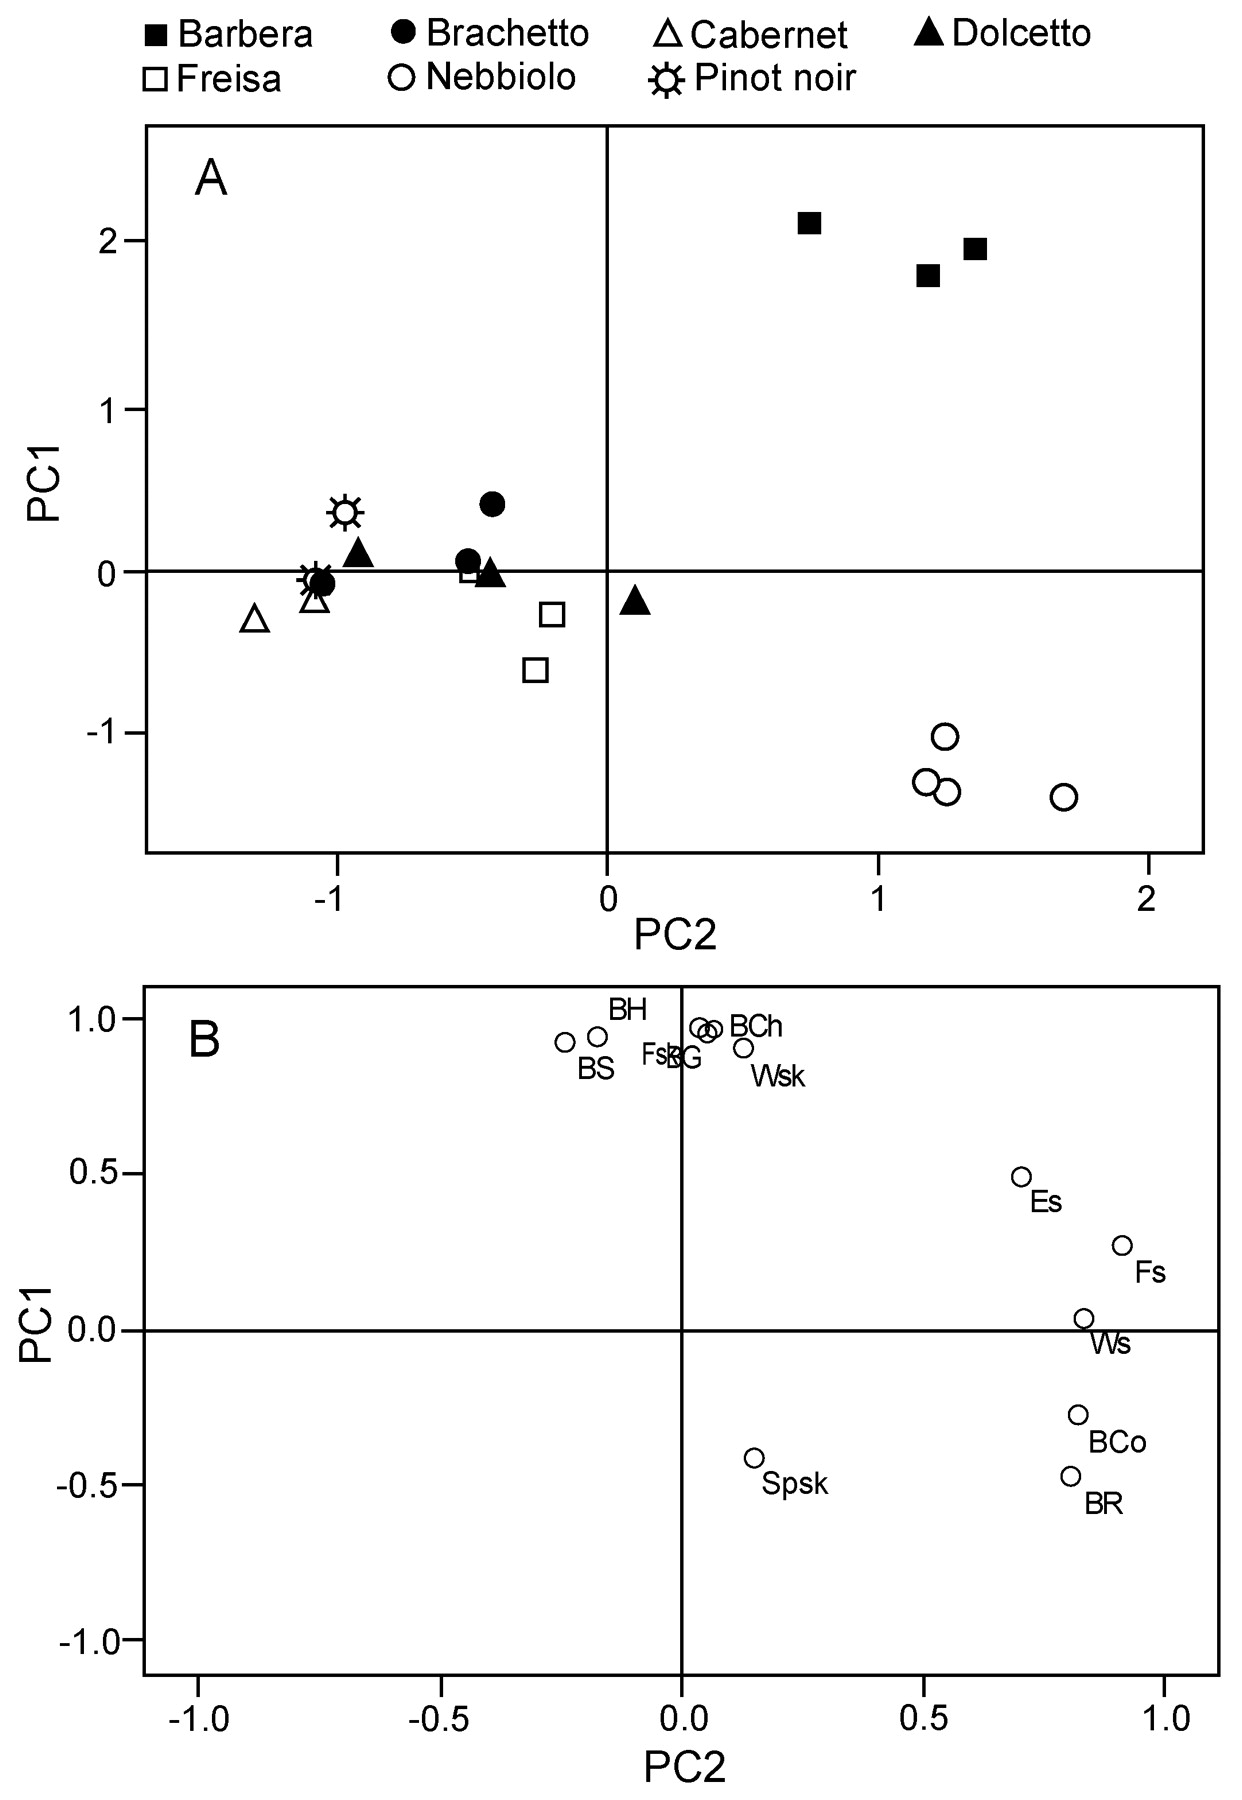
In order to explain the differences in grapes and to obtain more information on the texture parameters that primarily influence the similarities and differences among varieties, principal component analysis was performed on 2004 and 2005 data to provide partial visualization of the data set in a reduced dimension. A clear differentiation among varieties was observed in 2004. Four principal components with eigenvalues higher than 1 (accounting for 88.3% of total variance) were obtained. From the loadings of the variables (Table 6⇓), PC1 (38.6% total variance) was most highly correlated with gumminess, springiness, and chewiness, with gumminess as the best representative. Seed break force and energy dominated in PC2 (24.1% total variance). Skin thickness, berry hardness, and cohesiveness dominated in PC3 (14.3% total variance). Skin break force correlated with PC4 (11.3% total variance). The projection of the samples along the directions is identified by the first two PCs in Figure 2A⇓, where the first principal component PC1 of grape samples is plotted against the second principal component PC2. The separation of the different categories of grape samples from this PC1-PC2 scatterplot indicates that grapes from Nebbiolo, Brachetto, and Barbera varieties were separated from Freisa, Cabernet, and Dolcetto by PC1. In addition, Freisa and Nebbiolo were separated from Dolcetto and Pinot noir by PC2.
Loadings of 2004 parameters in the first four principal components.

Scores of the 2004 grape samples in the plane defined by the first two principal components: PC1 and PC2. See Table 1⇑ for key to abbreviations.
Berry gumminess, springiness, and chewiness appear to correlate, as they are located at the top of the first quadrant (Figure 2B⇑). The seed texture properties do not correlate with berry gumminess, chewiness, and springiness, but they do correlate with each other.
In 2005, three principal components with eigenvalues higher than 1 (accounting for 90.9% of total variance) were obtained. From the loadings of the variables (Table 7⇓), PC1 (52% total variance) was most highly correlated with the TPA parameters (berry hardness, gumminess, springiness, and chewiness) and with skin break force and energy. Seed break force dominates in PC2 (29.9% total variance), and skin thickness dominates in PC3 (9% total variance). The scores scatterplot on the two first principal components (Figure 3A⇓), indicating the differences among the 20 grape samples, which represent different vineyards of the seven varieties.
Loadings of 2005 parameters in the first four principal components.

Scores of the 2005 grape samples in the plane defined by the first two principal components: PC1 and PC2. See Table 1⇑ for key to abbreviations.
Even in 2005, berry gumminess, springiness, and chewiness correlate (Figure 3B⇑). The seed texture properties do not correlate with them, but they do correlate between each other. In contrast to the 2004 results, berry skin hardness parameters correlate with berry gumminess, springiness, and chewiness.
Significant differences were observed in varieties in both 2004 and 2005 according to their texture characteristics. The genotype of the fruit is the major limiting factor when comparing grapes, resulting in differences in berry formation and berry composition. Different grape varieties have different berry structure at ripeness, which is the major determinant of textural quality (Roudot 1996). The differences among varieties in cell-wall composition are observed especially in the pulp, which supports the importance of the TPA parameters in grape differentiation, if compared to other texture indices (Chardonnet et al. 1994). Varieties with skins more resistant to puncture, such as Barbera, would have more insoluble skin pectic polysaccharides at ripeness (Haker et al. 1997). They would also have more cohesive berry skin cell walls, thus constituting a more efficient barrier against exterior aggressions and sensitivity to parasites (Gabler et al. 2003).
As skin thickness and skin hardness are not related to each other, berry hardness might provide a more helpful index for the viticulturist than berry thickness, especially regarding decisions related to vine treatments. This texture parameter could also be helpful in some wine-making practices. Red varieties with harder skins may, for example, require harsher extraction methods, such as the use of pectolytic enzymes, heat treatments, or cryo-maceration for rapid degradation of the grape skin and extraction of its components. The effect of these wine-making techniques on phenolic extraction in red wines has been summarized (Sacchi et al. 2005).
The PCA analysis indicates that TPA is more suitable than the tests applied on the skin or seed to explain varietal differences.
Conclusion
The use of mechanical tests allows quantitative measurement of the mechanical behavior of the berry and its solid components. Cultivars demonstrate different reactions to the stress applied, dependent on harvest season. The TPA could be appropriate to explain varietal differences. Further studies are necessary to show how these texture indices evolve during grape development and if they could help make decisions related to the degree of grape ripeness and the winemaking process. Moreover, there is great variability in the cellular composition which might be correlated to the texture indices as applied to this work. Further work on this topic is anticipated.
- Received July 2007.
- Revision received December 2007.
- Revision received February 2008.
- Copyright © 2008 by the American Society for Enology and Viticulture
Literature Cited
Vol 59 Issue 3


Jump to section
Related Articles
Cited By...
More from this TOC section
Similar Articles
