


Abstract
Selected winemaking conditions were applied to fruit with ~20.3 and ~24.9 Brix over two seasons. Merlot grapes were harvested 33 (2011) and 34 (2012) days apart. At each harvest, half of the must was adjusted to emulate the other harvest’s soluble solids content to evaluate the effect of ethanol (EtOH) on phenolic extraction at different fruit maturities. Additionally, two maceration lengths of 10 days (control) and 30 days (extended maceration; EM) were tested. Control wines had significantly higher anthocyanin content, saturation, and red color component, whereas EM wines had enhanced tannin extraction from seeds, lower anthocyanin content, lower saturation, higher hue, and higher large polymeric pigment content. EtOH differences up to 2.7% (v/v) showed no significant effect on tannin and anthocyanin extraction, suggesting a minor role of this solvent under standard winemaking conditions. The later harvest date had a prevailing and positive effect on the sensory profile of the wines over winemaking factors such as maceration length and EtOH treatments. Wines from the early harvest fruit were defined by fresh vegetal character, acidity, and low color saturation. Wines from the late harvest fruit were defined by viscous mouthfeel, sweet taste, and fruit-derived aromas. Extended maceration shifted the sensory profile toward higher astringency, lighter and yellower color components, and cooked vegetal aromas. Chaptalization of early harvest fruit to 25 Brix shifted the sensory profile from cooked and fresh vegetable characters toward sweet taste, alcoholic, floral, chocolate/caramel attributes, astringency, and viscous mouthfeel. Overall, unripe fruit and the application of extended maceration had a negative impact on the sensory profile of the wines, whereas chaptalization of unripe fruit yielded wines with an improved sensory profile.
- maturity
- extended maceration
- ethanol
- chaptalization
- saignée/water-back
- anthocyanins
- tannins
- seed extraction
- sensory properties
In southeastern Washington State the growing season is characterized by high irradiance, warm days, and cool nights, with a long-term (1954–2005) average heat accumulation (growing degree days [GGD], base 10°C) of 1344 GDD (Keller and Mills 2007). The growing season is short (158 frost-free days), and thus, during unseasonably cold growing seasons, even midripening varieties such as Merlot may not achieve commercial ripeness. There are strong differences in opinion on how to conduct maceration in such conditions. Research in model wines suggests that shorter maceration times should be favored in unripe fruit to minimize seed tannin extraction. For example, tannin extractability from seeds was found to increase relative to that of the skins in unripe berries (i.e., <20 Brix) (del Llaudy et al. 2008). The mechanistic basis put forth to explain this outcome is that seed tannins become progressively bound to cell wall components during ripening as a result of an oxidation process (Kennedy et al. 2000). Thus, the extractability of seed tannins into the wine reportedly decreases during ripening and the opposite seems to apply for the extraction of skin tannins (del Llaudy et al. 2008). Greater tannin extraction from seeds in unripe grapes is regarded as undesirable (del Llaudy et al. 2008), as seed-derived wine tannins are associated with an increased perception of coarseness, drying, and chalkiness, which are ascribed to an increased degree of galloylation (Vidal et al. 2003). Flavan-3-ols such as catechin and epicatechin from seeds also contribute to bitterness (Peleg et al. 1999). Therefore, seed removal at the early stages of fermentation has been recommended as an option to reduce seed extraction in unripe fruit. Elimination of 80% of the seeds in microvinifications (10 kg) of unripe Cabernet Sauvignon grapes (19.7 Brix) led to a 31% decrease in the wine tannin content and also decreased bitterness and astringency (Canals et al. 2008). In contrast, a commercial-scale example of the same procedure applied to Merlot grapes (~25 Brix, no percentage of seed removed reported) had no effect on tannin extraction (Lee et al. 2008). Clearly, seed removal prior to fermentation is a labor-intensive procedure and liable to inconsistent results. Conversely, maceration length can be easily adjusted to manage seed tannin extraction during maceration (Harbertson et al. 2009, Casassa et al. 2013). However, the practical impact of fruit maturity on tannin extraction in actual winemaking conditions as opposed to model wine extractions remains unexplored.
The effect of the practice known as chaptalization, which is the addition of sucrose prior to fermentation to increase the ethanol content of the final wine, on wine chemical and sensory composition goes beyond that of a simple adjustment of the ethanol content. Indeed, ethanol (EtOH) has been reported to increase wine body and sweetness in winelike matrices (Zamora et al. 2006) and may also modulate astringency (Gawel 1998). EtOH may act as a hydrogen bond disruptor, thereby reducing the binding of tannins to proteins in the oral cavity as well as the self-association of bound tannins (Gawel 1998, Fontoin et al. 2008). Additionally, greater EtOH concentrations increase mucosal lubrication resulting from heightened parotid salivation (Gawel 1998), thus reducing the perception of roughness (Demiglio et al. 2008). On the negative side, high EtOH concentrations decrease the headspace concentration and partitioning of volatile compounds (Le Berre et al. 2007), which results in a reduction of perceived aromas (Goldner et al. 2009, Harbertson et al. 2009). The EtOH concentration during maceration can also play a role in the extraction of seed tannins. In model wines, Singleton and Draper (1964) reported increased tannin extraction from seeds at 14% EtOH relative to 11% EtOH after 421 hr (~17 days). Increasing EtOH concentration may selectively promote the extraction of seed tannins due to the dissolutive effect of EtOH on the lipidic outer coat of the seeds (Glories and Saucier 2000). Alternatively, the postfermentation extraction of seed tannins may be the result of a desorption mechanism whereby EtOH disrupts the noncovalent interactions involving tannins that were bound to cell wall material (Hanlin et al. 2010). An increase in EtOH concentrations should lead to higher desorption and tannin extraction, suggesting that chaptalization of unripe grapes can be detrimental. This is because a combination of enhanced seed tannin extraction in unripe fruit and the desorptive and/or dissolutive effect encountered at high EtOH concentrations could increase the proportion of seed-derived tannins.
Here we evaluated the effects of fruit maturity, maceration length, and EtOH concentration on wine phenolics, chromatic composition, and sensory attributes of Merlot wines. Grapes were harvested at ~20.3 and ~24.9 Brix during two consecutive seasons. Half of the low Brix musts and half of the high Brix musts were adjusted before fermentation to emulate the Brix of the other harvest. Each of the adjusted musts were additionally subjected to 10 days of skin contact (control wines) and to 30 days of skin contact (EM wines) to evaluate the chemical and sensory effects of grape maturity and different EtOH concentrations under two contrasting maceration protocols.
Materials and Methods
Vineyard site.
The experiment was conducted during the 2011 and 2012 growing seasons in the Paterson Ranch of Ste. Michelle Wine Estates, in Paterson, Washington. Vitis vinifera L. cv. Merlot (clone 3) was planted in 2000–2003 with a vine by row spacing of 2.13 m × 3 m in a north-south orientation. The vineyard lies in the Columbia Valley American Viticultural Area and is drip-irrigated (two pressure-compensated emitters per vine, 2 L/hr flow rate). Growing degree days (GDD) data were obtained from the Washington State University (WSU) AgWeatherNet weather station in West Paterson, WA.
Winemaking and experimental design.
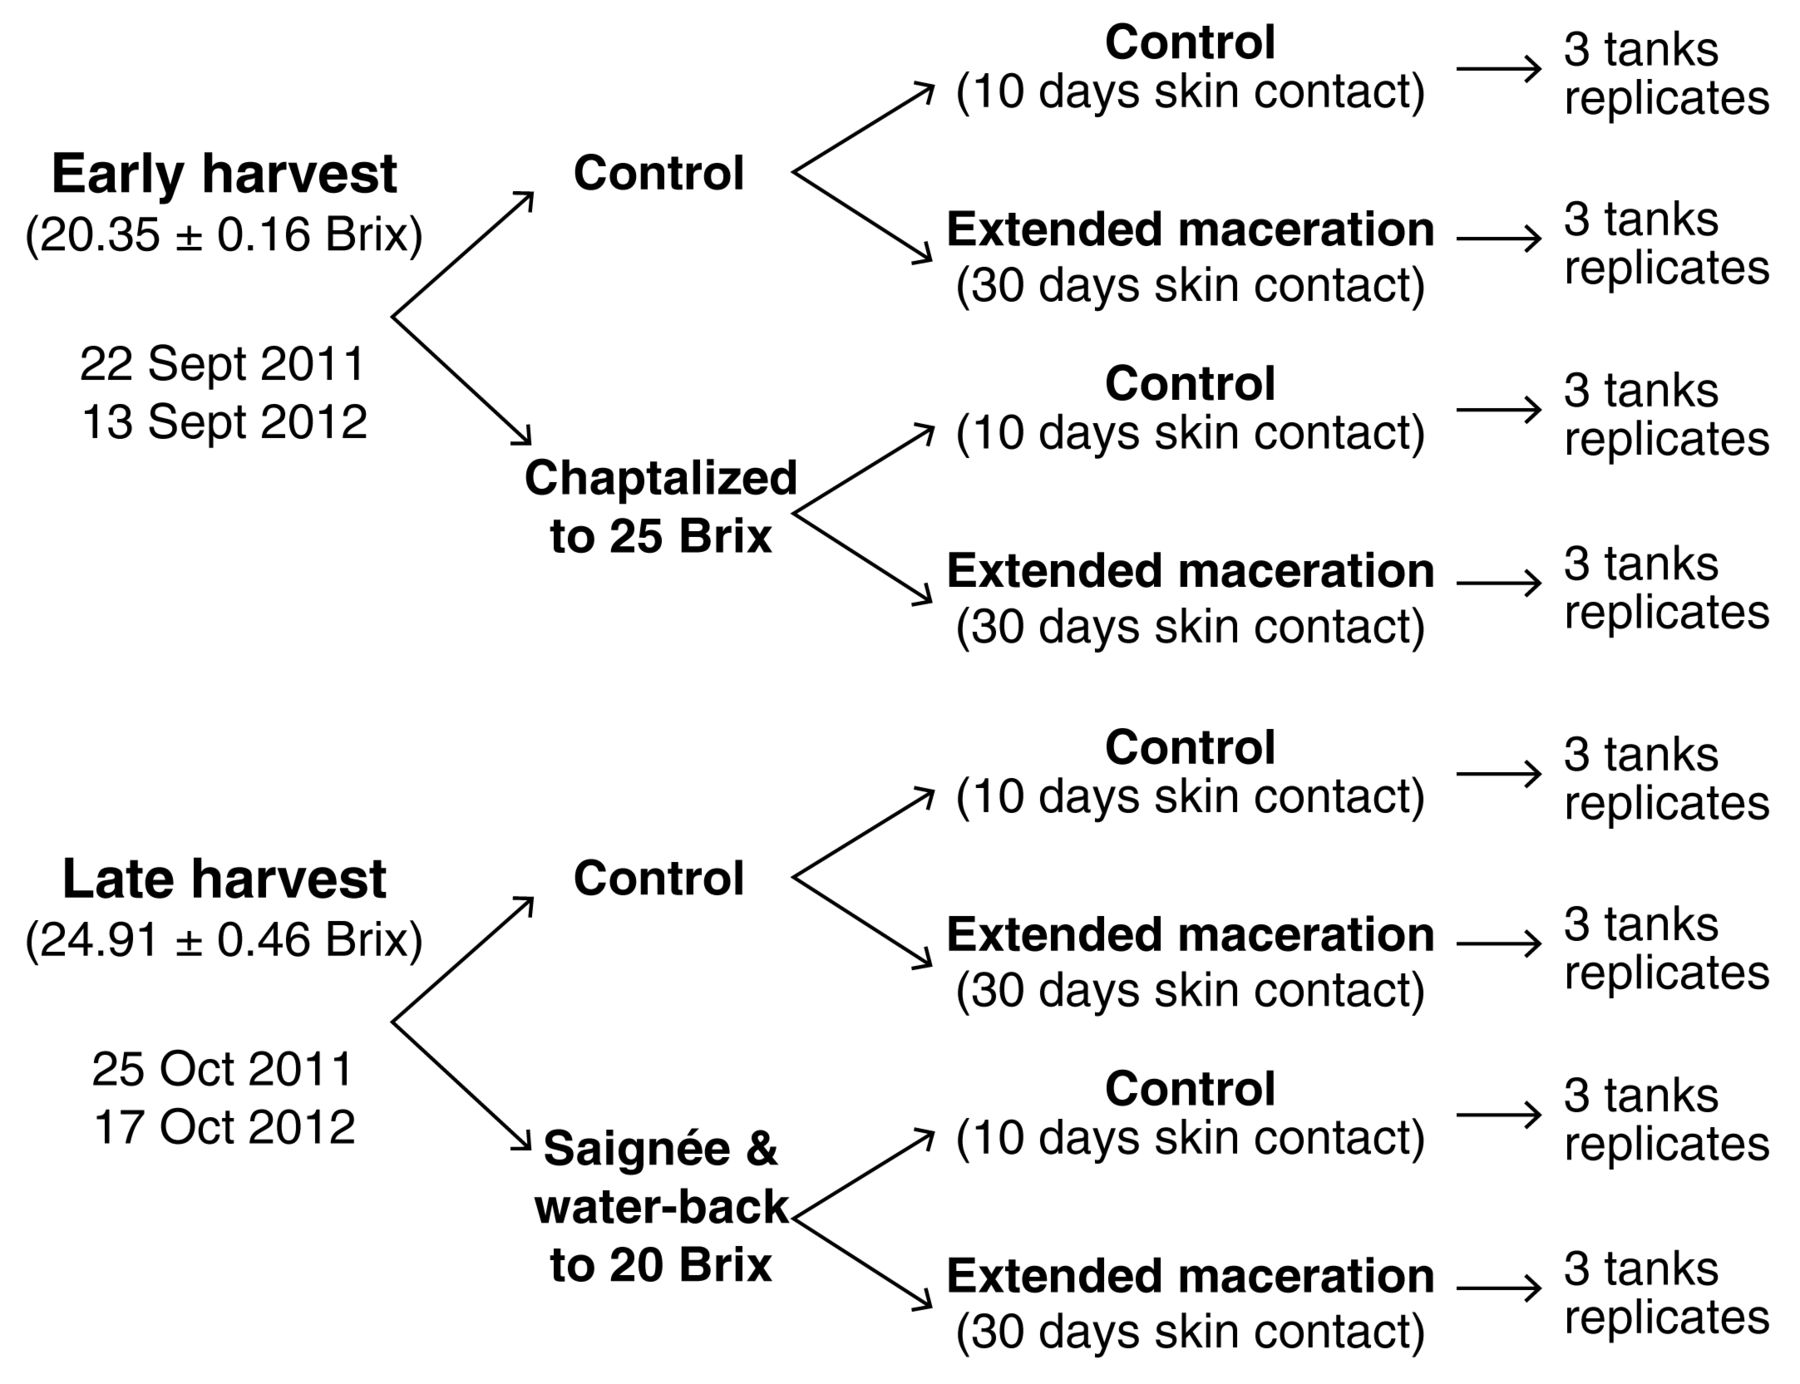
Grapes were manually harvested on 22 Sept and 25 Oct (2011) and on 13 Sept and 17 Oct (2012). The fruit was harvested in 500 kg capacity bins for a total of 5,280 kg (2011: 4 treatments × 3 replicates × 2 harvests, 220 kg/replicate) and 7,200 kg (2012: 4 treatments × 3 replicates × 2 harvests, 300 kg/replicate) and transported to the WSU winery facility. Full details of the experimental design are presented in Figure 1. The first harvest (22 Sept 2011 and 13 Sept 2012) and the second harvest (25 Oct 2011 and 17 Oct 2012) are referred to as early and late harvest, respectively. Briefly, at each harvest point the fruit was divided into two equal lots and upon crushing the musts in one of the lots were adjusted to emulate the other harvest’s soluble solids. For the early harvest treatments, chaptalization with a sucrose concentrate (81 Brix) was used to adjust the sugar levels in one of the lots (average Brix at harvest: 20.35 ± 0.1) to a target Brix of 25.0 without altering the total volume of the ferment significantly. For the late harvest treatments (average Brix at harvest: 24.91 ± 0.4), a portion of the must was bled-off (saignée) and dechlorinated water adjusted to 4.5 g/L tartaric acid was added to emulate the soluble solids of the first harvest date (target Brix: 20.0) without affecting the total volume. All adjustments were made within 4 hr after crushing. For both the early and late harvest treatments, two skin contact treatments were applied in triplicate: control wine (10-day skin contact time) and extended maceration wine (EM: 30-day skin contact time), giving 24 separate fermentations each year. Processing was consistent in both years. The fruit was destemmed using a Gamma model 40 RM destemmer crusher (Toscana Enologica Mori, Florence, Italy) and pumped to the fermentors with a progressive cavity pump (Francesca, Imola, Italy). Sulfur dioxide (SO2) was added at a rate of 50 mg/L during the fermentor filling process. Fermentations were carried out in 300 L stainless-steel jacketed fermentors with mobile lids (Ghidi, Buggiano, Italy). Musts were inoculated 7 hr after crushing with selected dry yeast (Lalvin EC-1118, Lallemand, Montreal, Canada) at a rate of 250 mg/L. Malolactic bacteria (Lalvin VP41, Lallemand) was added 48 hr after yeast inoculation at a rate of 10 mg/L. Diammonium phosphate was added to raise the yeast assimilable nitrogen to 225 mg/L before fermentation. Sugar consumption during fermentation was monitored daily with a hand-held densitometer (DMA 35N, Anton Paar, Graz, Austria) and tank temperatures were maintained at 26 ± 2°C at the fermentation peak using a web-based fermentation management system (TankNet, Acrolon Technologies, Sonoma, CA). Residual sugars at the later stages of fermentation were measured by the Rebelein method (Iland et al. 2004).

Full experimental design followed for the production of Merlot wines during the 2011 and 2012 seasons.
Cap management consisted of a whole-volume tank pump-over followed by a 5 min punch down twice a day during active fermentation. Alcoholic fermentation was completed (reducing sugars <2 g/L) after 9 to 10 days in all the wines, with fermentation kinetics and temperature curves showing good reproducibility for all treatments during both years (data not shown). During postfermentation, EM wines received one 1-min punch down per day, after which the tanks were sealed and sparged under lid with N2 (30 L/min × 3 min). After completion of the maceration times allotted for each treatment, free run wines were transferred to 20 L glass carboys fitted with airlocks and maintained under controlled temperature (22 ± 2°C). Malolactic fermentation was monitored by enzymatic analysis of l-malic acid (Unitech Scientific, Hawaiian Gardens, CA) and was considered complete when the wines reached <0.1 g malic acid. After completion of malolactic fermentation the wines were racked, cold-stabilized (45 days at 0 ± 2°C), and adjusted to 35 mg/L free SO2. Prior to bottling, the wines were adjusted to 0.5 mg/L molecular free SO2. Bottling was conducted at room temperature (20 ± 1°C) using 750 mL bottles sealed with screwcap closures (Stelvin Saranex Liner, Amcor, Zurich, Switzerland), leaving a 16 mL headspace with a semiautomatic capper machine (TechnovinTVLV, Saxon, Switzerland) and stored at 10 ± 2°C.
Chemical analysis: Reagents.
Reagents for determination of phenolics are reported elsewhere (Harbertson et al. 2003). l-Tartaric acid (99%), l-malic acid (97%), l-lactic acid (85%, 13 M), glucose, fructose, and glycerol were purchased from Sigma-Aldrich (St. Louis, MO). Acetic acid (99.7%, 17 M) and HPLC-grade solvents were obtained from Merck (Darmstadt, Germany).
Fruit and wine basic analysis.
For fruit analysis, 12 (2011) and 8 (2012) 15-cluster replicates were randomly selected at harvest. For each replicate, berries were separated from the clusters and placed onto a table where two sets of 30 berries were selected at random. In the first 30 berry set, the juice was extracted using an IKA A11 analytical mill (Fisher Scientific, Waltham, MA) and the pulp solids and liquid were transferred to 50 mL tubes, centrifuged (5,000 g × 6 min at 5°C), and the supernatant analyzed for basic chemistry (Harbertson et al. 2009). In the second 30 berry set, phenolics in the fruit were analyzed as described elsewhere (Harbertson et al. 2003), with results expressed on a fresh weight (FW) basis. In wines, ethanol concentration was determined using a digital infrared spectrophotometer (Anton Paar) and free and total SO2 levels were determined with a FIAstar system (Foss Analytical, Hilleroed, Denmark).
Spectrophotometric analysis.
Must and wine samples were treated with 1 mM sodium azide to inhibit microbial activity, centrifuged (5,000 g × 5 min), and filtered through 0.22 μm filters (Fisher Scientific) before analysis. Spectrophotometric measurements were carried out with an Agilent 8453 UV-vis spectrophotometer (Agilent Technologies, Santa Clara, CA). Anthocyanins, small polymeric pigments (SPP), and large polymeric pigments (LPP) were measured as in (Harbertson et al. 2003). Tannins in the fruit, pomace, and wines were analyzed by protein precipitation with bovine serum albumin (BSA) (Harbertson et al. 2003). For pomace samples, a previously described protocol was used to analyze tannins recovered in the skins and seeds collected from the pomace of each replicate (Harbertson et al. 2009). Characterization of wine color was undertaken by means of the CIELab system. The CIELab coordinates C* (saturation or chroma), H* (hue angle), and a* (green/red component) were calculated as described (Negueruela et al. 2001) using MSCV software (Grupo de Color de La Rioja, Logroño, Spain).
HPLC-DAD-RI analysis in wines.
An Agilent 1100 series HPLC-DAD-RI system was used for all chromatographic separations. Malic, lactic, and acetic acids and glucose, fructose, and glycerol were determined using an Agilent Hi-Plex H column (300 × 7.7 mm) protected with a guard column of the same packing material. The isocratic separation solvent consisted of 4 mM sulfuric acid applied for 42 min, maintaining a flow rate of 0.4 mL/min with the column temperature fixed at 75°C. Compounds of interest were detected by refractive index (RI) (model G1362A).
Experimental design and data analysis.
Basic fruit and phenolic composition over the two seasons was analyzed by a fixed-effect two-way analysis of variance (ANOVA) with interactions. Anthocyanin and tannin extraction, polymeric pigments, and chromatic parameters in the wines were analyzed by a fixed-effect four-way ANOVA with interactions at press and at day 120 postcrushing. To avoid an increasing risk of incur in type I error, selected first-, second-, and third-order interactions were tested based on the objectives of this study, together with the only possible four-way interaction. Since second- and third-order interactions were usually significant, the main effects and first-order interactions were reevaluated by one-way ANOVA on a season basis. Fisher’s LSD test was used as a post-hoc comparison of means with a 5% level for rejection of the null hypothesis. Data analysis was performed using XLSTAT (ver. 2011; Addinsoft, Paris, France).
Sensory evaluation.
Descriptive analysis (DA) was performed on the 2011 wines for aroma, color, taste, and mouthfeel attributes (n = 3) as described in Lawless and Heymann (2010). Eleven panelists (five males, six females; aged 22 to 74 years, average age 44.1, median age 34; six with previous DA experience) were recruited based on availability and willingness to participate from students, faculty, staff, and retirees from the University of California (UC) Davis campus. Recruited panelists took part in six one-hour training sessions over two weeks, followed by nine 30-min evaluation sessions over two weeks. The Institutional Review Board of UC Davis approved the study (protocol number 3435520606). All participants gave informed oral consent, and no monetary compensation was provided.
For the aroma, taste, and mouthfeel attributes, the panelists were presented with subsets of the wines during the training sessions and asked to generate and obtain consensus on the standards (Supplemental Tables 1 and 2). Each wine treatment was presented blindly at least twice during the training sessions to the panelists. Wines were evaluated for aroma, taste, and mouthfeel attributes in individual tasting booths under white light and in pear-shaped black ISO glasses (ISO 1977) labeled with three-digit random numbers. Panelists evaluated eight wines per session and were asked to expectorate the samples. Filtered water (Arrowhead, Nestlé, Stamford, CT) and unsalted crackers (Nabisco, Kraft Foods, Northfield, IL) were provided for palate cleansing. A 30-sec break between each wine and a two-min break between the fourth and fifth wines were included to decrease palate fatigue. Samples were presented in an incomplete William Latin Square design to control for carryover effects as provided by FIZZ software (Biosystèmes, Couternon, France). The same software was also used for collecting the aroma, taste, and mouthfeel scores on an end-point labeled line scale, anchored with “low” and “high” at either end except for the attribute viscosity, in which the end-point anchors were “thin” and “thick.” The FIZZ program transferred the wine ratings into numerical values between 0 and 10.
For the color descriptive analysis, a wine color poster (Les couleurs du vin, Bouchard Ainé & Fils, Beaune, France) was used as a reference and was available to the panelists during the training sessions, where they were asked to choose one color for each wine. All panelists were screened for color blindness in the first training session using pseudo-isochromatic color testing plates (American Optical, Ontario, Canada) and were considered to have normal color vision if they could identify at least six out of seven testing plates correctly. The test was used to detect red-green defects. The panelists evaluated the color of the wine samples in the booths, where eight wines were presented in pear-shaped transparent ISO glasses (ISO 1977), labeled with three-digit random numbers, together with the reference color poster and an evaluation sheet. The color evaluations took place in individual booths, different from the aroma, taste, and mouthfeel descriptive analysis. The evaluation table had an off-white background color and two vertically mounted halogen lamps (1.4 m distant from the table surface, 30 cm between each lamp, color temperature 3,000 K) used at luminous intensity of 1580 candela (MR16 Superline Reflekto; Ushiro America, Cypress, CA). The spectral distribution of the lamps resembled a CIE standard illuminant A with more yellow and red wavelengths. During the training sessions, the panelists evaluated the color by tilting the wineglass nearly horizontally and moving it closely over the poster until the color matched the reference color and the panelists’ eyes were 35 to 40 cm from the wineglass. Once a color from the wine color poster was chosen for a given wine, it was transformed into the L* (lightness), a* (red component if a > 0), and b* (yellow component if b > 0) CIELab coordinates by means of a colorimeter (CR-400; Konica Minolta Americas, Ramsey, NJ).
Data analysis and PCA with confidence ellipses.
The trained panel data were analyzed by a three-way mixed-effects ANOVA with replication, considering panelist as random effect and wine treatments and replicates as fixed effects, including their interactions, using XLSTAT ver. 2011. Separation of the means was accomplished using Fisher’s LSD with significance established as p < 0.05. When a panelist missed a session, his/her data were computed as the arithmetic mean of the other replicates, as was the case for eight observations. Principal component analysis (PCA) using the correlation matrix with no rotation was applied to the significant (p < 0.05) sensory attributes, including the replicates, using R software (R Foundation for Statistical Computing, Vienna, Austria). Confidence ellipses indicating 95% confidence intervals were based on the multivariate distribution of Hotelling’s test for p < 0.05 and were constructed using the SensoMineR panellipse function of R as described by Husson et al. (2005).
Results and Discussion
Fruit and wine basic analysis.
Analysis of the basic and phenolic composition of the Merlot grapes revealed a significant season effect for titratable acidity (TA), pH, seeds/berry, and berry phenolics (Table 1). Seeds per berry and skin and seed tannins were higher in the 2012 fruit, whereas anthocyanins were higher in the 2011 fruit. These differences in phenolic concentration may reflect the effect of two contrasting growing seasons in key phenological stages during skin and seed development. The 2011 season was marked by a slower rate of GDD accumulation, totaling 1414 GDD by the end of the season. In the 2012 season, a faster rate of GDD accumulation led to a total of 1575 GDD (Supplemental Figure 1). Heat summation has been associated with an increase in seeds per berry (Ewart and Kliewer 1977) and total tannin concentration per berry (Pastor del Rio and Kennedy 2006). Such findings explain the higher number of seeds per berry and the overall higher tannin content, both on a fresh weight (Table 1) and a per berry basis (data not shown) in the warmer 2012 season. The colder 2011 season possibly promoted anthocyanin biosynthesis by favoring the accumulation of endogenous abscisic acid, which modulates anthocyanin biosynthesis in the phenyl-propanoid pathway (Yamane et al. 2006). This biosynthetic effect was primarily registered in the 30 days prior to the late harvest, as evidenced by the overall 48% increase in fruit anthocyanins from the early to the late harvest fruit. As intended, Brix, pH, and berry weight increased significantly in the late harvest fruit. In particular, differences in Brix between the two harvest dates averaged 4.6 Brix over the two seasons.
Two-way ANOVA showing mean separation of basic berry chemistry, berry weight, and phenolic composition of Merlot grapes harvested with two maturity levels during the 2011 (n = 12) and 2012 (n = 8) seasons and the interactive effect of both factors.
A four-way ANOVA revealed the effects on wines of maturity, season, maceration length, and the EtOH concentration generated by the different treatments (Table 2). Wines of the late harvest treatment had significantly higher pH and lower TA relative to wines of the early harvest fruit. The final EtOH concentrations confirmed that both the maturity and the EtOH adjustment treatments had the desired effect, yielding an overall difference of 2.7% (v/v) in the EtOH concentration between wines made from fruit with unadjusted Brix and wines produced with chaptalization and/or the saignée-water-back adjustment treatments. EM wines showed a statistically significant (yet practically insignificant) increase of fructose. The effect of the EtOH adjustment treatments was clear on the EtOH concentration of the low EtOH and high EtOH wines, but minor or no differences were observed in the remaining basic parameters. First-order interactive effects between maturity (M), season (S), winemaking (W), and the EtOH adjustment treatments (EtOH) were limited to TA and fructose. Significant second-order (M × W × S) and third-order interactions (M × W × S × EtOH) were observed for pH, TA, EtOH, glucose, and glycerol. Thus, the effect of maceration and maturity on these basic parameters varied according to the season or the EtOH concentration (Supplemental Table 3).
Four-way ANOVA showing mean separation of basic wine analysis of Merlot wines produced from grapes harvested with two maturity levels and with two maceration treatments and two ethanol-adjustment (EtOH) procedures during the 2011 and 2012 seasons and the interactive effect of these factors (n = 3).
Tannins, anthocyanins, and polymeric pigments.
To demonstrate the dynamic nature of the reactions involving anthocyanins and tannins and their impact on the formation of small (SPP), large (LPP), and total polymeric pigments (TPP = SPP + LPP), as well as on the chromatic features of the wines, results are presented at press (day 10 for control wines and day 30 for EM wines) and at day 120 postcrushing (Table 3). As a function of the season and maturity, wine anthocyanins at press were higher in the 2011 season and in the late season harvest wines, reflecting the trend previously identified in the fruit anthocyanin concentration (Table 1). The maceration treatment significantly altered the concentration of anthocyanins, with EM wines resulting in a reduction of wine anthocyanins relative to the control wines. In general, the decline in wine anthocyanins in EM occurred irrespective of the maturity level and the EtOH adjustment treatments, as denoted by the lack of significance of most first-order interactions at press. Factors that explain anthocyanin loss during extended maceration include adsorption to fermentation solids, anthocyanin degradation, and incorporation of anthocyanins into oligomeric and polymeric pigments (Medina et al. 2005, Harbertson et al. 2009, Casassa et al. 2013). Interestingly, inclusion of season in the W × M × S interaction showed a significant effect for the anthocyanin concentration at press. One-way ANOVA performed on each season revealed that the decrease in anthocyanins upon EM was more pronounced in the late harvest of the 2012 season and consisted of an overall difference of ~200 mg/L between the anthocyanin concentration of control and EM wines at press (Table 4). Finally, the EtOH adjustment treatments had no effect on anthocyanin extraction, probably due to the water-soluble nature of anthocyanins that do not intrinsically require EtOH for their dissolution (Cheynier et al. 2006).
Four-way ANOVA showing mean separation of anthocyanins, tannins, small (SPP), large (LPP), and total (TPP) polymeric pigment at press and at day 120 of Merlot wines produced from grapes harvested with two maturity levels and with two maceration treatments and two ethanol-adjustment (EtOH) procedures during the 2011 and 2012 seasons and the interactive effect of these factors (n = 3).
One-way ANOVA showing mean separation of anthocyanins, small (SPP), large (LPP), and total (TPP) polymeric pigments at press and at day 120 of Merlot wines produced from grapes harvested with two maturity levels and with two maceration treatments and two ethanol-adjustment (EtOH) procedures.
Significant main effects of the season and the maceration treatment were observed for wine tannins, but the EtOH adjustment treatments that produced differences of EtOH of 2.7% v/v during maceration showed no effect. Higher wine tannins in 2012 wines relative to the 2011 wines are consistent with a higher number of seeds per berry in the fruit of the 2012 season, as also observed elsewhere (Roby et al. 2004). Likewise, higher tannin extraction is an expected outcome of EM (Harbertson et al. 2009, Casassa et al. 2013), and thus the higher tannin content of EM was anticipated. Conversely, the lack of effect of varying EtOH concentrations during maceration suggests that in the ranges covered in this study (11.72 to 14.40% v/v; Table 2), tannin extraction was unaffected by this solvent. Alternatively, if seed tannin extraction is contingent upon the EtOH-mediated dissolution of the lipidic outer coat, then a minimum threshold concentration of EtOH would be required to achieve this dissolutive effect. In the context of our study, this threshold concentration was 11.7% v/v, but manipulation of the EtOH content to ~15% v/v did not increase the rate or overall concentration of extracted tannins.
Fruit maturity showed a complex effect on tannin extraction during maceration because this effect depended upon the season, as denoted by the significance of the W × M × S interaction. For example, seed tannins (FW basis) were higher in the early harvest fruit during both seasons (Table 1). Furthermore, in model wines tannin extraction from seeds has been reported to be higher in unripe fruit (del Llaudy et al. 2008, Bautista-Ortín et al. 2012). On the basis of these model wine studies, enhanced tannin extraction from the unripe seeds was anticipated in the early harvest wines. Such was the case in the 2011 season, but the opposite occurred in 2012 (Table 4), as tannin extraction was generally higher in the late harvest wines relative to the early harvest wines. A possible hypothesis to explain the nature of such discrepancy between both seasons is provided in the analysis of polymeric pigments.
With the sole exception of anthocyanins at press and tannins at day 120, all the second- and third-order interactive effects were significant. As a result, first-order interactions that were not significant became significant by inclusion of the season and the EtOH concentration effects. For example, for wine tannins at press, the first-order interactions W × M, W × S, and W × EtOH were not significant but the W × M × S and W × M × S × EtOH interactions were, suggesting that tannin extraction during extended maceration is independent of maturity and EtOH concentration for a single season but that it may vary on a seasonal basis. A one-way ANOVA performed on each season confirmed this effect for tannins at press (Table 4).
Dynamic changes were also observed in wine polymeric pigments, which were fractionated into SPP and LPP on the basis of their ability to precipitate the BSA protein (Harbertson et al. 2003). SPP are assumed to be a heterogeneous mixture of anthocyanin-derived products, including acetaldehyde cross-linked oligomers and pyranoanthocyanins that do not precipitate the BSA protein. LPP are pigmented tannin-anthocyanin polymers that precipitate with BSA; their preferential formation over SPP is generally observed during aging (Adams et al. 2004, Harbertson et al. 2009). However, in this study, an overall 2.2-fold improvement in SPP content occurred from press to day 120 postcrushing, whereas LPP only increased 1.4-fold in the same period. Furthermore, the formation of SPP was more pronounced in the 2011 season wines than in the 2012 season wines. Singleton and Trousdale (1992) had shown that the presence of anthocyanins during maceration effectively increases tannin solubilization, possibly through the covalent formation of polymeric pigments. In the 2011 season wines, anthocyanins were in higher abundance relative to tannins. In a molar excess of anthocyanins relative to tannins, a portion of the latter may have been incorporated into SPP, which were higher, particularly in the late harvest 2011 season wines (Table 4). These tannins, once incorporated into SPP, would not be accounted as extracted tannins because SPP do not precipitate with the BSA protein used in the method to assess the polymeric pigment content (Harbertson et al. 2003). Thus, the formation of SPP provides a potential explanation for the comparatively lower tannin content of the late harvest 2011 wines. Alternatively, other matrix effects such as irreversible binding of tannins by cell wall material from mesocarp or pericarp tissues (Bindon et al. 2010) can also account for the lower tannin extraction in the 2011 season.
Also of note was the effect of extended maceration in favoring the formation of LPP at press and at day 120 postcrushing. In a previous report, higher tannin levels during maceration favored the formation of LPP (Harbertson et al. 2009). This was observed in the EM wines of the present study, in which, relative to the controls, the wine tannin concentration at press in EM wines was higher, averaging 160 mg/L and 120 mg/L more tannins for early and late harvest wines, respectively. Furthermore, a significant relationship between the decrease in anthocyanins during extended maceration (also 30 days) and the formation of LPP has been reported for Washington State Merlot wines (Casassa et al. 2013), consistent with the observed decrease in the anthocyanin content in EM wines of the present study (Table 3).
CIELab color components.
Saturation (a measure of color density) and a* (a measure of the red component of color) were higher in late harvest and control wines, both at press and after 120 days postcrushing (Table 5). For the late harvest wines, saturation and a* values were ~43% and 38% higher, respectively, relative to the early harvest wines at day 120, consistent with higher amounts of anthocyanins in the late harvest treatments at this point (Table 3). Conversely, saturation and a* were lower in EM wines relative to control wines, suggesting that EM can potentially reduce the perceived red component of wine color. A significant effect of the EtOH adjustment treatment for saturation and a* was observed in favor of the low EtOH wines, but only at press.
Four-way ANOVA showing mean separation of selected CIELab parameters at press and at day 120 of Merlot wines produced from grapes harvested with two maturity levels and with two maceration treatments and two ethanol-adjustment (EtOH) procedures during the 2011 and 2012 seasons and the interactive effect of these factors (n = 3).
Wine saturation declined from pressing to day 120 in all the wines, but the magnitude of this decline depended upon the maceration treatment. For the control wines, saturation decreased 13% from pressing to day 120, as compared with EM wines, which, in addition to an initially lower saturation, decreased 17%. Hue was affected by season, maturity, and maceration but not by the EtOH treatments. Both at press and at day 120 postcrushing, hue was higher in the 2011 season, in the early harvest wines, and in EM wines.
First-order effects were in general significant for the W × S interaction but not for the W × EtOH interaction, suggesting that the magnitude of the decrease in saturation and red color component upon application of EM was dependent on the season but not on the EtOH content. A one-way ANOVA confirmed the W × S interaction, whereby the decrease in saturation upon application of EM was more pronounced in magnitude in the 2012 season but not so evident in the 2011 season (Supplemental Table 4). Second-order effects (W × M × S) were always significant, whereas third-order effects (W × M × S × EtOH) were significant for saturation and the red color component, indicating that EtOH concentration during maceration can differentially affect the W × M interaction for a given season.
Pomace recoveries of tannins.
Analysis of tannins recovered in the pomace provides insight not only on the preferred source of extraction (seed or skin tannins) but also on overall rates of extraction of fruit tannins into wine. Percentages of extraction were calculated on the basis of the tannin concentration observed at the end of the maceration length allotted for each treatment (Table 6). Overall extraction of fruit tannins (seeds + skins) into wine ranged from 12 to 16%, in agreement with reported extraction rates of 11 and 19% in Merlot (Casassa et al. 2013). However, tannin extraction rates as high as 25% have also been reported in Syrah (Bindon et al. 2010). Percentages of extraction were higher in the 2012 season wines, in the EM wines, and in the late harvest fruit. Based on previous studies in model wine extractions (Canals et al. 2005, del Llaudy et al. 2008), the finding indicating higher tannin extraction in the late harvest fruit was not anticipated. Furthermore, a comparatively higher proportion of unaccounted tannins (44%) that was not recovered in the wines or in the pomace was found for the late harvest wines. There was a significant W × M interaction for the proportion of unaccounted tannins in the late harvest wines, suggesting that the amount of unaccounted tannin was dependent upon the maceration length (Table 6). A one-way ANOVA applied on each season revealed that the proportion of unaccounted tannins in late harvest wines was consistently higher with EM (Supplemental Table 5), suggesting that the effect of the wine matrix in modulating tannin retention into wine was of higher magnitude for the late harvest and EM wines. We speculate that this wine matrix effect is a combination of factors, including physical sequestration and/or noncovalent binding of tannins by cell wall components of grape/yeast origin, precipitation, and chemical modification resulting in new tannin structures that are not amenable to protein precipitation.
Four-way ANOVA showing mean separation of the proportion of extracted tannins and skin/seed-derived tannins of Merlot wines produced from grapes harvested with two maturity levels and with two maceration treatments and two ethanol-adjustment (EtOH) procedures during the 2011 and 2012 seasons and the interactive effect of these factors (n = 3).
The proportion of skin- or seed-derived tannins extracted into wine was calculated as the difference between what was found in either the skins or the seeds at harvest and the amount left in the pomace and then dividing by the estimated amount of tannin extracted (Harbertson et al. 2009). In the EM wines, the estimated proportion of seed-derived tannins averaged ~80%. The lack of significance of the W × M, W × S, and W × EtOH interactions denoted that the proportion of seed-derived tannins in EM wines was not affected by the season, the maturity of the fruit, and the EtOH concentration during maceration. However, significant second- and third-order interactions such as W × M × S and W × M × S × EtOH, respectively, called for a closer examination of the data by a one-way ANOVA. With the sole exception of lack of significant differences between control and EM wines in the proportion of seed-derived tannins in 2011, all other comparisons favored EM wines, confirming this trend (Supplemental Table 5).
Inspection of the calculated proportion of skin- and seed-derived tannins as a function of maturity revealed that the proportion of seed-derived tannins was higher in the late harvest wines and represented, again, ~80% of the wine tannins. Thus, the observed trend of increased tannin extraction in the late harvest wines should have resulted from higher tannin extractability from seeds. Moreover, no effect of the EtOH concentration on the proportion of seed-derived tannins was observed when comparing low EtOH wines with their high EtOH counterparts (Table 6). Thus, differences in EtOH concentration during maceration as high as 2.7% (v/v) appeared to have no effect on the source of extraction of wine tannins (seeds or skins) or on the overall concentration of extracted tannins (Table 3, Table 6).
Descriptive sensory analysis.
The 2011 season wines were analyzed by a generic descriptive analysis at ~day 240. A total of 24 wines (two harvest dates × two maceration treatments × two EtOH adjustment treatments × three replicates) were analyzed in triplicate for 14 selected aroma, four taste, three mouthfeel, and three color attributes, giving 792 observations for each attribute (Table 7, Table 8). Of these, nine aroma attributes and all taste, mouthfeel, and color attributes showed a significant treatment effect (p < 0.05) and were retained for principal component analysis (PCA). The chemical attribute showed some apparent differences within the wines, but inspection of the F ratios from the three-way ANOVA showed no treatment effect (Supplemental Tables 6, 7), and thus this attribute was excluded from the PCA. PCA scores and PCA loadings are shown for the significant attributes (Figure 2). Confidence ellipses were constructed with 95% certainty according to the Hotteling’s test (Husson et al. 2005). Because the ellipses are empirical descriptions of the variability of the sensory evaluations, if ellipses are superimposed, the wines are not sensorially different (Husson et al. 2005). The first five principal components with eigenvalues >1 were retained (Kaiser 1960), but the fifth component explained a residual 5% variability and as such it was excluded to improve the interpretation. The first four principal components explained 91% of the cumulative variability, with PC1 accounting for ~41% of the total variance. The first principal component segregated the wines as a function of fruit maturity. The centroids corresponding to the wines made with fruit from the early harvest were all positioned in the positive quadrant of the PCA plot, with the sole exception of the control wine chaptalized in the early harvest. The early harvest wines were defined by the attributes fresh vegetable, sour taste, lightness (i.e., low saturation), and yellow component. The negative quadrant of the PCA contained all the late harvest wines, defined primarily by sweet taste and viscous mouthfeel and secondarily by chocolate/caramel, hot mouthfeel, alcoholic, and artificial fruit. In the early harvest wines, the sour taste was possibly elicited by the higher concentration of acids (6.04 g/L TA), and, equivalently, in the late harvest wines, the sweet taste may have resulted from higher levels of glucose and glycerol (Table 2). Alternatively, higher perceived sweetness in the late harvest wines may be a cognitive construct arising from the perception of comparatively lower TA levels. Overall, these results indicate that the harvest date defined the sensory profile of the wines and outweighed any sensory effect arising from extended maceration and/or the differential EtOH concentrations during winemaking. Similarly, a study in which Cabernet franc grapes were harvested at 35 and 49 days after veraison found that at 49 days wines had higher color, alcohol, and astringency, whereas at 35 days wines had higher vegetal character and acidity (Cadot et al. 2012). In Cabernet Sauvignon wines made from grapes with three sugar levels of 192, 217, and 236 g/L, the wines made from fruit at the highest maturity received lower ratings for acidity, vegetal notes, and astringency, and higher ratings for fruitiness and mouthfeel (Gil et al. 2012). These results add support to the findings of the present study and confirm the prevailing and positive effect of the later harvest date (24.9 Brix in the fruit on average) on the sensory profile of Merlot wines.
Mean separation of the aroma sensory attributes of 2011 Merlot wines assessed by a trained panel (n = 11). Evaluations were made using a 10-point line scale.
Mean separation of taste, mouthfeel, and color sensory attributes of 2011 Merlot wines assessed by a trained panel (n =11).
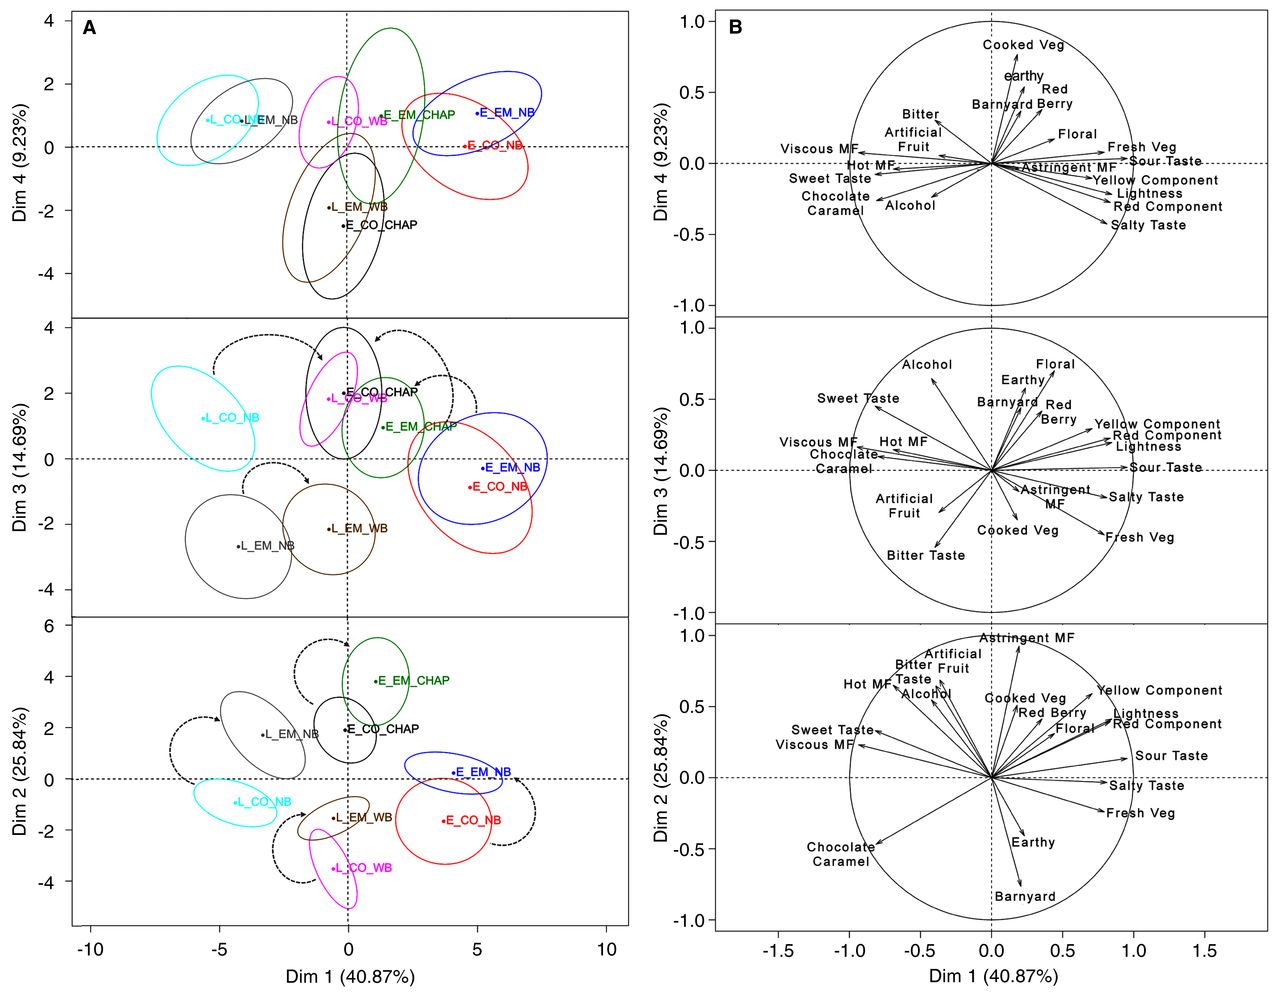
PCA of significant sensory parameters of 2011 Merlot wines produced from grapes harvested with two maturity levels and with two maceration treatments and two ethanol-adjustment procedures. (A) Confidence ellipses constructed based on the multivariate distribution of the Hotelling’s test for p < 0.05 indicating 95% confidence intervals; (B) sensory loadings. Individual wines are combination of treatments: control (CO), 10-day skin contact; extended maceration (EM), 30-day skin contact; E, early harvest; L, late harvest; NB, natural Brix; CHAP, chaptalized; WB, saignée followed by water-back.
The second principal component, which explained ~26% of the residual variance, segregated the wines as a function of both the maceration length and the EtOH adjustment treatments. Extended maceration shifted the sensory profile toward the positive quadrant of the second component of the PCA plot (Figure 2A, denoted with arrows). Thus, EM wines were defined primarily by astringency and the cooked vegetable character and secondarily by bitter taste, artificial fruit, red berry aroma, and yellow component. Although most of the attributes recorded in EM wines bear a negative connotation, comparatively higher astringency ratings are an expected outcome of extended maceration. For example, it has been reported that maceration for 30 days or more increased astringency ratings by 34% in Merlot (Casassa et al. 2013) and by 22% in Cabernet Sauvignon (Scudamore-Smith et al. 1990). Expectedly, enhanced tannin extraction during EM (Table 3) was thus linked with higher astringency ratings in the finished wines (Harbertson et al. 2009, Gil et al. 2012, Casassa et al. 2013). Regarding the EtOH adjustment treatments, saignée/water-back of the late harvest fruit to Brix levels comparable with those of the early harvest fruit decreased astringency, bitterness, and hot mouthfeel but increased earthy notes.
The third and fourth principal components explained ~15% and 9%, respectively, of the residual variance. An evident overlapping of the confidence ellipses of the different treatments was observed, indicating relatively low sensory significance. Nevertheless, analysis of the third component showed a specific effect of the EtOH adjustment treatment (Figure 2A, mid panel, denoted with arrows). For the early harvest wines, chaptalization of the early harvest fruit before fermentation shifted the sensory profile from one defined by astringency, cooked vegetable, and fresh vegetable toward alcoholic, floral, sweet taste, viscous mouthfeel, and chocolate/caramel aroma. No ellipses overlapping occurred, indicating that the nature of this shift was significant, which commends a positive sensory impact of chaptalization. Similarly, saignée/water-back of the late harvest fruit to Brix levels similar to those of early harvest fruit tended to accentuate the perception of vegetal and earthy notes while reducing that of astringency and bitterness.
Conclusions
This study examined the effect of selected winemaking conditions thought to impact anthocyanin and tannin extraction, applied to different grape maturities over two growing seasons. Extended maceration increased tannin extraction from seeds, enhanced large polymeric pigment formation, lowered anthocyanins, and decreased wine color saturation. This effect was independent of the maturity level and the EtOH concentration during maceration. Counter to expectations, EtOH concentrations up to 14.40% (v/v) applied to unripe fruit (~20.3 Brix) during maceration did not result in enhanced tannin extraction from seeds. Extrapolation of these results in Merlot to commercial practices such as delaying harvest to achieve seed browning (the so-called seed ripeness) allows us to speculate that the visual ripeness of the seeds may be a relatively lesser factor affecting tannin extraction during maceration. If limited tannin extraction from the seeds is desired, shorter maceration times (<10 days) will provide a comparable proportion of skin- and seed-derived tannins and an overall lower tannin extraction.
The later harvest date showed a prevailing and positive effect on the sensory profile of the wines over winemaking factors such as the maceration length and the EtOH concentration. Wines from the late harvest fruit had a more viscous mouthfeel, sweet taste, and fruit-derived aromas than wines from the early harvest fruit, which were dominated by fresh vegetal character, acidity, and lower color saturation. Extended maceration shifted the sensory profile toward higher astringency, lighter and yellower color components, and cooked vegetal aromas. Based on these results, extended maceration seems to have an overall negative impact on the sensory profile of the wines. Thus, if the stylistic or production goal is to merely enhance tannin extraction, practices such as saignée can be used to manipulate the solid-to-juice ratio, additionally relieving the logistics of tank turnover in the winery.
Chaptalization of the early harvest fruit to Brix levels of commercial relevance before fermentation shifted the sensory profile from cooked and fresh vegetable toward sweet taste, alcoholic, floral, and chocolate/caramel aromas, astringency, and viscous mouthfeel. This finding validates the practice of chaptalization and highlights the fact that, although the effect of the EtOH concentration on the wine phenolic composition seems to be of minor importance, it does have a significant positive impact on the sensory profile of the final wines.
Acknowledgments
Acknowledgments: The authors thank the Wine Advisory Committee, the Washington Wine Commission, and the WSU Agricultural Research Center. LFC is grateful to the Fulbright Commission and the Walter Clore Scholarship for financial support. Ste. Michelle Wine Estates is acknowledged for generous donation of both fruit and labor for this project. Eileen Harbertson is thanked for editing the initial draft of the manuscript.
Footnotes
-
Supplemental data is freely available with the online version of this article.
-
Publication costs of this article defrayed in part by page fees.
- Received May 2013.
- Revision received July 2013.
- Accepted July 2013.
- Published online December 1969
- ©2013 by the American Society for Enology and Viticulture
Literature Cited
Vol 64 Issue 4


Jump to section
Related Articles
Cited By...
More from this TOC section
Similar Articles
