


Abstract
The headspace gas detection tube (HS-GDT) method to measure molecular and free sulfur dioxide (SO2) in wine is a simple and inexpensive procedure using commercial industrial safety colorimetric tubes. A syringe is used to sample a wine and to create a closed headspace, which is expelled through the GDT after equilibrium is obtained. The vapor-phase concentration of SO2 (PSO2) is determined from the manufacturer’s printed markings and then related to the molecular SO2 concentration in the wine based on Henry’s law coefficients or, more accurately, on calibration curves. Typical wine ethanol concentrations had a significant effect on the pKa of SO2, as previously reported, but no effect on Henry’s law coefficients. Calibration curves in model wine and aqueous buffer yielded indistinguishable results when appropriate pKa values were used. Best results for calibration curves were achieved with 200 mL headspace of model wines (5 to 40 mg/L free SO2, equivalent to 0.14 to 1.12 mg/L molecular SO2), which yielded satisfactory linearity (r2 = .99), reproducibility (mean CV = 8% for molecular SO2 >0.4 mg/L), and detection limits (0.21 mg/L molecular SO2). Molecular SO2 measured by HS-GDT and by aeration-oxidation (A-O) showed a strong correlation between methods for white and blush wines (r2 = 0.97) and a poor correlation for red wines (r2 = 0.72). A-O values averaged double the HS-GDT values in red wines. The difference in molecular SO2 values by A-O and HS-GDT correlated well with the estimated molecular SO2 decrease due to formation of anthocyanin-bisulfite adduct (r2 = 0.936), supporting the hypothesis that dissociation of anthocyanin-bisulfite adducts occurs during A-O analysis. By not perturbing this equilibrium, HS-GDT accurately reports free and molecular SO2 values.
Sulfur dioxide (SO2) is widely used as a preservative in winemaking due to its antimicrobial and antioxidant properties (Boulton et al. 1996, Ribéreau-Gayon et al. 2007). At wine pH (3 to 4), the majority of SO2 (>95%) exists in the form of bisulfite (HSO3−), with the remainder existing as neutral “molecular” SO2 and a negligible portion existing as sulfite (SO32−) (Zoecklein et al. 1995, Boulton et al. 1996). The sum of these forms (molecular SO2, HSO3−, and SO32−) is referred to as “free SO2”. Additionally, HSO3− may form covalent adducts with electrophilic compounds in wine, including ketonic acids, sugars, quinones, and anthocyanins (Burroughs and Sparks 1973, Beech et al. 1979). This covalently bound HSO3− is referred to as “bound SO2” and has lower antimicrobial and antioxidant activity than free SO2 forms (Boulton et al. 1996). “Total SO2” is the sum of the free and bound SO2 and is the form subject to regulatory limitations in most wine-producing countries (Zoecklein et al. 1995).
Of the forms described, the molecular SO2 and HSO3− species are reportedly the most important for the germicidal and antioxidant properties of SO2, respectively (Danilewicz 2011, Divol et al. 2012). For dry table wines, winemakers will typically aim to maintain free SO2 (predominantly HSO3− for reasons described earlier) at above 10 mg/L (Godden et al. 2001) or at a target of 30 mg/L (Waterhouse and Elias 2010) to mitigate or slow the appearance of oxidative effects such as aldehyde formation and browning. Recommended molecular SO2 concentrations in wine production depend on the target microorganism, but the most commonly cited values range from 0.5 to 0.8 mg/L molecular SO2 (Beech et al. 1979, Boulton et al. 1996). Free SO2 concentrations can decrease during wine production and storage through binding, volatilization, or, more often, oxidation reactions. Thus, winemakers must routinely assess wines for free SO2 to ensure stability (Zoecklein et al. 1995).
In most production wineries and research laboratories, free SO2 rather than molecular SO2 is measured, and the molecular SO2 is calculated via a modified Henderson-Hasselbalch equation following measurement of pH. Common approaches for measuring free SO2 fall into two categories: titrimetric and colorimetric methods that rely on direct addition of an oxidizing reagent to the wine, e.g., by iodometry (Ripper method) or addition of p-rosaniline (Joslyn 1955, Zoecklein et al. 1995) or alternatively, methods that separate free SO2 from the wine, followed by quantification by titrimetry, colorimetry, or other means (Zoecklein et al. 1995, Pundir and Rawal 2013). In modestly equipped wineries, the most common variant of this “separation-first” approach is the aeration-oxidation (A–O) method, in which an acidified wine sample is stripped by a stream of air, from which SO2 is captured by a hydrogen peroxide solution to generate H2SO4, which can be quantified by titration (Rankine and Pocock 1970). Automated variants of both direct and separation-first methods also exist (Ruiz-Capillas and Jiménez-Colmenero 2009, Pundir and Rawal 2013).
Beyond these methods, the Association of Analytical Communities (AOAC) lists several methods to determine total sulfites in wine (Monier-Williams, flow injection/chromatography-spectrophotometry, and ion exclusion chromatography) and a method for free sulfites for white wines only (flow injection/chromatography-spectrophotometry) (AOAC 2015). These methods give comparable values to A-O, and the A-O method is the one used by agencies such as the United States Alcohol and Tobacco Tax and Trade Bureau due to its relative simplicity (http://www.ttb.gov/ssd/pdf/tm500.pdf).
A well-known shortcoming of the direct titrimetric or colorimetric approaches is that other reducing compounds than free SO2 are also measured, resulting in overestimates of the true value (Buechsenstein and Ough 1978). However, a less-appreciated shortcoming of all standard methods for SO2 measurement is the dissociation of weak SO2 adducts following changes to wine equilibrium during the measurement. These perturbations to equilibrium may result from acidification, temperature change, dilution, and/or consumption of free SO2 by reagents over the measured timecourse, which will overestimate free and molecular SO2 (Rankine and Pocock 1970, Burroughs 1975, Boulton et al. 1996). This overestimation is more pronounced in red wines, likely due to dissociation of anthocyanin-bisulfite adducts; more modest discrepancies are observed for white wines (Burroughs 1975, Bogren 1996).
This overestimation of free and molecular SO2 in wine by standard techniques is of potential concern to researchers or winemakers interested in a mechanistic understanding of oxidation or microbial growth in wine (Boulton et al. 1996). However, few papers report using techniques that avoid pH shifts, sample dilution, and/or temperature changes, and thus avoid disturbance of SO2 equilibria in wine. One such approach is capillary electrophoresis (CE), which can quantify bisulfite with minimal contributions from artifactual dissociation of bound SO2 forms (Boulton et al. 1996, Collins and Boulton 1996). Results from CE indicate that free SO2 may be overestimated by up to an order of magnitude in red wines. Similar observations were reported using a colorimetric method that compared absorbance at 520 nm for acetaldehyde- and SO2-treated wines to an original wine sample, although this method relied on several assumptions regarding anthocyanin spectral behavior, was developed before an appreciation of copigmentation effects had been described, and would only be appropriate for detecting overestimation due to anthocyanins and not to other weak binders (Burroughs 1975).
Alternatively, the headspace SO2 concentration of an equilibrated sample can be measured and the partial pressure related to the molecular SO2 concentration in wine via Henry’s Law. Using headspace gas chromatography (HS-GC) coupled to an electrolytic conductivity detector (Davis et al. 1983), good agreement was observed between A-O and HS-GC approaches for a white wine and juice, but A-O yielded 45% higher values for the red wine. Headspace infrared (HS-IR) spectroscopy can also reportedly be used to quantify SO2 in unadjusted wine samples (Henningsen and Hald 2003). Inductively-coupled plasma optical-emission spectrometry (ICP-OES; Čmelík et al. 2005) and flame molecular absorption spectrometry (Huang et al. 2008) have also been used to measure vapor-phase SO2 in wine, but wine samples were acidified and gas-purged during analysis, which was expected to yield results comparable to classic methods. None of these approaches to measuring vapor-phase SO2 have been widely adopted in either wineries or research labs, possibly due to the cost and complexity of the techniques.
An unexplored approach to measuring wine headspace SO2 concentrations is colorimetric gas detection tubes (GDTs). GDTs were originally developed for industrial safety in the early 1900’s (Haag 2001) and consist of a glass tube packed with a color-sensitive reagent, such that the length of tube undergoing color change is proportional to the analyte concentration. Commercial SO2 gas detection tubes have been used to measure free SO2 in wines using a modified A-O protocol (Pegram et al. 2013) adapted from a related method for quantifying H2S in wines (Park 2008, Ugliano and Henschke 2010). Similar to A-O, this earlier use of GDT to quantify free SO2 relied on acidification of the sample and sparging prior to SO2 measurement, and thus likely also experienced dissociation of weak adducts and overestimated free SO2.
In this paper, we report on the development of a headspace gas detection tube (HS-GDT) method to determine molecular and free SO2, both calculated from the measurement of the headspace gas concentration. This method does not require sample preparation and thus avoids disturbing SO2 equilibria, and in combination with its low cost and simplicity, should facilitate investigations into the antimicrobial and antioxidant properties of SO2.
Materials and Methods
Chemicals
Potassium metabisulfite (97% w/w) and ethanol (95% v/v) were obtained from Acros Organics (Geel, Germany). Lactic acid (85% w/w), potassium bitartrate (99% w/v), hydrogen peroxide (30% w/v), sodium hydroxide (0.01 N), and o-phosphoric acid (85% w/w) were obtained from Fisher Scientific (Waltham, MA). A nominally 25% phosphoric acid solution was prepared as a 2.38:1 dilution of 294 mL phosphoric acid (85%) with 700 mL deionized water. Potassium acetate (99% w/w) and potassium sorbate (98% w/w) were obtained from J.T. Baker (Phillipsburg, NJ). Hydrochloric acid (36.5% w/w) was obtained from BDH Merck (Poole Dorset, UK).
SO2 working standards
SO2 stock solutions at nominal concentrations of 1000 mg/L as SO2 were prepared weekly by dissolving potassium metabisulfite in a 10% (v/v) solution of methanol in water to avoid SO2 autooxidation. Working standards were then prepared as needed by adding an appropriate volume of a stock SO2 solution to saturated potassium bitartrate buffer (pH 3.58). Iodometric titrations were used to determine the actual concentrations of the stock and working solutions.
SO2 gas detection tubes
Three commercial SO2 detection tubes were evaluated initially: i) Gastec 5Lb tubes (Gastec Corporation, Fukayanaka, Japan), ii) Sensidyne/Kitigawa 103SE SO2 tubes (Sensidyne LP, St. Petersburg, FL), and iii) Draeger 0.1/a SO2 tubes (Drägerwerk AG & Co. KGaA, Lübeck, Germany).
SO2 measurements by A-O
A-O was performed according to a protocol described elsewhere (Iland et al. 2004).
Protocol for SO2 measurement by HS-GDT
The HS-GDT apparatus was assembled as depicted (Figure 1). It consists of a 60 mL Becton Dickinson syringe (polypropylene barrel, polypropylene plunger, latex-free polyisoprene rubber tip treated with Dow 360 medical-grade silicone) with a Luer-lock tip, fitted to a two-way polycarbonate male Luer stopcock. A short piece of silicone tubing connects a GDT to the top of the stopcock. The syringe is fitted with a 3 cm plastic dispensing stop, used to prevent accidental expulsion of liquid during syringe depression, made by cutting a second 60 mL Becton Dickinson syringe barrel to the correct height. If the GDT had been previously used and the “end” marking from previous runs was unclear or had shifted, the “start” point of color transition was marked on the tube with a fine-point permanent marker.

The headspace gas detection tube apparatus prior to (left) and after (right) headspace expulsion through the gas detection tube.
For each analysis, the syringe was used to aspirate 10 mL wine or working standard. The syringe was inverted and then withdrawn further to create 50 mL headspace. The stopcock was closed, the syringe was placed nose-up, the syringe stop was put in place, and the sample was allowed to equilibrate for five min. The stopcock was then connected to a GDT via the short piece of silicone tubing, the stopcock was opened, and the syringe was depressed at a constant rate to the stop, such that 50 mL of headspace was expelled through the GDT over 10 sec. Following gas expulsion, the colorimetric reaction was allowed to stabilize for one min. For some calibration curve experiments and for analyses of wines, this process was repeated up to four times for one sample, resulting in up to 200 mL headspace through the GDT. For the wine analyses, the limit for the number of repetitions was determined by the number that could be quantified on one tube. The final color transition point was marked with a fine-tip marker and the locations of the stain startpoint and endpoint were measured in millimeters with a ruler.
Determination of PSO2, molecular SO2, and free SO2 from raw GDT measurements
Gas detection tubes have printed scales showing the vapor-phase concentration of SO2 (PSO2) in ppm (μL/L) as a non-linear function of stain distance, based on a brand-dependent standard volume (200 mL for the Gastec and Sensidyne/Kitigawa tubes, 100 mL for the Draeger) of headspace sampled. The scale resolution was insufficient for repeated high-precision measurements. To facilitate interpolation, a cubic function, f(x), was determined to relate SO2 vapor pressure (PSO2) based on the manufacturer’s markings as a function of distance along the GDT in mm. The best-fit equations were calculated using Microsoft Excel (Microsoft, Redmond, WA). Because the spacing of markings varied among GDT lots, cubic interpolation functions were determined for each lot of tubes. For each sample, PSO2 was calculated from the location of the startpoint (xstart) and the endpoint (xend) measurements in mm and adjusted based on the actual volume of headspace gas sampled, shown here for the Gastec or Sensidyne tubes (Equation 1).
 Eq. 1
Eq. 1
Molecular SO2 (mg/L) was calculated from PSO2 using Henry’s Law and the molecular mass of SO2 (Equation 2). A Henry’s Law coefficient (KH) of 0.38 Atm/M at 294 K was determined as part of this work.
 Eq. 2
Eq. 2
A literature value of 3100 K was used as the temperature dependence constant (Sander 2015) from which to calculate the temperature-corrected Henry’s Law coefficient, KH(T), used in this work, where T is the temperature during the analysis (Equation 3).
 Eq. 3
Eq. 3
Free SO2 was calculated from molecular SO2, the sample pH, and the pKa of SO2 (Equation 4). Literature values for pKa as a function of ethanol were used in this calculation (Usseglio-Tomasset and Bosia 1984) and were corroborated as part of this work.
 Eq. 4
Eq. 4
Evaluation of interferences
The potential of ethanol, lactic acid, sorbic acid, and acetic acid to act as interferences were evaluated by preparing solutions containing either 14% ethanol, 5 g/L lactic acid, 300 mg/L sorbic acid, or 1.4 g/L acetic acid in a potassium bitartrate buffer. The HS-GDT responses for these solutions were compared against a blank potassium bitartrate buffer. Analyses were done in triplicate using 50 mL headspace samples. For these evaluations, a measurable discoloration of the GDT was taken as evidence of interference.
Determining optimal equilibration time
To determine the minimum time required to establish vapor-liquid equilibrium of SO2, a 50 mg/L SO2 solution in pH 3.56 bitartrate buffer was sampled into the syringe and maintained at the room temperature for 1, 5, or 10 min. Replicate samples (n = 5) were run for each equilibration time using 50 mL headspace samples.
Determination of Henry’s coefficient of SO2 as a function of ethanol concentration
SO2 solutions (1 mg/L) were prepared with varying ethanol concentrations (0, 8, 11, 14, or 17% v/v) at pH 0 by adding SO2 stock directly into a syringe containing 10 mL of appropriate ethanol/HCl solutions. At this pH, SO2 was predominantly in the molecular SO2 form and care was taken to keep the syringe closed except during sampling. Replicate samples (n = 8) were analyzed by the HS-GDT method for each ethanol concentration. The Henry’s coefficient (KH) of SO2 was then calculated in units of Atm L/mol for each ethanol concentration as KH = PSO2 / [SO2].
Determination of pKa of SO2 as a function of ethanol
SO2 solutions (50 mg/L) were prepared in a potassium bitartrate buffer with one of four ethanol concentrations (0, 7, 14, or 20% v/v) at one of four pH values (3.1, 3.3, 3.5, or 3.7), for a total of 16 solutions. pH was adjusted by dropwise addition of either 25% phosphoric acid or 1 N sodium hydroxide. The HS-GDT protocol was then used to determine PSO2, which was then converted to molecular SO2. The apparent pKa for each solution was calculated from the measured molecular SO2 and known free SO2 concentration using the Henderson-Hasselbalch equation. The room temperature at the time of the experiment was 21.9°C.
Figures of merit for the HS-GDT method: linearity, % CV, and detection limit
Standard solutions at nominal concentrations of 5, 10, 15, 20, 30, and 40 mg/L SO2 were made in potassium bitartrate buffer (pH 3.56) with 12% (v/v) ethanol and at nominal concentrations of 5, 10, 25, 50, and 75 mg/L SO2 in aqueous potassium bitartrate buffer (pH 3.56). Actual free SO2 concentrations were determined by the Ripper method (Iland et al. 2004). Each sample was analyzed by the HS-GDT method in replicate (n = 12; 72 analyses total). The coefficient of variation for each standard concentration was calculated as the standard deviation divided by the mean and expressed as a percentage. Linearity was evaluated by linear regression of measured PSO2 versus expected PSO2. The detection limit (LOD) was calculated as 3 × s, where s is the signal-independent noise calculated by Pallesen’s method (Berthouex and Brown 2002).
Comparison of A-O and HS-GDT for measuring SO2 in commercial wines
Twenty-seven commercial wines (9 red, 14 white, and 4 blush) were evaluated by both the A-O and HS-GDT methods on site. The red wines were from the 2009 to 2012 vintages and the white wines were from the 2011 to 2013 vintages. The wines were from Australia, Argentina, and the United States (California, New York, Oregon, and Washington). Composition of the commercial wines was determined by ETS Laboratories (St. Helena, CA) using accredited methods for pH (by meter), alcohol (FTIR), and glucose plus fructose (enzymatic); additionally tannins, polymeric, and total anthocyanins were measured by HPLC (Waterhouse et al. 1999). Similar to standard curves, the LOD for molecular SO2 was calculated as 3 × s, where s is the signal-independent noise calculated by Pallesen’s method (Berthouex and Brown 2002).
To evaluate whether discrepancies between A-O and HS-GDT measurements could be explained by the presence of labile anthocyanin-bisulfite adducts, the concentration of anthocyanin-bisulfite adducts, [Flav-Bisulfite], was estimated by solving a series of equilibrium equations (Equations 5 to 8):
 Eq. 5
Eq. 5
 Eq. 6
Eq. 6
 Eq. 7
Eq. 7
 Eq. 8
Eq. 8
[Flav] and [Quin] are the concentrations of flavylium and quinoid forms of anthocyanins. [Flav-Bisulfite] is the concentration of anthocyanin bisulfite adducts, and the free SO2 concentration measured by A-O, [BisulfiteAO], was assumed to equal the sum of [Flav-Bisulfite] and [BisulfiteHS], i.e., all of the difference between A-O and HS-GST could be explained by binding to flavylium ions. Acid dissociation constants (pKa) for anthocyanins were based on literature values and assumed to be 2.94 for Vitis vinifera wines and 2.6 for diglucoside-containing hybrid-based wines (Brouillard and El Hage Chahine 1980, Francis and Markakis 1989, Ribéreau-Gayon et al. 2007). The dissociation constant (Kd) for Flav-Bisulfite adducts was assumed to be 1 × 10⁻⁵ (Burroughs 1975, Timberlake and Bridle 1976). [Total Anth] was the total anthocyanin concentration, and [H+] for each wine was derived from the measured pH. For each wine, KD, KA, [Total Anth], [H+], and [BisulfiteAO] were independent variables and the equations were solved for [Flav], [Quin], [Flav-Bisulfite], and [BisulfiteHS] using R v.3.1.2 (The R Foundation for Statistical Computing, Vienna, Austria) and the “nleqslv” v.2.5 add-in package.
Statistical Analyses
JMP Pro 11.0.0 (SAS Institute, Inc., Cary, NC) was used for statistical analyses. Comparison of means tests for the effects of ethanol on pKa and KH were performed by one-way ANOVA followed by a Tukey test if the effect was significant. Linear regression analyses for calibration curve comparison of A-O versus HS-GDT data were performed with 1/x weighting factors. Linear regressions of wine composition parameters and the difference between A-O and HS-GDT SO2 values were performed without weighting.
Results and Discussion
Apparatus and materials for SO2 measurements by HS-GDT
The apparatus was constructed and used in the protocol as described (Figure 1). An example of a partially discolored Gastec 5Lb tube is also shown (Supplemental Figure 1). Three different gas detector tubes were initially investigated: i) Gastec 5Lb, which rely on the reaction of SO2 with BaCl2 to generate HCl, resulting in color change of a pH-sensitive dye; ii) Sensidyne/Kitigawa 103SE SO2 tubes, which rely on the colorimetric reaction of SO2 with NaOH to generate Na2SO3; and iii) Draeger 0.1/a tubes, which rely on reaction of SO2 with NaHgCl4 to generate HCl, whose evolution is detected by a pH-sensitive indicator. Initial trials with alcoholic buffer solutions containing SO2 resulted in no detectable signal for the Draeger 0.1/a tubes, and thus these were not further considered. We observed inconsistent results with Sensidyne tubes, with coefficients of variance (CV) >20% in the length of tube darkened, while Gastec 5Lb tubes yielded reproducible results (CV <10%). The reason for the poor performance of some of the tubes is unclear. However, commercial tubes require that gas sampling occur at precise, non-linear, and proprietary rates that are unique to each manufacturer (Haag 2001) and the poor performance may reflect incompatibility of some brands of tubes with this method’s syringe-depression sampling rate. The Gastec 5Lb tubes were selected for further study, as they performed best with the current syringe apparatus sampling protocol.
Evaluation of interferences
Gastec GDT exhibited uniform discoloration from green to light blue even when exposed to “blank” 14% ethanol buffer solutions (data not shown). However, because this color change was distinct from the color change associated with SO2 (green to yellow), it did not interfere with measurements. Because the reaction chemistry of the GDT employed will respond to all volatile acids, we investigated the susceptibility of the HS-GDT method to interference from acetic (1.4 g/L), lactic (5 g/L), and sorbic (300 mg/L) acids. A small signal, equivalent to <0.1 mg/L molecular SO2, was observed at these concentrations (data not shown). Since these concentrations represent the upper end of concentrations expected to be found in wines (Zoecklein et al. 1995), the susceptibility of the method to these volatile acid interferences is low.
Interpolation of manufacturer markings on GDT
The manufacturer-provided markings on the GDT were used to quantify the SO2 vapor pressure, PSO2. To facilitate interpolation of markings, best-fit cubic functions relating PSO2 to distance along the tube were generated for each lot of Gastec GDT (Supplemental Figure 2, Supplemental Table 1). PSO2 for each sample could then be calculated using Equation 1, which in turn could be used to calculate molecular SO2 and free SO2. Tube-to-tube variation in marker spacing within the same lot number was imperceptible and not a source of error.
Effect of equilibrium time on HS-GDT measurements
Fifty mg/L SO2 solutions in pH 3.56 buffer were analyzed by the HS-GDT apparatus using varying static equilibration times (1, 5, or 10 min) at room temperature. No significant differences were observed, indicating that headspace and liquid-phase SO2 equilibrate quickly. Five minutes was selected as the optimal equilibrium time for the HS-GDT method because it yielded the best precision (Table 1).
Effect of equilibrium time on SO2 vapor pressure measured by headspace gas detection tube.
Effects of ethanol on Henry’s coefficient of SO2
Using the HS-GDT assay, Henry’s coefficient (KH) was determined for 1 mg/L SO2 solutions at 21°C over varying ethanol concentrations. Samples were acidified with HCl to ~pH 0 to favor the molecular SO2 form and eliminate any confounding ethanol-induced effects on the pKa of SO2. KH was independent of ethanol concentration over the range of 0 to 17% v/v ethanol (Figure 2) and was calculated to be 0.38 Atm/M at 21°C, comparable to a recent previous report of 0.28 Atm/M for SO2 in water at 25°C (Zhang et al. 2013). The lack of dependence of SO2 volatility on ethanol concentration is in contrast to other wine volatiles. For example, the volatility of many wine esters is about two-fold lower in model wine than in a model juice solution (Mouret et al. 2012). The minimal effect of ethanol on SO2 volatility may result from its greater polarity than many other wine volatiles. Regardless of the explanation, these results indicate that it is not necessary to control for ethanol concentration prior to HS-GDT analyses of wine.

SO2 vapor pressure as a function of ethanol concentration. Samples were prepared at ~pH 0. Error bars represent standard errors (n = 8).
Effect of ethanol concentration on the pKa of SO2
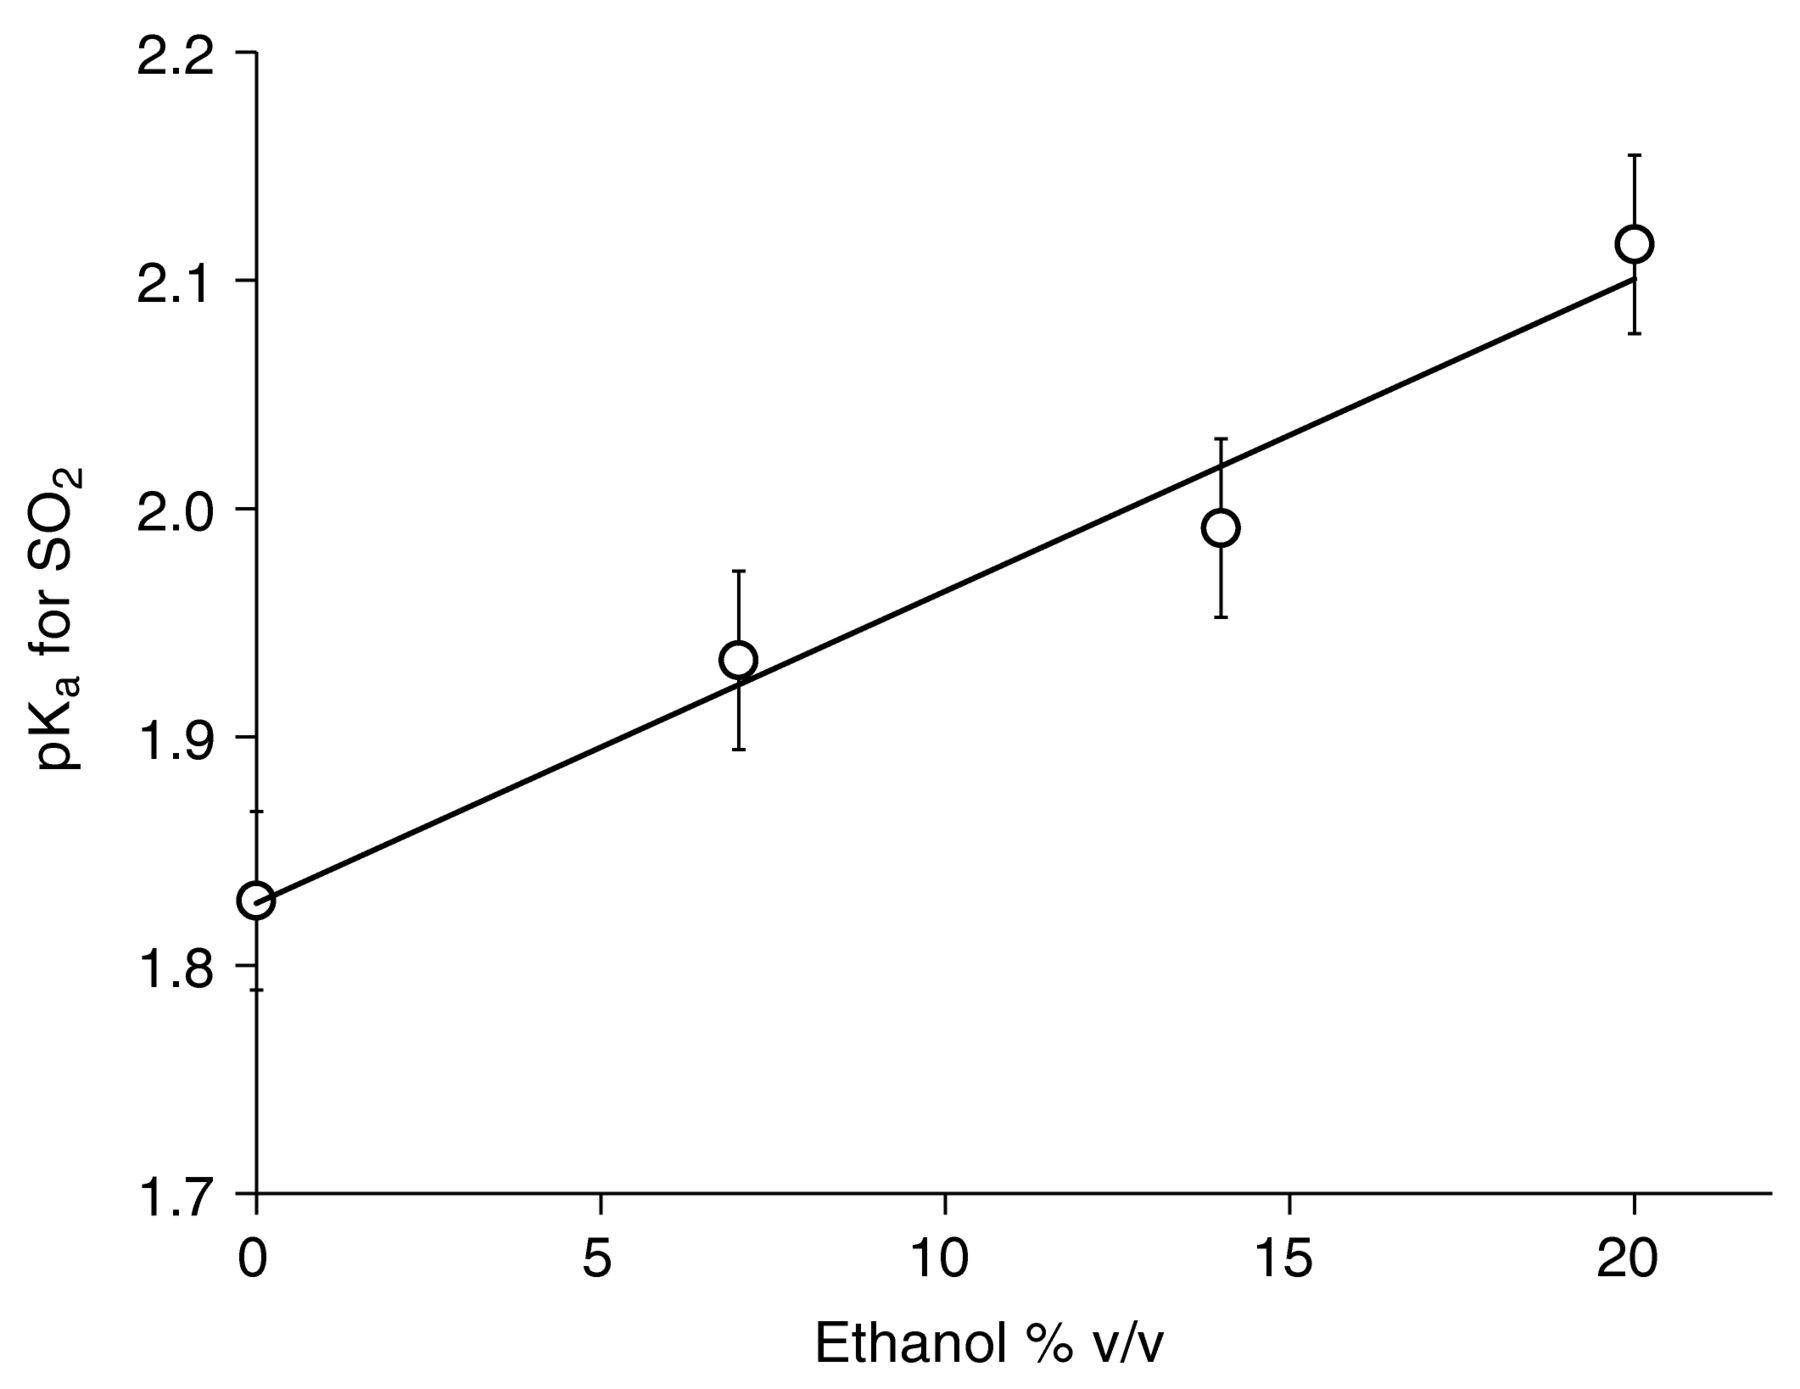
PSO2 was determined by HS-GDT for model wine solutions with different ethanol concentrations and pH values and the PSO2 and pH values were subsequently used to calculate pKa as a function of ethanol concentration (Figure 3). Because KH is independent of ethanol concentration, changes in PSO2 could be assigned solely to effects on pKa. The best fit line (y = 0.0137x + 1.83, r2 = 0.97) yielded predicted acid-dissociation constants of pKa = 1.83 at 0% ethanol and pKa = 1.96 at 10% alcohol. These values are comparable to pKa values determined by titrimetry in model solutions for 0 and 10% ethanol solutions (1.81 and 2.00, respectively; Table 2; Usseglio-Tomasset and Bosia 1984). Interestingly, the pKa of SO2 in water (1.81) is widely recommended in calculations of molecular SO2 from free SO2 in wine regardless of the ethanol concentration, which is expected to lead to 25 to 50% underestimates of the actual molecular SO2 concentration in wines, depending on the pH. Temperature and ionic strength can also impact pKa to a lesser degree, and should be taken into consideration (Usseglio-Tomasset and Bosia 1984). In this paper, all conversions between free and molecular SO2 are based on ethanol-corrected pKa values at specific room temperatures and 50 mM ionic strength unless otherwise specified.

Experimentally determined pK1 values for SO2 in a buffered standard solution as a function of alcohol concentration. Error bars represent standard deviations (n = 4).
Comparison of experimentally determined pK1 values to literature pK1 values for SO2.
Figures of merit for the HS-GDT method
Calibration curves were analyzed by the HS-GDT method using SO2 standards prepared at pH 3.56 in either aqueous buffer (0.09 to 1.28 mg/L molecular SO2) or model wine (0.14 to 1.12 mg/L molecular SO2) using either a 50 mL or 200 mL (4 × 50 mL) headspace sample. Limits of detection and %CV for commercial wines were also calculated (Table 3). The slopes and intercepts for all methods were nearly identical (<5% difference for each parameter across the four curves), indicating that the method was scalable with headspace volume size and that using Equation 1 was valid. As expected from our observations that wine-like concentrations of ethanol do not affect Henry’s coefficient, the best fit lines for the aqueous and model wine calibrations were nearly identical (y = 5.92x – 0.48 versus y = 5.99x – 0.55 for 200 mL sample sizes).
Figures of merit for the headspace gas detection tube (HS-GDT) method. Aqueous and 10% ethanol model wines both at pH 3.56; commercial wines are described in the text.
Although reasonable detection limits (0.21 mg/L molecular SO2) could be achieved for 50 mL sample sizes in the aqueous standards, detection limits were considerably higher for model wine (0.59 mg/L molecular SO2). Additionally, linearity was unacceptable for the 50 mL samples from model wine (r2 = .75), and precision over the range of molecular SO2 typically targeted in wine (>0.4 mg/L) was also mediocre (mean CV = 18%). In the model wine system, using repeat sampling improved limits of detection from 0.59 mg/L for a 50 mL headspace sample to 0.21 mg/L for a 200 mL sample. Repeat sampling also improved the precision (mean CV = 8% for standards with >0.4 mg/L molecular SO2). Based on these results, 200 mL headspace sample sizes (i.e., repeated sampling) were used for later analyses on commercial wines.
Unexpectedly, the y-intercept was negative for all calibration curves, indicating that a minimal amount of SO2 (~0.07 mg/L molecular SO2) was necessary to effect a color change. An explanation for this phenomenon is not clear, but may be an effect of the differences between the manufacturer’s optimized flow rate through the GDT and the flow rate used in our experiments (Haag 2001). Regardless, the offset is well below typical recommendations for molecular SO2 necessary to prevent spoilage, and thus the method should still be useful for most wines.
Comparison of HS-GDT and A-O methods
Twenty-seven commercial wines (9 red, 14 white, and 4 blush) were evaluated by both HS-GDT and A-O methods. HS-GDT measurements in PSO2 were converted to free SO2 values. The wines had a wide range of free SO2 concentrations (4 to 51 mg/L by A-O). The average precision for HS-GDT measurements of wines with >0.4 mg/L molecular SO2 (mean CV = 17%) was different than values achieved with calibration standards, and the limit of detection (0.06 mg/L) was threefold lower than the values achieved for calibration standards (Table 3). The reason for the reduced precision in real wines may be due to limiting the number of repetitions to those that would fit on one tube, thus increasing the variability on the wines with higher concentrations of SO2. The lower limit of detection for HS-GDT in real wines as opposed to calibration standards is also unclear. Potentially, the imprecision observed in model wine for low concentration standards (<0.2 mg/L) arises in part from variable degrees of oxidation. In real wines, these losses may be buffered by dissociation of the bound SO2 pool or minimized by the presence of the other antioxidant wine components.
A very good correlation was observed between the HS-GDT and A-O methods in white and blush wines (r2 = 0.97), but much weaker correlation was observed for red wines (r2 = 0.72, Figure 4). HS-GDT values for red wines were on average only 49% (range = 24 to 76%) of the A-O value recorded for the same wine, with absolute differences approaching 25 mg/L for some wines. This large discrepancy between the two methods for red wines is likely an artifact of A-O sample preparation steps (acidification, dilution) and long sampling time (10 to 15 min) that allow dissociation of weakly-bound anthocyanin-bisulfite adducts (Burroughs 1975) and erroneously high measurements of free SO2. Although equilibrating the 10 mL sample by contact with 50 mL headspace in the HS-GDT method will slightly decrease wine SO2 concentrations due to volatilization, the effect will be minimal (<1% change in bisulfite or molecular SO2 at equilibrium) because the pH does not change. Similar results have been observed in the limited number of other studies that have used non-perturbing methods to quantify free SO2 in red wines. For example, free SO2 values were up to an order of magnitude higher by Ripper and A-O than when measured by CE, where equilibria were not perturbed (Bogren 1996). A group using a non-perturbing headspace GC method reported a 45% higher free SO2 value in a red wine than with A-O, although this report used only a single wine adjusted to different pH values rather than multiple wines (Davis et al. 1983). The HS-GDT and A-O methods were in better agreement for white and blush wines. Based on the slope of the regression analysis (Figure 4), free SO2 values by HS-GDT were 87% that of the A-O method. This slight discrepancy (13% lower by HS-GDT) is comparable to that observed in a previous report comparing CE and A-O (Bogren 1996). This previous work suggested that any discrepancy could be explained by dissociation of weakly bound adducts of bisulfite, diacetyl, pyruvate, and other carbonyl species during A-O analyses. A separate report comparing HS-GC and A-O methods for a single white wine reported differences of <5% (Davis et al. 1983), but this work used a pKa value for SO2 (1.81) that was uncorrected for the effects of ethanol, which would have resulted in a higher free SO2 value based on measured headspace SO2. In contrast, a good correlation was observed between A-O and a modified A-O approach using GDT for both red and white wines (Pegram et al. 2013); in that approach, the wine pH was decreased to <2 to favor SO2 volatilization, resulting in perturbation of equilibrium conditions and measurement of weak bisulfite adducts.

Plot of molecular SO2 measured by the headspace gas detection tube (HS-GDT) method versus an aeration-oxidation (A-O) reference method for 9 red, 14 white, and 4 blush wines. Each data point represents the SO2 concentration of an individual wine (mean of n = 3). Best-fit line equations determined with 1/x weighting were: y = 0.82x + 0.05, r2 = 0.97 (white and blush wines, open circles) and y = 0.32x + 0.05, r2 = 0.72 (red wines, solid circles).
Predicted versus actual discrepancies in molecular SO2 in red wine: the role of anthocyanin bisulfite adducts
To evaluate the hypothesis that the large differences between A-O and HS-GDT methods for red wines could be explained by dissociation of anthocyanin-bisulfite adducts, the concentration of anthocyanin-bisulfite adducts was estimated by solving a system of nonlinear equations involving the equilibria of true free HSO3− and flavylium, quinoid, and bisulfite adduct forms of anthocyanins. Measured values of total anthocyanins, pH, and free SO2 by A-O (assumed to be true free SO2 + anthocyanin-bound adducts) were used in these calculations; a reported literature value of 2.94 for the anthocyanin hydration constant (pKh) was used for anthocyanins from V. vinifera wines (Brouillard and El Hage Chahine 1980) and a value of pKh = 2.6 was used for the diglucoside-containing, hybrid-based wines (Francis and Markakis 1989). Only adducts of flavylium ion forms and bisulfite were considered in the model, as the other anthocyanin forms do not bind bisulfite (Timberlake and Bridle 1967). The effects of self-aggregation on flavylium cations were ignored in the model. The apparent equilibrium constant for dimerization, Kd, was calculated to be no greater than 6000 for all red wine samples (estimated from Eq A11 in Houbiers et al. 1998), which would have resulted in only a small overestimation (less than 10%) of the flavylium ion concentrations used in our model. The observed discrepancy in molecular SO2 between the A-O and HS-GDT methods was plotted against the estimated concentration of anthocyanin-bisulfite adducts, expressed as SO2 equivalents (Figure 5A); it exhibits a strong positive correlation (r2 = 0.936) and has a slope near unity (0.94), supporting our hypothesis. Similarly, molecular SO2 by HS-GDT plotted against A-O values that were corrected for the calculated dissociation (Figure 5B) yielded a modest r2 of 0.755 and a slope of 0.765, very similar to the curve for the white and blush wines in Figure 4. Based on linear regression analyses, other measured wine components (tannins, glucose + fructose, ethanol) did not correlate with the percentage difference between A-O and HS-GDT methods in either red or white wines (data not shown). The lack of correlation of method difference with glucose concentration is not surprising. Dissociation of glucose-bisulfite complexes has been suggested as a potential problem to standard approaches to SO2 measurement (Burroughs and Sparks 1964) and several wines included in the study had fructose + glucose concentrations >50 g/L. However, the first order rate constant for dissociation of the glucose-bisulfite complex is reportedly 3.7 × 10⁻⁴/min at ~pH 1 (Vas 1949), which is slow compared to the time necessary for A-O or Ripper analysis and considerably slower than the first order rate constant for dissociation of anthocyanin-bisulfite adducts (0.2/min) (Brouillard and El Hage Chahine 1980).
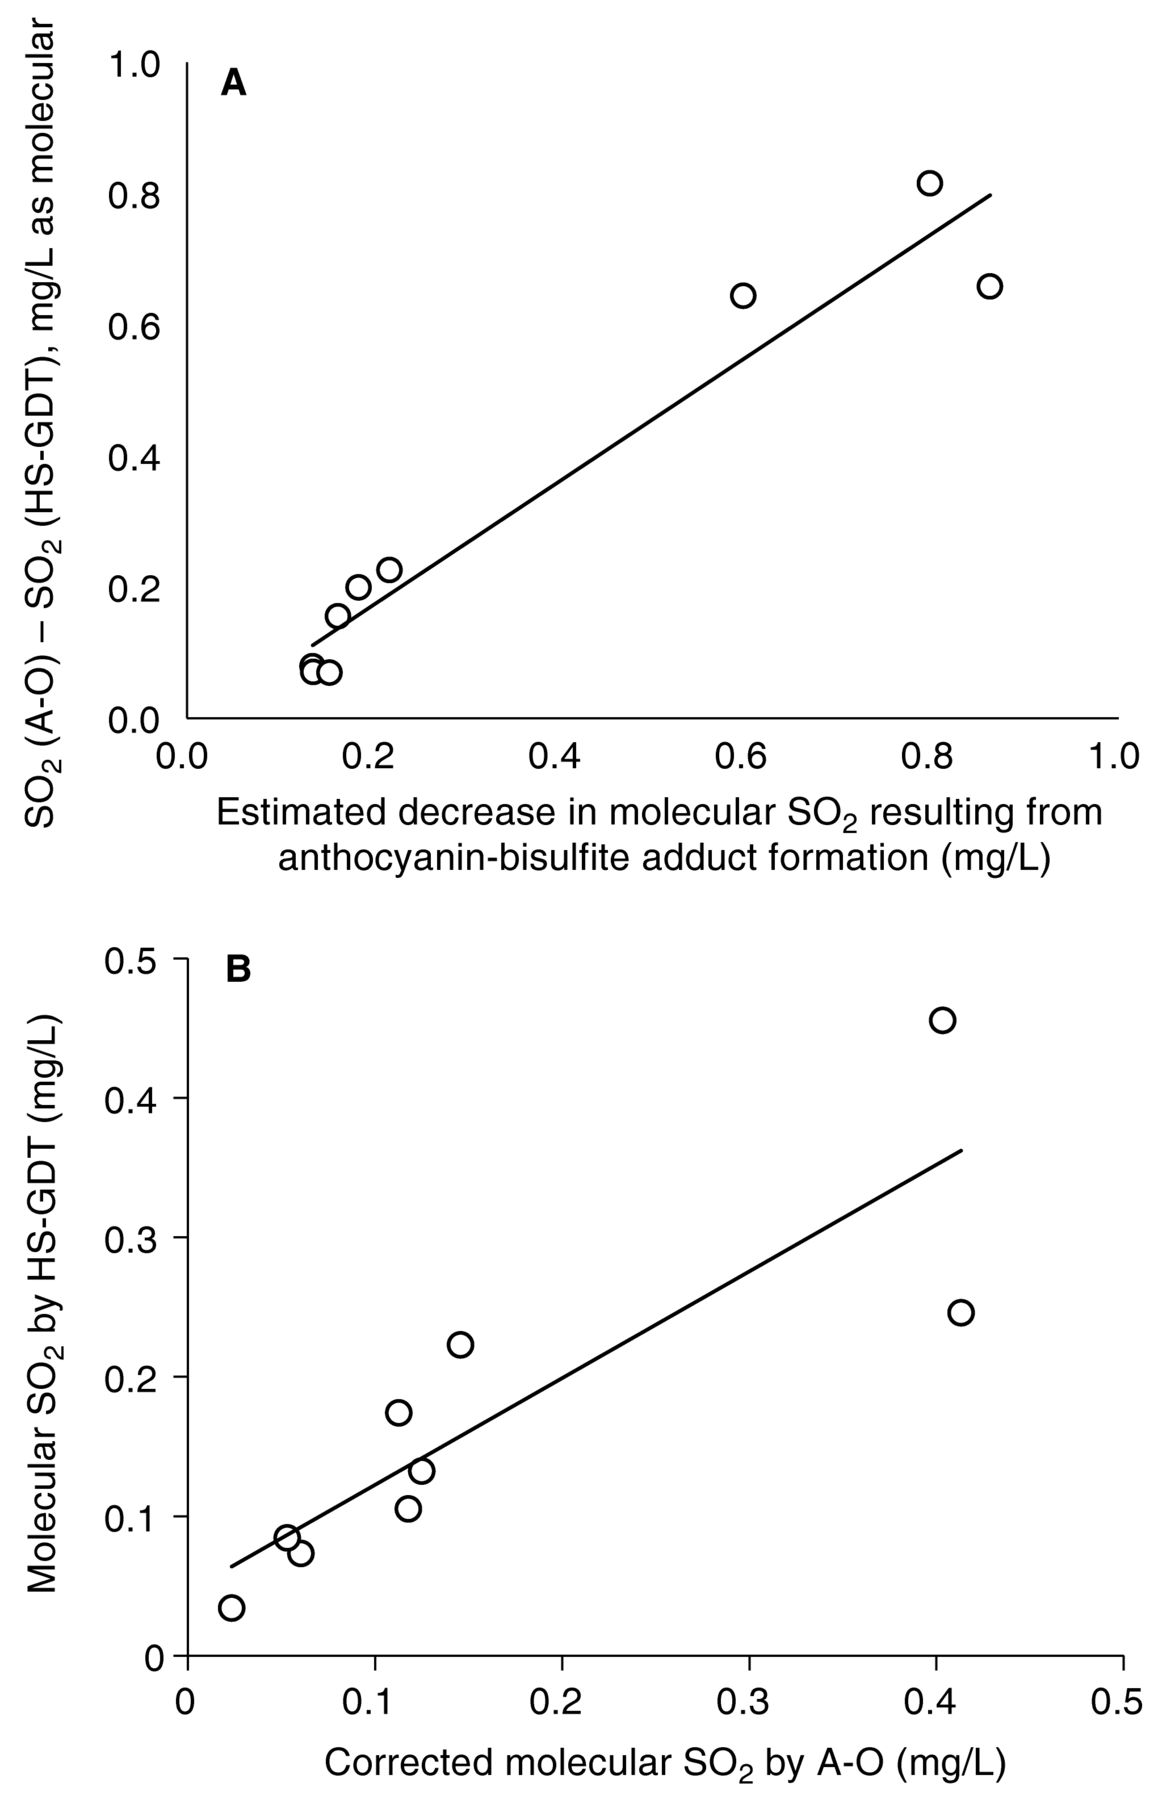
(A) Plot of differences in molecular SO2 by aeration-oxidation (A-O) and headspace gas detection tube (HS-GDT) methods versus estimated decrease in molecular SO2 resulting from anthocyanin-bisulfite adduct formation. Best fit-lines equations determined with 1/x weighting were y = 0.9436x − 0.0161, r2 = 0.9362. (B) Plot of molecular SO2 measured by the HS-GDT method versus the A-O reference method, corrected for theoretical anthocyanin-bisulfite adduct formation for nine red wines. Each data point represents the SO2 concentration of an individual wine (mean of n = 3). Best fit-lines equation determined with 1/x weighting were: y = 0.7652x + 0.0461, r2 = 0.76.
Conclusion
The HS-GDT method described here provides a convenient and inexpensive means to measure molecular and free SO2 concentrations typically found in wines without perturbing the equilibria of free and bound SO2 forms. Our work also supports previous (and often overlooked) observations that standard approaches to SO2 measurement overestimate free and molecular SO2 due to dissociation of weakly bound bisulfite adducts. This is particularly notable in red wines, where discrepancies up to five-fold were noted, and is also a minor issue in white and blush wines. Thus, the HS-GDT method may be of use to researchers interested in determining the mechanisms of wine oxidation or better establishing microbial tolerance to SO2. Because of the low requirements for consumables and fast analysis time (~5 min), HS-GDT could also be adopted for use by winemakers to quantify SO2 without a specialized lab space.
Although additional validation of the HS-GDT method is desirable, traditional approaches to method validation, such as standard addition and percent recovery calculations, are particularly challenging when working with free (or molecular) SO2 in wine matrices. Unlike the validation of a total SO2 method, when any addition of SO2 to a wine matrix would be reflected in the same increase in total SO2, addition of SO2 will result in variable increases in free or molecular SO2 because of varying concentrations of SO2 binders across wines. Standard addition could potentially be done by measuring major SO2 binders in wine to calculate the expected increase in free SO2 following SO2 addition. Because of the challenges of using standard addition, further validation of the HS-GDT method could be done by comparison with free (or molecular) SO2 values determined by other non-perturbing techniques, such as headspace GC, headspace IR, and CE.
Acknowledgments
The authors gratefully acknowledge ETS laboratories for providing analysis on the wine samples. The Brazilian CAPES Foundation funded scholarship support for Jussara Coelho (Process number 18868-12-6). Additional funding was from the Peter and Tacie Saltonstall Endowment and the New York Wine and Grape Foundation.
Footnotes
Supplemental data is freely available with the online version of this article at www.ajevonline.org.
- Received November 2014.
- Revision received February 2015.
- Accepted February 2015.
- Published online July 2015
- ©2015 by the American Society for Enology and Viticulture
Literature Cited
Vol 66 Issue 3


Jump to section
Related Articles
Cited By...
More from this TOC section
Similar Articles
