


Abstract
An experiment was conducted in central California on Merlot to determine the interaction of time of mechanical leaf removal (control, prebloom, or post fruit-set) and irrigation amount (sustained deficit irrigation (SDI) at 0.8 of estimated vineyard evapotranspiration (ETc) or regulated deficit irrigation (RDI) at 0.8 from budbreak to fruit set, 0.5 from fruit set to veraison, and 0.8 from veraison to leaf fall) on productivity, berry skin anthocyanin concentration and composition, and unit cost per hectare. Prebloom leaf removal (applied ~100 GDD prior to bloom) consistently maintained at least 20% of photosynthetically active radiation in the fruit zone in both years of the study, while post fruit-set leaf removal was inconsistent across years. The RDI treatments reduced berry mass, while post fruit-set leaf removal reduced berry skin mass. Prebloom leaf removal did not affect yield in either year. Exposed leaf area and leaf area to fruit ratio (m2/kg) were reduced with leaf removal. The RDI consistently increased juice soluble solids. Anthocyanin concentration increased with prebloom leaf removal in both years, but irrigation treatments had no effect. The proportions of acylated and hydroxylated anthocyanins were not affected by leaf removal. In both years, SDI increased di-hydroxylated anthocyanins while RDI increased tri-hydroxylated anthocyanins. Prebloom leaf removal when combined with RDI optimized total skin anthocyanins (TSA) per hectare, while no leaf removal and SDI produced the lowest TSA. The cost to produce one unit of TSA was reduced 35% by combining prebloom leaf removal and RDI when compared to no leaf removal and SDI. This study provides information to red winegrape growers in warm regions on how to manage fruit to enhance anthocyanin concentration and the proportion of hydroxylation, while reducing input costs through mechanization and reduced irrigation.
- anthocyanins
- leaf removal
- HPLC
- irrigation
- labor operations cost
- vineyard mechanization
- warm climate viticulture
The majority of winegrapes grown in the San Joaquin Valley (SJV) of California are used for bulk wine production. Grapes used to make red wines from this region are characterized by low anthocyanin accumulation and receive the lowest price per ton of all growing regions in the state. Approximately 34% of the Merlot grapes crushed in the state were grown in the SJV with an average grower return of $443/ton compared to the $753/ton state average (www.cdfa.ca.gov/). In recent years, efforts have been directed toward applying principles of canopy management with the aid of vineyard mechanization and deficit irrigation practices to improve berry composition and grower returns per ton by enhancing the color profile of red winegrapes grown in the region (Kurtural et al. 2013, Terry and Kurtural 2011, Wessner and Kurtural 2013, Williams 2012).
Anthocyanins are synthesized via the flavonoid pathway in grapevine cultivars that harbor the wild-type VvmybA1 transcription factor for expression of UDP-glucose:flavonoid 3-O-glucosyltransferase (UFGT) (Kobayashi et al. 2004). The encoded enzyme UFGT catalyzes glycosylation of unstable anthocyanidin aglycones into pigmented anthocyanins. Two primary anthocyanins, cyanidin and delphinidin, are synthesized in the cytosol of the berry epidermis. Cyanidin has a B-ring, di-hydroxylated at the 3’ and 4’ positions, and delphinidin has a tri-hydroxylated B-ring because of an additional hydroxyl group at the 5′ position. Two parallel pathways downstream of flavonoid 3′-hydroxylase (F3′H) and flavonoid 3′, 5′-hydroxylase (F3′5′H) produce either cyanidin or delphinidin (Castellarin et al. 2007). The 3′ position of cyanidin and delphinidin and sequentially, the 5′ position of delphinidin, are methoxylated by O-methyl-transferase to generate peonidin, petunidin, and malvidin, respectively.
The concentrations and relative abundance of single and total anthocyanins are variable among red winegrape cultivars due to genetic control and developmental regulation. However, there is general agreement in literature that when the amount of diffuse light is increased (Dokoozlian and Kliewer 1995) or when an amelioration of microclimate temperature is associated with a concomitant increase in diffuse light quantity (Spayd et al. 2002), beneficial effects on the total skin anthocyanin concentration of red winegrapes grown in hot climates are observed. Conversely, exposure of clusters to direct sunlight (Berqvist et al. 2001) or low sunlight with concomitant increase in berry temperature (Tarara et al. 2008) decreased anthocyanin accumulation, increased the proportion of 3′4′ hydroxylated anthocyanidins, and decreased the acylated anthocyanins contributing to total skin anthocyanins. In a model of field-grown Merlot grapevine, number of hours above 30°C or 35°C were used to delineate optimum and detrimental ambient temperatures for anthocyanin biosynthesis, respectively (Spayd et al. 2002). Tri-hydroxylated anthocyanins were reduced in shade-grown Pinot noir (Cortell and Kennedy 2006). Therefore, the effect of sun exposure results from the interaction of several factors that are hardly uncoupled under vineyard conditions.
Leaf removal can improve light transmittance into the fruiting zone of the canopy (Diago et al. 2012, Poni et al. 2006, Wessner and Kurtural 2013, Williams 2012). When leaf removal was applied prebloom, it decreased berry set and hence grapevine yield, but improved total skin anthocyanin concentration of Tempranillo grapevine in La Rioja in Spain (Diago et al. 2012). The results were used as a means of crop control, with the increase in relative skin mass and reduction in yield per cluster being interpreted as the cause of the increase in anthocyanin concentration. Since growers in the SJV are paid in tons produced per hectare, previous work in the hot climate of the SJV focused on post fruit-set, but was conducted preveraison to not adversely affect yield (Wessner and Kurtural 2013, Williams 2012). Leaf removal studies conducted in the SJV resulted in improved photosynthetically active radiation (PAR) exposure to the canopy interior, but no physiological gain for the cultivars studied. Some deleterious effects were noted due to overexposure of clusters to direct solar radiation or vegetative compensation response (Geller and Kurtural 2013, Kurtural et al. 2013, Williams 2012).
Water deficits consistently promote higher concentrations of anthocyanins in red winegrapes (Kennedy et al. 2002, Romero et al. 2010, Terry and Kurtural 2011). However, there are conflicting reports as to whether or not there were any direct effects on berry metabolism other than inhibition of berry growth. It remains unclear whether water deficits altered the biosynthetic pathway or if high anthocyanin concentrations resulted from elevated sensitivity of berry growth to water deficits. Growth of berries was inhibited more and concentrations of anthocyanins in berry skin and wine increased when water deficits were imposed before rather than after veraison (Matthews and Anderson 1989). Similarly, water deficits imposed one week post fruit-set until veraison resulted in a 25% amelioration of total skin anthocyanins in the central SJV (Terry and Kurtural 2011). Based on the observation of similar anthocyanin concentration per berry, two reports concluded that postveraison water deficits only inhibited fruit growth (Kennedy et al. 2002, Terry and Kurtural 2011). Gene expression studies investigating the regulation of anthocyanin biosynthesis in the grapevine concluded that both pre- and postveraison water deficits increased anthocyanin accumulation (Castellarin et al. 2007). What is more, water deficits can progressively modify the canopy microclimate by defoliating the basal leaves subtending the fruiting zone, resulting in greater exposure to solar radiation (Terry and Kurtural 2011, Williams 2012). However, the increase in anthocyanin concentration observed in Merlot grapevines exposed to water deficits was determined not to be due to basal leaf defoliation and increased solar radiation, but was instead the direct result of water deficit. The increase in anthocyanin concentration in Merlot was not due to overexpression of the FLS1 gene that correlates strongly with cluster light exposure for flavonoid biosynthesis in grapevine, but was instead due to upregulation of flavonoid synthesis genes, in particular UFGT, CHS2, CHS3, and F3H (Castellarin et al. 2007).
Previous canopy and crop load management studies (Geller and Kurtural 2013, Kurtural et al. 2013, Terry and Kurtural 2011, Wessner and Kurtural 2013) and irrigation studies, particularly those implementing deficit irrigation (Matthews and Anderson 1989, Williams 2010, 2014), were conducted in the coastal grapegrowing regions of California. No previous studies have combined both factors on winegrapes cultivated in the hot climate of California’s SJV. The main objective of this trial was to quantitatively increase the concentration of total skin anthocyanins in Merlot by investigating the interactive effects of manipulating solar radiation transmittance to fruit zone and water amounts applied in this hot climate. The specific objectives of the trial were to improve the light microclimate in the canopy without adversely affecting yield components, while simultaneously reducing applied water amounts to quantitatively and qualitatively improve the skin anthocyanin composition of Merlot in a resource-limited environment.
Materials and Methods
Site description, climate, and experimental design
The experiment was conducted at a commercial vineyard planted with Merlot (clone 1) × Freedom (27% Vitis vinifera hybrid) rootstock in 1998. The vine spacing was 2.13 m × 3.35 m (vine × row) in a north-south orientation. The research site was located in Merced County, CA (lat. 37°33′181″N; long. 120°39′665″W, 71 m asl) and was planted on Whitney and Rocklin sandy-loam soil, a fine-loamy, mixed, active, thermic Mollic Haploxeralf described as a well-drained soil formed in alluvium derived from granite (www.nrcs.usda.gov/). The vines were head-trained 1.1 m above the vineyard floor with two catch wires at 1.3 m and 1.6 m, cane-pruned to six, eight-node long canes, and allowed to sprawl. The vineyard was drip-irrigated with pressure-compensating emitters spaced at 1.1 m with two emitters per vine delivering 1.89 L/ha each. Vineyard crop evapotranspiration (ETc) was estimated as the product of reference evapotranspiration (ETo) and seasonal crop coefficients (Kc; Allen et al. 1998). The reference ETo was obtained from the California Irrigation Management Information System (CIMIS) weather station (#206) in Denair, CA. The amount of precipitation received and any additional irrigation amounts were recorded weekly. The seasonal Kcs used to schedule irrigation at this site were developed by measuring the shade cast on the vineyard floor beneath the canopy of vines irrigated at 0.8 ETc (sustained deficit irrigation; SDI) treatments at solar noon weekly. The shaded area beneath the canopy was determined by counting the number of equidistant 0.01 m2 cells on an 18 m2 grid and summing their area. The growing degree days (GDD) were calculated using the sine method using a threshold of 10°C and data obtained from CIMIS. All other cultural practices were carried out according to commercial industry standards for that area (Bettiga 2013). Typically, there is no leaf removal applied in the SJV.
The experiment was a three (two leaf removal and an untreated control) × two (deficit irrigation) factorial with a split-plot design with four replicated blocks. Three rows of 190 vines each comprised one block and four guard rows separated each block. The leaf removal treatments were randomly applied as main plot to three rows each. Each main plot of three rows was split into two deficit irrigation treatments as subplot at random, in the geographic middle on the east-west axis of the vineyard. Each experimental unit consisted of 285 vines of which 48 were sampled from an equidistant grid in each treatment replicate.
Leaf removal treatments
Two leaf removal treatments were applied with a control from which no leaves were removed. A prebloom leaf removal treatment was applied mechanically in both years to the east side of the canopy at 200 GDD (Eichhorn Lorenz [EL] Stage 17) about seven to ten days before bloom with a roll-over leaf remover with a perpendicularly mounted sickle-bar clipper adapted for sprawling canopies (Model EL-50; Clemens Vineyard Equipment, Woodland, CA). The leaf remover was also equipped with a centrifugal fan that dislodged plucked leaves with air-assistance. The leaf remover opened a 50-cm window in the fruiting zone of the canopy with the aim of removing ~18% of the exposed leaf area. The post fruit-set leaf removal treatment was applied at 540 GDD and 644 GDD (EL Stage 29) in 2013 and 2014, respectively.
Irrigation treatments
There were two irrigation treatments applied. A control treatment of SDI at 0.8 of estimated ETc was applied from anthesis until harvest (EL Stage 38) with a midday leaf water potential (Ψl) threshold of −1.2 MPa. A regulated deficit irrigation (RDI) treatment was applied at 0.8 ETc from anthesis to fruit set (EL Stage 28) with a Ψl threshold of −1.2 MPa, 0.5 ETc from fruit set to veraison (EL Stage 35) with a Ψl threshold of −1.4 MPa, and at 0.8 ETc from veraison until harvest with a Ψl at −1.2 MPa. Irrigation treatments in each year were not initiated until Ψl reached −1.0 MPa for vines in the 0.8 ETc treatments.
Water status determination
The water status of the grapevines throughout the growing season was monitored weekly by measuring Ψl. One fully expanded leaf, exposed to the sun and showing no sign of disease or damage, was selected. A zip-top plastic bag was placed over the single leaf and sealed before the petiole was excised to suppress transpiration. Ψl was then determined directly using a pressure chamber (Model 610 Pressure Chamber Instrument; PMS Instrument Co., Corvallis, OR).
Canopy architecture, microclimate, and light measurements
Four point quadrat measurements were collected three times during the growing season in 2013 and 2014 at 225 GDD (EL Stage 18), 950 GDD (EL Stage 34), and 1400 GDD (EL Stage 36). Canopy architecture was quantified by measuring exterior leaf, interior leaf, cluster number, and gap number with five insertions per sample vine at 30 cm intervals as reported elsewhere (Wessner and Kurtural 2013). Calculation of leaf layer number was as described (Smart and Robinson 1991). The percentage of PAR intercepted in the fruiting zone for sprawling-type canopies was measured as reported (Kurtural et al. 2013) with a handheld ceptometer (AccuPAR-80; Decagon Devices, Pullman, WA).
Yield components, efficiency, and labor operation costs
Yield components were measured as the fruit reached 24 Brix on a single harvest date: 26 Aug 2013 (1660 GDD) or 19 Aug 2014 (1740 GDD). Each treatment replicate was harvested manually. The clusters from each vine were counted and weighed. The mean cluster mass was calculated by dividing yield per vine by number of clusters per vine. One hundred berries were randomly collected and weighed using an analytical top-loading scale (ML 104; Mettler-Toledo International Inc., Columbus, OH) to calculate mean berry mass. The mean berry number per cluster was calculated by dividing mean cluster mass by mean berry mass. Leaf area measurement was conducted once during the growing season at EL Stage 36. A one-meter section of the canopy where shoots were counted and destructively harvested was randomly selected (Terry and Kurtural 2011). Leaf area was measured with a leaf area meter (LI-3000; LI-COR, Lincoln, NE), and total leaf area per vine was calculated as described (Kurtural et al. 2012). Yield efficiency was calculated by dividing the leaf area of each sample vine by yield per vine and expressed as m2/kg. Labor operation costs were extrapolated to determine the cost to one gram of total skin anthocyanin per hectare, which was calculated by taking the total labor operations cost of cultural practices and cost of irrigation for one megaliter (ML) per hectare (Kurtural et al. 2012), divided by total skin anthocyanin (g) on a per hectare basis.
Berry composition analysis
The berry total soluble solids (TSS, in Brix), juice pH, and titratable acidity (TA, in g/L tartaric acid equivalents) were analyzed from a 100-berry random sample collected from each treatment replicate during harvest. The protocol for sample collection and chemical analysis was as described (Terry and Kurtural 2011). The TSS was measured with a digital refractometer (ATAGO PR-32 Pallette digital refractometer; ATAGO USA, Bellevue, WA). Juice pH was determined with a glass electrode pH meter (Accumet 13-620-183A AB15; Fisher Scientific, Pittsburgh, PA). The TA was analyzed by titrating to an endpoint pH of 8.2 with 0.1 N NaOH with a Mettler-Toledo DL15 endpoint titrator (Mettler-Toledo International Inc.), and values were expressed in g/L.
Berry skin anthocyanin composition
The anthocyanin composition of berry skin was determined with an exhaustive extraction method. At harvest, 20 random berries were collected from each treatment replicate, weighed, frozen in liquid nitrogen, and stored at −80°C until analyzed. Berry skins were manually removed, rinsed with deionized water, and counted. Samples were lyophilized (Triad Freeze Dry System; Labconco, Kansas City, MO) and reweighed to obtain the freeze-dried mass. The average dry weight of a single berry skin per treatment replicate was determined by dividing the total lyophilized skin mass by the number of berry skins. The samples were then extracted in 20 mL 66% (v/v) acetone in the dark for 24 hr. Samples were filtered under vacuum, the grape marc was discarded, and a 1-mL sample was collected. The acetone was evaporated from the samples under vacuum with a centrivap (model 7810010; Labconco), attached to a −103°C cold trap (model 7385020; Labconco), and brought up to a volume of 5 mL. Samples were then centrifuged for 15 min at 1400 g. The supernatant was pipetted into a 2-mL HPLC vial and subjected to HPLC-DAD analysis.
HPLC analysis and procedure
Anthocyanin analysis was conducted with a reversed-phase high performance liquid chromatography (HPLC) using an Agilent 1100 series (Agilent Technologies, Santa Clara, CA) modular HPLC system. The HPLC system included a system controller, G1379A degasser, G1311A quaternary pump, G1313A autosampler, G1316A column compartment, and a G1315A DAD/UV-vis detector. Data were processed using ChemStation version B.04 designed for an LC system. Separation of anthocyanins was performed with a LiChrospher 100 RP-18 column (4 × 250 mm, 5 μm particle size; Agilent Technologies); a guard column of the same material was also installed and column temperature was maintained at 40°C.
The procedure used three mobile phase solutions for analysis. The solvents were (A) 50 mM ammonium di-hydrogen ammonium phosphate adjusted to pH 2.6, (B) 20% Mobile A + 80% acetonitrile (v/v), and (C) 0.2 M ortho-phosphoric acid adjusted to pH 1.5. Solvents established the gradient as reported elsewhere (Ritchey and Waterhouse 1999). Analytical grade water was purified with 0.2 μm charged sterile filters before use (Siemens Labostar Ultrapure Water Systems, Munich, Germany). The HPLC-grade mobile phase components were purchased from Fisher Scientific. Spectra were recorded from 190 to 600 nm.
Quantification of anthocyanins was conducted using peak area measurements at 520 nm. The commercial standard used was malvidin-3-O-glucoside (Extrasynthése, Genay, France). Individual anthocyanin compounds were tentatively identified by order of elution, retention times of pure compound, and previous research (Ritchey and Waterhouse 1999).
Statistical analysis
Interactions between years and treatments were tested and, when significant (p < 0.05), analysis was conducted separately for each year. The results were subjected to a two-way (leaf removal × deficit irrigation) analysis using the MIXED procedure of SAS (v.9.3; SAS Institute, Inc., Cary, NC) appropriate for split-plot with a factorial arrangement of treatments. All data were tested for normality using Shapiro-Wilk’s test. Some anthocyanidin data required a combination of log and square root transformations, and PAR values were log transformed in both 2013 and 2014. Treatment means were considered significantly different by Tukey’s honestly significant difference adjustment at p < 0.05 in the LSMEANS option of MIXED procedure.
Results
Climate
The cumulative GDD in both years of the study was higher than the five-year average (2010 to 2014) of 2037. The daily mean temperature, monitored from budbreak to harvest, was higher in 2014 than in 2013. In 2013, the number of days that exceeded 32°C and 37°C were 61 and 10, respectively, while in 2014, the number of days reaching above 32°C and 37°C were 71 and 11, respectively. Hence, the dates of each phenology stage in 2014 were approximately four to seven days earlier than in 2013 (Table 1). Compared to 2013, the majority of precipitation in 2014 was received between budbreak and fruit set (Figure 1). The amount of rainfall received at the site in 2014 affected the estimated Kc. In 2013, the maximum estimated Kc was estimated at only 0.31 reached on 6 May 2013, while in 2014 the maximum estimated Kc was 0.43 reached on 7 July 2014. The estimated Kc affected the ETc in each respective year.
Phenological progression of Merlot 01/Freedom in 2013 and 2014 in the northern San Joaquin Valley of California.

Seasonal precipitation, estimated crop evapotranspiration (ETc in mm), and amount of water applied/vine/week (L) by sustained deficit irrigation (SDI) and regulated deficit irrigation (RDI) in 2013 (A) and 2014 (B) in a commercial Merlot vineyard in the San Joaquin Valley of California.
There was a consistent separation of irrigation treatment means in both years (Figure 2). SDI and RDI were maintained close to the prescribed Ψl. This was more evident in the seven-week period when RDI was imposed on the split irrigation treatments and the means separated from the SDI significantly. There was no interaction between leaf removal and irrigation treatments on Ψl in either year.

Mean midday leaf water potential of Merlot grapevine as affected by sustained deficit irrigation (SDI) and regulated deficit irrigation (RDI) in 2013 (A) and 2014 (B) in a commercial vineyard in the San Joaquin Valley of California.
Leaf removal and light regime
In both years, prebloom leaf removal provided the most PAR transmittance into the canopy interior (Figure 3). Likewise, postbloom leaf removal increased PAR transmittance into the canopy interior after its application. The leaf layer numbers of the canopy were reduced in both years by prebloom leaf removal, regardless of measurement date (Figure 4). Likewise, postbloom leaf removal reduced leaf layer numbers after its application. Irrigation treatments had no effect on the canopy variables measured in either year of the study.
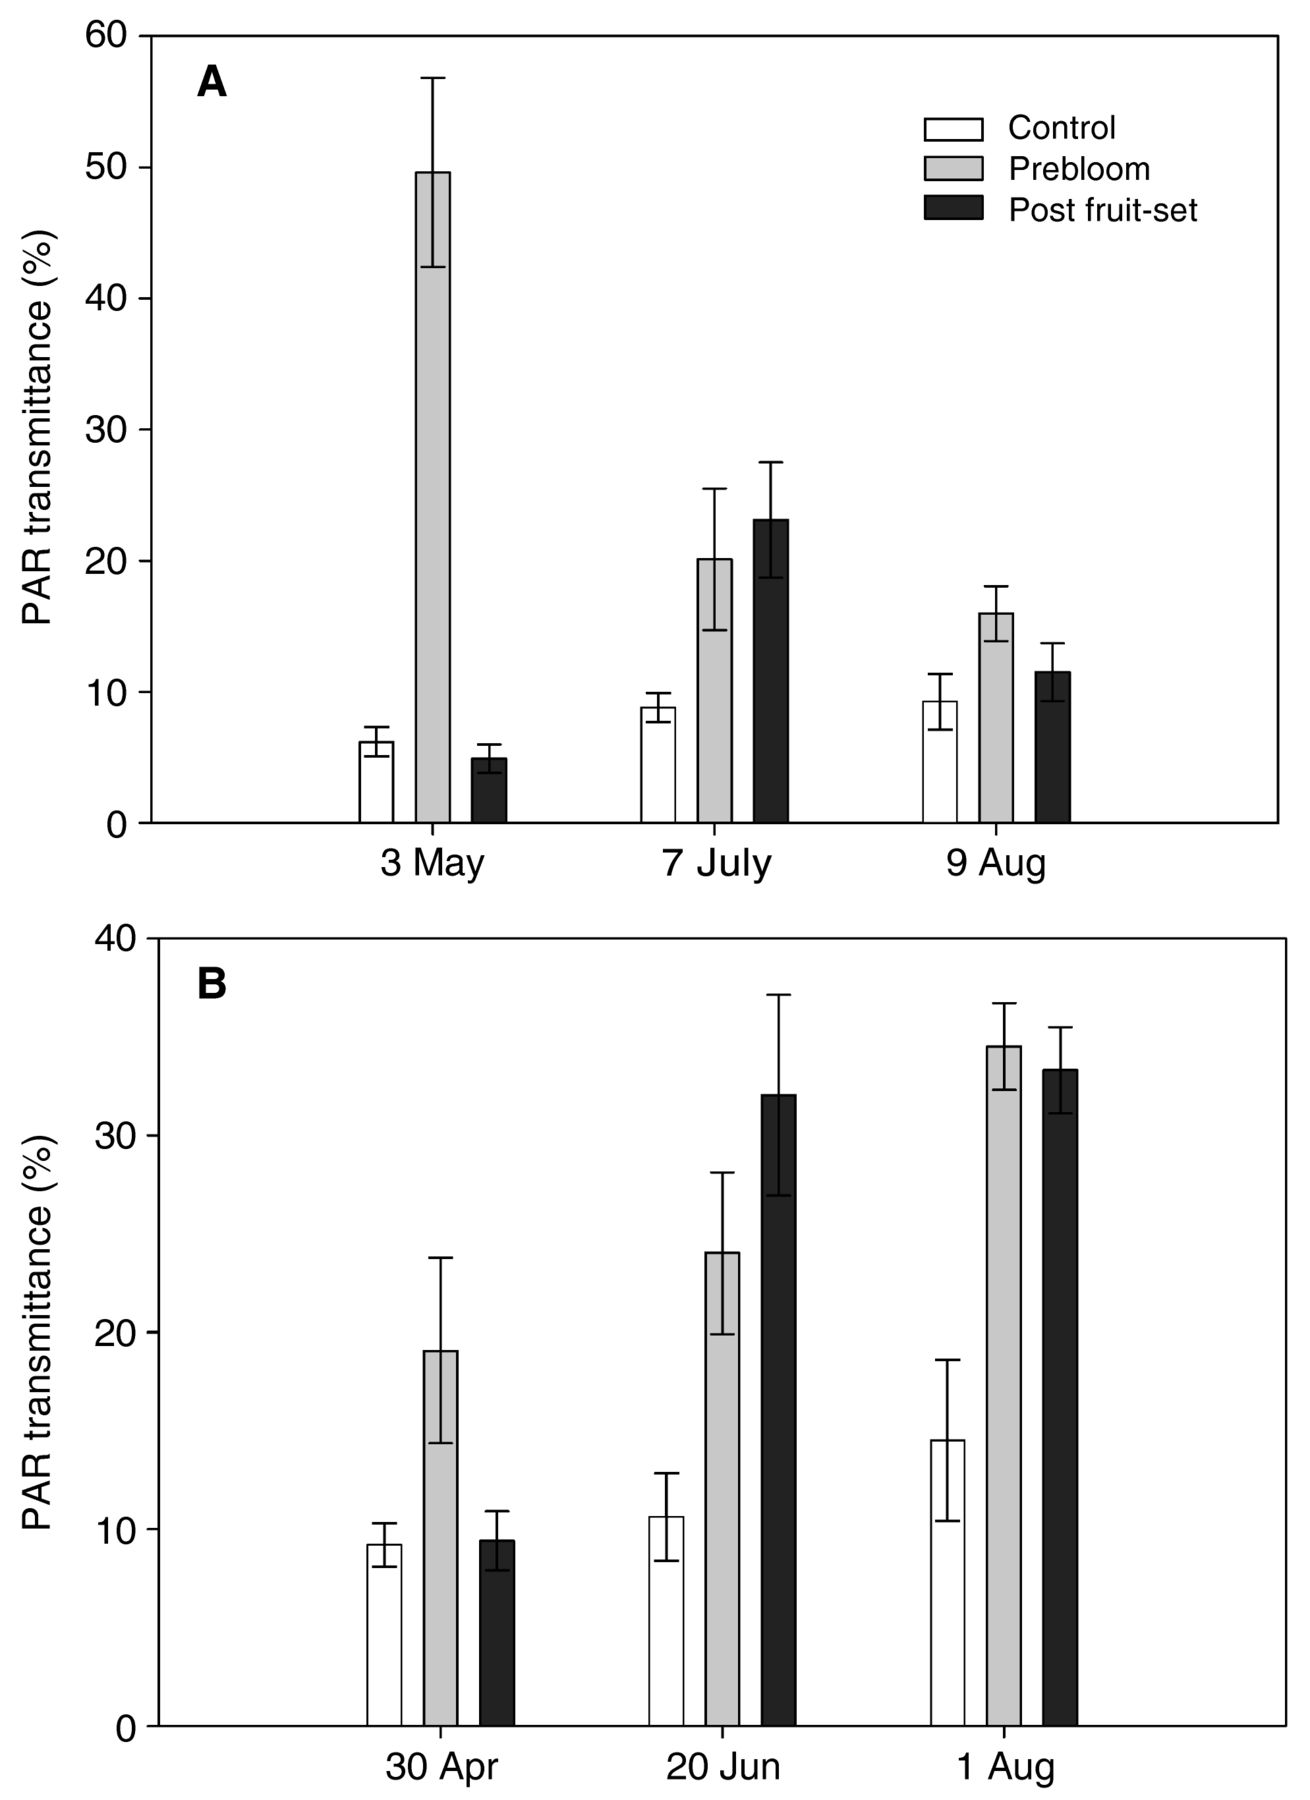
Mean proportion of ambient photosynthetically active radiation (PAR) transmitted to fruit zone as affected by leaf removal in a commercial Merlot vineyard in the San Joaquin Valley of California in 2013 (A) and 2014 (B). The bars indicate the standard error of the mean.

Mean leaf layer numbers as affected by leaf removal treatments in 2013 (A) and 2014 (B) in a commercial vineyard in the San Joaquin Valley of California. The bars indicate the standard error of the mean.
Yield components
Leaf removal consistently affected berry skin mass and exposed leaf area in this two-year study. Prebloom and post fruit-set leaf removal reduced the berry skin mass by 6 and 18% in 2013 and 5 and 13% in 2014, respectively (Table 2). The exposed leaf area was reduced by 18 and 21% in 2013 and 2014, respectively, by prebloom and post fruit-set leaf removal. In 2013, leaf removal also affected the berry mass, cluster mass, and leaf area to fruit ratio. In 2013, the berry mass and cluster mass were reduced ~7 and 13% by prebloom and post fruit-set leaf removal, respectively. Additionally, the leaf area to fruit ratio was reduced by 14 or 22% by prebloom or post fruit-set leaf removal, respectively. However, there was no effect of leaf removal on these components in 2014, indicating a year effect for yield components. Leaf removal had no impact on berry number per cluster in either 2013 or 2014.
Effects of mechanical leaf removal and fractions of crop evapotranspiration application on components of yield and yield efficiency of Merlot 01/Freedom in the northern San Joaquin Valley of California (n = 4).
The irrigation regime consistently affected berry mass in both years. RDI reduced the berry mass by 6 and 9% in 2013 and 2014, respectively, below that of SDI (Table 2). In 2014, RDI reduced the cluster mass and yield by ~13% compared to SDI. The leaf area to fruit ratio was 33% higher in RDI than in SDI. No similar effect of irrigation regime was observed in 2013. Irrigation regime did not affect berry skin mass, clusters/m, or exposed leaf area during the two-year trial. Experimental year had an effect on all yield components. All variables except cluster number/m were slightly lower in 2014 than in 2013. Additionally, leaf removal increased cluster/m in 2013 but reduced it in 2014.
Berry composition
A considerable effect on berry composition at harvest was observed between years. Juice pH was slightly higher in 2013 than in 2014, while the inverse occurred with TA (Table 3). Both leaf removal and irrigation regime affected Brix from year to year, but not juice pH or TA. There was an effect of leaf removal on Brix in 2013. Post fruit-set leaf removal decreased Brix by 3% below either the control or prebloom leaf removal. In 2014, leaf removal had no effect on Brix. Differences in Brix due to irrigation regime were observed in both growing seasons. RDI increased Brix over that of SDI by 2 and 2.5% in 2013 and 2014, respectively.
Effects of mechanical leaf removal and fractions of crop evapotranspiration application on berry composition of Merlot 01/Freedom in the northern San Joaquin Valley of California (n = 4).
Quantitative anthocyanin composition
There were 11 anthocyanins identified in the berry skins of Merlot in the hot climate. The 3-glucosides of anthocyanins were all present, but the acylated forms of delphidin and coumarates of delphidin, cyanidin, and peonidin were not seen (Table 4). Skin anthocyanins were strongly affected by year: concentrations were lower in 2014 than in 2013. The total skin anthocyanins (TSA) were affected by the interaction of year and leaf removal treatment. The TSA were higher in 2013 with prebloom leaf removal. In both years, prebloom leaf removal increased TSA by 25% over the control. Irrigation treatments did not affect TSA in either year.
Effects of mechanical leaf removal and fractions of crop evapotranspiration application on individual and total skin anthocyanin concentrations (mg/kg) from Merlot 01/Freedom berry skins in northern San Joaquin Valley of California (n = 4).
The 3-glucosides of Merlot skin anthocyanins were strongly affected by year and leaf removal interaction; concentrations were greater in 2013 than in 2014. In 2013, prebloom leaf removal increased concentrations of delphinidin-3-glucoside (d-3-g), cyanidin-3-glucoside (c-3-g), petunidin-3-glucoside (pt-3-g), peonidin-3-glucoside (po-3-g), and malvidin-3-glucoside (m-3-g) above those of the control and post fruit-set leaf removal treatments. The irrigation treatments did not affect the concentrations of 3-glucosides in 2013. The increased concentrations of 3-glucosides with prebloom leaf removal also occurred in 2014. However, in 2014, post fruit-set leaf removal also increased the concentration of 3-glucosides. As in 2013, irrigation treatments did not affect the concentrations of 3-glucosides in 2014. The 3-acetyl glucosides were affected by the interaction of year and leaf removal treatments. The concentrations of 3-acetyl glucosides measured in the Merlot skins were higher with prebloom leaf removal treatment in 2013 than in 2014.
The acylated concentrations of c-3-g, pt-3-g, po-3-g, and m-3-g increased in both years with the application of prebloom leaf removal. In 2014, post fruit-set leaf removal also increased the concentrations of acylated forms of anthocyanidins found in Merlot skin tissue. The irrigation treatments did not affect the concentrations of 3-acetyl glucosides in 2014. The coumarate of pt-3-g was not affected by leaf removal in 2013. However in 2014, prebloom and post fruit-set leaf removal increased its concentration over the control. The concentration of the coumarate of m-3-g increased consistently in 2013 and 2014 with leaf removal. The irrigation treatments did not affect the concentration of 3-coumaryl-glucosides in either year.
Qualitative anthocyanin composition
A year effect was observed in the proportions of all anthocyanidins but petunidin (Table 5). Malvidin was always the largest constituent, followed by peonidin, petunidin, delphinidin, and then cyanidin. Leaf removal affected all anthocyanidins except peonidin in both years. In 2013, prebloom leaf removal increased the proportions of delphinidin, cyanidin, and petunidin, while decreasing the proportion of malvidin. In 2014, the proportions of delphinidin and peonidin decreased while those of cyanidin and malvidin increased. Post fruit-set leaf removal responded similarly to the control. In 2014, post fruit-set leaf removal resulted in the highest delphinidin, cyanidin, and petunidin proportions, but had the lowest malvidin proportion. Irrigation regime affected the cyanidin and peonidin proportions in 2014, where SDI increased it compared to RDI.
Effects of mechanical leaf removal and fractions of crop evapotranspiration (ETc) application on the composition, acylation, and hydroxylation of skin anthocyanin concentrations from Merlot 01/Freedom berry skins in the northern San Joaquin Valley of California (n = 4).
The percentages of acylated versus nonacylated TSA were comparable in both years (Table 5). A larger proportion of TSA were nonacylated than acylated, regardless of leaf removal or irrigation regime. In contrast, the proportion of di- and tri-hydroxylated skin anthocyanins was strongly affected by year, with concentrations of both lower in 2014. Tri-hydroxylated anthocyanins always comprised a higher proportion than di-hydroxylated anthocyanins regardless of treatment. Leaf removal did not affect hydroxylation in either year, but irrigation affected hydroxylation proportion in both years. SDI increased the proportion of di-hydroxylated anthocyanins in both years when compared to RDI.
Effects of leaf removal and irrigation on labor operations and anthocyanin growing costs
Adding mechanical leaf removal to cultural operations in a traditionally managed SJV vineyard increased labor operations cost by only $30/ha (Table 6). Shifting the amount of irrigation applied by using RDI instead of SDI saved 0.34 ML and 0.48 ML of water in 2013 and 2014, respectively. Consequently, the irrigation water cost declined proportionally. The TSA produced per hectare was consistently greatest with prebloom leaf removal with RDI or SDI in both years of the study. Compared to the control irrigated with SDI, prebloom leaf removal irrigated with RDI increased TSA per hectare by 45% and 34% in 2013 and 2014, respectively.
Effects of mechanical leaf removal and fractions of crop evapotranspiration application on labor operations cost of canopy management and cost of producing total skin anthocyanins per hectare in northern San Joaquin Valley of California (n = 4).
The most expensive treatment to farm for one g/ha of TSA was control irrigated with SDI. More TSA was produced at a lower cost per hectare with prebloom leaf removal combined with RDI or SDI. Therefore, the cost to grow anthocyanin (g/ha) was affected by the interaction of leaf removal and irrigation.
Discussion
Effects of climate on research site irrigation regime
There was a distinct difference in the amount of precipitation received at the research site in 2013 and 2014: an additional ~15 mm precipitation in 2014. This difference affected the estimated Kc used in irrigation calculations. Irrigation amounts (ETc) were calculated as the product of Kc and ETo (Allen et al. 1998, Williams and Ayars 2005). Williams and Ayars (2005) reported a correlation with an R2 value of 0.95 between Kc and the ground cover shade cast by the canopy. This strong and positive relationship allows Kc to be calculated from canopy shade measurements. The maximum estimated Kc values attained in this study were 0.31 and 0.42 in 2013 and 2014, respectively. These values are low compared to other recommendations for a hot climate region. A maximum Kc of 0.70 for vineyards was recommended for a row width of 3.35 m (Allen et al. 1998). Alternatively, a maximum Kc of 0.98 was recommended for vineyards with a row width of 3.35 m (Williams et al. 2003). Since Kc depends on trellis height, pruning system, and row spacing, a common maximum Kc cannot be appropriate for all trellis, canopy, and vineyard configurations. The short cordon height (1.1 m) and wide vineyard row spacing (3.35 m) contributed to the lower Kc values. It should be noted that the Kc values reported by Allen et al. (1998) were for unstressed crops cultivated under standard conditions and achieving maximum crop yield. The low Kc values attained in this study likely resulted from reduced soil moisture at budbreak due to lack of winter precipitation. Reduced stored soil moisture severely restricts shoot growth and canopy development, regardless of in-season irrigation application (Mendez-Costabel et al. 2013). Although the canopy was slower to develop and fill allocated space in 2013, similar canopy architecture values were achieved in both years. The Kc in both years remained at the maximum amount reached until the end of the season (31 Oct in both years) since the vineyard was irrigated to that day in both years. This is in line with previous reports from the SJV that Kc does not decrease after harvest if irrigation is not decreased or terminated after that time (Williams 2012). Validation of the estimated seasonal Kc reported here was achieved using comparisons of weekly Ψl and berry mass at harvest. The mean Ψl measured throughout and at the end of the season for the SDI vines was greater than that of RDI vines (Figure 2) as also reported elsewhere (Girona et al. 2006, Williams and Baeza 2007). Berry mass at harvest of the RDI vines was 92% of SDI averaged over the two years. Achieving a similar response of berry mass to fractions of ETc application to those previously reported (Williams 2012) is probably fortuitous but demonstrates the reliability of using Kc to estimate vineyard water use.
Effects of leaf removal and irrigation on canopy microclimate
Leaf removal, whether conducted prebloom or post fruit-set, increased the proportion of PAR reaching the fruit zone. In contrast to previous reports, irrigation had no effect on the proportion of PAR reaching the fruit zone at any sampling time (Williams 2012). This was possibly due to the fractional amounts of ETc applied being too similar to have a significant effect on canopy architecture. Previously, we reported an indirect effect of ETc fraction of irrigation applied to procumbent canopies, where the number of leaf layers in Syrah was reduced using basal leaf defoliation (Terry and Kurtural 2011). However, as the season progressed, the proportion of PAR reaching the fruit zone changed depending on leaf removal treatment as reported elsewhere (Diago et al. 2012, Poni et al. 2006, Wessner and Kurtural 2013). The measured increase in proportion of PAR reaching the fruit zone and decrease in leaf layer numbers was a feasible and expected outcome of leaf removal, regardless of timing of leaf removal (Diago et al. 2012, Geller and Kurtural 2013, Poni et al. 2006). The proportion of PAR reaching the fruit zone with prebloom leaf removal was 47% and 21% of the ambient at one week after leaf removal in 2013 and 2014, respectively. Despite the substantial leaf area restriction imposed by prebloom leaf removal, the vines successfully recovered due to intrinsic vine vigor. However, the amount of recovery was more limited with prebloom leaf removal than with postbloom leaf removal in both years. The prebloom leaf removal treatment had more PAR reaching the fruit zone and fewer leaf layers at verasion and before harvest in both years. This may be attributed to lower lateral growth and to leaf removal blower effects on growing or incipient lateral tips at the time of defoliation, which can prevent further development during the growing season (Diago et al. 2012). Postbloom leaf removal also reduced leaf layer numbers and increased PAR transmittance into the fruit zone in both years. However, the effects were not as long-lived as prebloom leaf removal since canopies subjected to postbloom leaf removal in 2013 recovered quickly and achieved similar PAR transmission to fruit zone, but still had fewer leaf layers than the control. In 2014, postbloom leaf removal responded in similar fashion to prebloom leaf removal: PAR transmittance into the fruit zone and leaf layer numbers were similar at harvest. Both pre- or postbloom leaf removal increased PAR transmittance into the fruit zone at veraison and harvest. This was similar to a reported hot climate response in which the weight of fruit on canes pulled the basal portion of the shoots apart from one another, providing more light into the center of the canopy (Terry and Kurtural 2011). The PAR in the control canopies with no leaf removal was similar in both years to those previously reported for dense, sprawling canopies commonly seen in the SJV (Williams 2012, Dokoozlian and Kliewer 1995).
Effects of leaf removal and irrigation on yield components
In the hot climate of the SJV, restriction of carbohydrate supply by defoliation at either pre- or post-berry set reduced berry mass at harvest as previously reported (Geller and Kurtural 2013, Poni et al. 2006, Wessner and Kurtural 2013). The effects of irrigation on berry mass were similar in many respects to previous findings (Williams et al. 1994, Terry and Kurtural 2011). Berry weight of Grenache and Cabernet Sauvignon grown in the SJV generally increased as exposure of clusters to sunlight first increased and then decreased with further increases in exposure at midday, depending on the side of the vine on which the clusters were located (Bergqvist et al. 2001). In our study, the berries were more exposed on the east side of canopy and the observed differences in berry weight agreed with the previous finding. Although not measured in our study, the smaller berry mass seen with leaf removal can also be attributed to lower cluster water potential in exposed berries (Williams 2012).
In contrast to a previous report (Diago et al. 2012), we saw no increase in skin mass with leaf removal. However, the skin mass of prebloom leaf removal berries was higher than that of post-set leaf removal berries and similar to the control in both years. The increased skin mass of Merlot berries following prebloom leaf removal can be explained by the long-term adaptation mechanism of berry thickening (Diago et al. 2012). The percentage skin mass increase of prebloom leaf removal berries was 15% and 9% in 2013 and 2014, respectively, over post-set leaf removal. These values are greater than those reported in previous work (3.6% by Palliotti et al. 2011, 0.7% by Diago et al. 2012). The long-term adaptation mechanism of berry skin thickening was a response to precocious and prolonged infructescence and cluster exposure caused by prebloom leaf removal. The decline in skin mass with post fruitset leaf removal was likely a result of undue stress imposed on exposed clusters by increased sun exposure (Bergqvist et al. 2001, Geller and Kurtural 2013, Williams 2012), and possibly by differences in cluster water potential.
In contrast to previous reports, the timing of leaf removal or its application did not affect the number of berries per cluster. Previous reports of prebloom leaf removal in which a greater percentage of leaf area was removed and which were conducted in cooler climates emphasized source limitation through prebloom leaf removal as the cause of reduced berry number at harvest (Diago et al. 2012, Poni et al. 2006). This did not occur in this hot climate. The mitigation of vegetative compensation in the procumbent Merlot cultivar through sustained deficit or regulated deficit irrigation invigorated lateral shoot regeneration for four weeks, or just enough to set similar, if not more, berries per cluster. Although cluster mass at harvest was significantly different than the control in the initial year of the trial, there were no differences among leaf removal treatments and the control in the second year. The number of clusters per meter row was not affected by prebloom leaf removal in either year, but was enhanced by post-set leaf removal in the first year. The yield per meter row was not affected by prebloom leaf removal in either year. Postbloom leaf removal possibly exerted too much stress on the clusters, potentially decreasing yield due to reduced cluster water potential in the second year. As the amount of water applied decreased, berry mass also decreased as reported elsewhere (Williams 2012). In 2013 and 2014, RDI reduced berry mass by 6% and 9% below the control. The reduction of berry mass by RDI was less in Merlot than that reported in Syrah in the same growing region with similar irrigation (Terry and Kurtural 2011). Skin mass, however, was not affected in this study by irrigation treatment. This may be due to the applied water amounts being too similar in this resource-limited environment. Since growers are paid by the ton in the SJV, the consistent reduction in yield may not make RDI a viable option for growers since it saved only a little applied water.
The exposed (functional) leaf area was consistently affected by leaf removal, but not by applied water amounts as reported previously (Williams 2012). We collected our measurements at veraison, after canopy closure, to document the lasting effects of leaf removal. For single plane, nonshoot-positioned canopies in the SJV, a leaf area to fruit ratio of 0.8 to 1.2 m2/kg is required to sustainably crop winegrapes (Geller and Kurtural 2013, Terry and Kurtural 2011, Wessner and Kurtural 2013). In 2013, only prebloom leaf removal reached this target window. In 2014, all treatments were in this target window, but the differences among treatment means were retained and only prebloom leaf removal treatment had a balanced vegetative to reproductive growth ratio.
Effects of leaf removal and irrigation on berry composition
Leaf removal had no consistent effect on Brix, juice pH, or TA. Similar results were reported for Merlot in the SJV with post-set leaf removal (Williams 2012). However, RDI consistently advanced Brix in Merlot over SDI. We reported similar results with Syrah (Terry and Kurtural 2011) and concluded that advancing Brix accumulation with RDI was a concentration effect due to reduced berry mass.
Effects of leaf removal and irrigation on anthocyanin accumulation and growing costs
Anthocyanin accumulation and profile in Vitis are determined by a synergistic combination of solar radiation and berry temperature, both of which can be directly manipulated by canopy and irrigation management. The anthocyanin concentration of Merlot berries consistently increased with increased fruit exposure early in the growing season, aided by prebloom leaf removal. We attribute this primarily to the skin mass-increasing mechanism of the grapevine in response to early exposure of the flower cluster and infructescence to solar radiation (Diago et al. 2012). In addition, there was a strong, positive linear relationship between TSA and PAR transmittance into the fruit zone in 2013 (R2 = 0.7889, p < 0.0001) and 2014 (R2 = 0.6994, p < 0.0001). However, this relationship was only evident when PAR was measured one week after prebloom leaf removal and only when it exceeded 20% of ambient PAR. However, unlike in many higher plants, the accumulation of anthocyanins in Vitis spp. is not completely dependent on the presence of light (Downey et al. 2004). However, the absolute amount of PAR exposure in the canopy interior does affect anthocyanin composition. The most obvious differences in anthocyanin composition between treatments with prebloom leaf removal were an increase in tri-hydroxylated anthocyanins: the glucosides of malvidin, petunidin, and delphinidin. Similar results were reported in Syrah (Downey et al. 2004). This result suggests that increasing PAR transmittance in the fruit zone by at least 20% of the ambient using prebloom leaf removal increased the activity of F3’5’H, or expression of the gene encoding that enzyme, or alternatively decreased the activity of F3’H or downregulated expression of that gene. Conversely, cyanidin and peonidin (di-hydroxylated anthocyanins) were not reliably affected by leaf removal.
Irrigation treatments did not have a consistent effect on anthocyanin composition. The di-hydroxylated anthocyanin composition increased in both years with SDI. This suggests that when Merlot was subjected to SDI, the activity of F3’H increased or the expression of that gene was upregulated. The acylation composition pattern of anthocyanins in a hot climate was not affected by the treatments imposed in this study. The proportion of nonacylated cyanidin glucosides was reported to decrease with shading while the proportion of acylated cyanidin glucosides increased (Gao and Cahoon 1994). Increased light exposure led to a decreasing proportion of coumaroyl derivatives in the fruit (Haselgrove et al. 2000). However, our results were not consistent with these findings.
There is agreement in the literature that higher temperature rather than light results in a shift toward coumaroylated anthocyanins, and that higher temperature results in decreased total anthocyanins (Downey et al. 2004, Spayd et al. 2002). Although we saw no shift in coumaroylated anthocyanins in 2014, a warmer year than 2013, the TSA was lower in 2014. There was a 25% decrease in TSA in the no removal treatment in 2013 and 2014. This treatment had less than 15% of the ambient PAR transmitted to fruit zone in both years and at least one more leaf layer than the leaf removal treatments. The difference came in the ambient temperature: 2014 had ten more days above 32°C than 2013. This corroborates the finding that two systems are required to regulate anthocyanin accumulation (Downey et al. 2004). An initial, constitutive system generated the base level of anthocyanins and an inducible system that required increased light into the fruit zone affected the hydroxylation pattern of anthocyanins. The results presented here provide evidence that the effect of prebloom leaf removal and RDI are to increase the proportion of malvidin, petunidin, and delphinidin glucosides relative to cyanidin and peonidin glucosides (Castellarin et al. 2007, Downey et al. 2004). Furthermore, in a hot climate, when clusters are exposed to ambient temperatures above 32°C for over 50 days during the growing season, the contribution of malvidin glucosides increased by 10%. Conversely, over the course of the season in the hot climate, increasing the irrigation amount with SDI by even 0.34 to 0.48 ML over RDI also shifted the hydroxylation pattern of anthocyanins from tri- to di-hydroxylated anthocyanins.
The ability to reduce the labor operation costs necessary to grow one unit of TSA by 35% in a hot climate through the treatments described without decreasing yield is a significant finding. Ultimately, growers in this region do not have to sacrifice yield to increase anthocyanin concentration in berry skin. Furthermore, being able to achieve a desired result consistently and in a timely manner with the aid of mechanization, while simultaneously saving irrigation water in a hot climate, is also attractive to growers in this region.
Conclusions
In the hot climate of the SJV of California, labor and water are limiting factors. Growers are paid by the ton and receive the lowest price per ton for red winegrapes due in part to low anthocyanin accumulation in berries. In this two-year study, we identified various mechanisms which contribute to the synergistic effect that leaf removal and applied water amounts had on both TSA concentration and anthocyanidin proportion. These included increased skin mass in response to early exposure of the flower cluster infructescence to at least 20% of ambient PAR with prebloom leaf removal and increased TSA concentration with a shift in composition toward tri-hydroxylated anthocyanins. This may enable growers to shift from di- to tri-hydroxylated anthocyanins based on the amount of irrigation applied and phenological stage of berry. Since there was no decrease in yield and a proportionally preferred increase in the TSA of Merlot, these management practices have the potential to greatly benefit growers in the SJV.
Acknowledgments
This study was funded in part by the American Vineyard Foundation, Bronco Wine Company Research Chair Trust Funds, and the California State University Agriculture Research Initiative. A graduate student stipend was provided to Michael G. Cook by the American Society of Enology and Viticulture. The authors also acknowledge West Coast Grape Farming Inc., Junior Robles, Geoffrey Dervishian, Kerry Fitzgerald, and Tiffany Gunduz for technical assistance during the execution of this trial.
- Received January 2015.
- Revision received March 2015.
- Revision received April 2015.
- Accepted April 2015.
- Published online July 2015
- ©2015 by the American Society for Enology and Viticulture
Literature Cited
Vol 66 Issue 3


Jump to section
Related Articles
Cited By...
More from this TOC section
Similar Articles
