


Abstract
Grapevine red blotch virus (GRBV) negatively impacts vine physiology and fruit quality in Vitis vinifera L. by reducing photosynthetic rate, total soluble solids (TSS), and berry anthocyanin concentration. Currently, growers have few management strategies beyond removal of infected vines, which may be particularly costly in vineyards with high disease incidence. The present study was established in 2018 in a GRBV-infected Pinot noir vineyard in southern Oregon to investigate whether reducing vine stress with cultural practices could dampen the impact of the disease on vine physiology and fruit quality. The effects of control and supplemental levels of irrigation and fertilizer on vine growth and physiology, disease severity, and fruit composition were observed over three years. Supplemental irrigation affected vine physiology and fruit composition in 2019 and 2020, but fertilization had no significant effect over three years. Photosynthetic rate, vegetative growth, vine yield, berry weight, TSS, and titratable acidity were increased with supplemental irrigation while disease severity (symptomatic leaves per vine) was reduced. Supplemental irrigation did not have consistent effects on secondary metabolites, though an increase in anthocyanin concentration was observed in 2020 despite an increase in berry size. Irrespective of applied water amounts, maintaining a higher vine water status effectively increased photosynthesis and canopy size, which resulted in greater sugar accumulation. Ultimately, these results suggest that maintaining a high vine water status (Ψstem > -0.8 MPa) may mitigate some of the negative effects of GRBV on vine physiology and fruit composition.
Grape production, which ranks first among both fruit crop production and value in the United States, faces considerable threats from a variety of pathogens and diseases (United States Department of Agriculture 2018). For example, grapevine leafroll disease (GLRD) has caused substantial economic loss by reducing yield, fruit quality, and value of the crop (Maree et al. 2013). Grapevine red blotch disease (GRBD) is a viral disease with symptoms resembling GLRD that has only recently come to the attention of the winegrape industry (Sudarshana et al. 2015). GRBD was first observed in 2008 at the University of California Oakville Experimental Vineyard in grapevines marked by leaf reddening and incomplete berry ripening (Calvi 2011). Subsequent early research related to GRBV has reported on virus detection methods (Krenz et al. 2014, Al Rwahnih et al. 2015, Perry et al. 2016) and disease epidemiology and vector identification (Krenz et al. 2014, Cieniewicz et al. 2018, Dalton et al. 2019). Later, more recent efforts have documented impacts of GRBV on vine physiology (Blanco-Ulate et al. 2017, Martínez-Lüscher et al. 2019, Bowen et al. 2020, Levin and KC 2020) and reduced fruit and wine quality (Girardello et al. 2019).
GRBD compromises grapevine health and berry ripening, resulting in reduced sugar accumulation and anthocyanin concentration that negatively impact wine quality (Girardello et al. 2020). Decreases in photosynthesis and carbon translocation during ripening have been hypothesized to cause the reduction in total soluble solids (TSS; Martínez-Lüscher et al. 2019). The economic cost of GRBD has been estimated to be from $2213/ha up to $68,548/ha based on assumed price penalties for lower quality fruit from infected vines (Ricketts et al. 2017). However, further study into disease management is necessary to offer solutions for growers, on whom the financial burden disproportionately falls. To date, only deficit irrigation has been thoroughly evaluated as a cultural practice to manage the disease beyond replacement of infected vines, but it actually proved to exacerbate the negative impacts of the virus (Levin and KC 2020). Vineyard floor management targeting insect vectors has recently been proposed but is limited by the understanding of vectored transmission of GRBV (Bick et al. 2020).
The impacts of GRBV on vine physiology may inform potential strategies for mitigating the impact of GRBV on vine health and fruit quality. Levin and KC (2020) demonstrated that deficit irrigation, a common vineyard practice, exacerbates the impact of the virus on vine physiology and fruit composition, so avoiding vine water stress may prove more appropriate for virus-infected vines. Supplemental irrigation positively influences potassium uptake both in the absence and presence of applied potassium fertilizer in healthy vines (Sipiora et al. 2005). Potassium is critical for proper berry ripening and—more specifically—phloem loading, the reduction of which is potentially related to low soluble solids in fruit from GRBV-infected vines (Rogiers et al. 2017).
The present study evaluates the efficacy of cultural practices—namely irrigation and fertilizer—to mitigate the effects of GRBD on vine physiology and fruit composition and test the hypothesis that increasing water and fertilizer inputs may reduce vine stress and the impact of the disease. The results of this study have the potential to inform vineyard management of GRBD and provide a more economical alternative to removal of infected vines.
Materials and Methods
Vineyard site. This study was conducted in a commercial vineyard block of Vitis vinifera L. cv. Pinot noir (clone 777) located in the Rogue Valley AVA near Ashland, Oregon (42.19´N; 122.70´W; 640 m asl). The study plot (0.8 ha) was composed predominantly of Carney series clay soil with 5 to 20% slopes facing southwest. Soils were a fine, smectitic, mesic Udic Haploxerert. Vines were grafted on 3309 Couderc (V. riparia × V. rupestris) rootstock and planted in 2015. Rows are oriented NNW-SSE with a row spacing of 2.75 m, vine spacing of 1.22 m, and vine density of 2990 vines/ha. Vines were head-trained and cane-pruned to double Guyot with two 0.6 m canes of six to eight buds each (12 to 16 buds per vine). Foliage was supported on a vertically shoot-positioned (VSP) trellising system consisting of a fruiting wire at 0.9 m above the soil surface and three pairs of catch wires at ~1.2, 1.5, and 1.8 m above the soil surface. Pest, disease, canopy, and crop load management were conducted according to regional industry standards.
Treatments and experimental design. Treatments consisted of factorial combination of grower control (CON) and supplemental (SUPP) irrigation and fertilizer (2 × 2). Supplemental treatments received twice the amount of irrigation or fertilizer as the grower control. The four experimental treatments were arranged in a randomized complete block design with four replications. Each replicate comprised one row and treatments were imposed down the entire row. Three vines per replicate were subsampled and the means of these subsamples were used for statistical analysis.
Climate data. Maximum and minimum air temperature, daily precipitation, and solar radiation data for 2018 were accessed from the Medford, OR, AgriMet Weather Station (42.33´N; 122.93´W). Data in 2019 and 2020 were obtained from the Oregon IPM Center’s Online Phenology and Degree-day Models tool (http://uspest.org/dd/model_app) using a weather station ~7 km from the study site.
Irrigation and fertilizer. Reference evapotranspiration (ETo) was obtained from the Medford, OR, AgriMet Weather Station (42.33´N; 122.93´°W). Crop coefficient (Kc) was calculated based on accumulated growing degree days (GDD; base 10°C) from 1 April using the following VSP-specific equation developed by Williams (2014) and adjusted for 2.75 m row spacing:

Grower control irrigation treatments had two 2 L/hr emitters per vine, and supplemental irrigation treatments had four 2 L/hr emitters per vine. Irrigation was scheduled by the grower and quantified using in-line water meters. Fertilizer was delivered via drip line on two dates preveraison and one postveraison each year. The preveraison applications utilized a 10-2-5 (N-P-K) formula, while the postveraison application utilized a 5-1.5-14 formula.
GRBV status. Vines were surveyed for symptoms of GRBD in 2017 and were tested for GRBV infection in early 2018. The primer pairs CPfor/CPrev and Repfor/Reprev were used following the protocol of Krenz et al. (2014) for PCR-based diagnosis of GRBV with 16Sfor/16Srev used as an internal grapevine control. Originally, the treatments were intended to be replicated across GRBV-positive and GRBV-negative vines, but all data vines that tested negative for GRBV in spring 2018 retested positive in fall 2018 and were subsequently excluded from the study. The high incidence of GRBV symptoms (>97%) at the vineyard site along with prohibitive costs of additional testing precluded the identification and selection of replacement GRBV-negative data vines.
Vine water and nutrient status. Stem water potential (Ψstem) was measured throughout the 2019 and 2020 seasons to determine the effect of irrigation treatments on vine water status. Fully expanded photosynthetically mature leaves were covered with a foil bag for at least 30 min prior to determining Ψstem with a pressure chamber (Model 615, PMS Instruments). Vine water status measurements were made on sunny days between 1300 and 1500 hr. Data are presented as means averaged across the treatment period—from treatment imposition to harvest—and reflect three sampling dates in 2019 and four sampling dates in 2020.
Leaf samples were taken for tissue nutrient analysis at both fruit set and veraison in 2019, but only at veraison in 2020. Each sample consisted of one representative leaf from each data vine aggregated per replicate. Samples were collected, dried, and immediately sent to the Oregon State University Central Analytical Lab (Corvallis, OR) for analysis.
Disease severity. The severity of GRBD symptom expression was quantified at harvest each year. Severity was estimated as the percent of symptomatic (interveinal reddening) leaves per vine at harvest. The Horsfall-Barratt scale was used to convert percentages to midpoint percentage values, which were ultimately used for analysis (Horsfall and Barratt 1945).
Canopy growth. Leaf area data were collected only in 2020 one week prior to veraison and then three weeks postveraison. Total vine leaf area was determined as in Williams et al. (2003) with minor modifications. The quantification consisted briefly of harvesting shoots from non-data vines, quantifying leaf area per unit shoot length per treatment group using a benchtop leaf area meter (LI-3100C, LI-COR Biosciences), and then using shoot count and length measurements from data vines to estimate total vine leaf area in data vines. Pruning weights and number of canes were recorded for each vine at the time of pruning in all three years.
Leaf gas exchange. Leaf gas exchange was measured with a portable photosynthesis system (LI-6400XT, LI-COR Biosciences) on one leaf per replicate on several dates in both 2019 and 2020. Data were obtained between 1100 and 1400 hr on leaves similar to those used for water status determination. Chamber relative humidity and temperature were set to match ambient conditions. Flow rate was set at 400 µmol/sec, chamber CO2 concentration was set in the reference cell at 400 µmol/mol, and irradiance was set at 2000 µmol/m2/sec. Analyzers were matched every 30 min.
Yield and fruit composition. Total vine yield and cluster number per vine were recorded in the field at harvest each year, and average berry mass was determined in the lab following harvest. Berries per cluster and cluster mass were calculated from the measured variables.
Primary and secondary fruit composition were determined at harvest each year. Samples consisted of 60 berries per replicate (20 berries per data vine), and subsamples of 20 berries were stored at -20°C for later phenolic analysis. The remaining berries were juiced by hand and centrifuged at 15,000 × g for 5 min. TSS was determined using a handheld digital refractometer (AR200, Reichert Analytical Instruments). Sugar per berry was estimated as the product of TSS and berry mass as in Krasnow et al. (2009). Juice pH was measured using a benchtop pH meter (Orion 3-Star, Thermo Fisher Scientific). Titratable acidity (TA) was measured by titration with 0.1 N NaOH using an autotitrator (T50, Mettler Toledo).
The 20-berry subsamples were thawed, peeled, sorted into skin and seed fractions, dried, and extracted in 70% acetone for 24 hr on an orbital shaker (VWR) at 100 rpm. Acetone was removed from skin and seed extracts (Syncore Analyst Polyvap, BUCHI Corporation). Tannins, iron-reactive phenolics (IRPs), and anthocyanins were then quantified from the skin and seed extracts using the Harbertson-Adams assay (Harbertson et al. 2002, 2015, Heredia et al. 2006). Quantities of each phenolic class were divided either by berry mass or number of berries per sample to obtain values of concentration (mg/g) or content (mg/berry), respectively.
Winemaking. In 2019 and 2020, fruit harvested from data vines was pooled per treatment and vinified using a modified protocol from Sampaio et al. (2007). Briefly, fruit was crushed, destemmed, sulfured to 30 mg/L, and allowed to macerate at ~5°C for 72 hrs. Must was then warmed to room temperature, divided into three fermentation replicates per treatment, inoculated with 1.5 g Lalvin RC212 yeast (Lallemand), punched down twice daily, and allowed to ferment until dry. Wines were then pressed with a Speidel bladder press for 5 min at 2 bars, inoculated with Lalvin MBR-31 (Lallemand) strain of Oenococcus oeni, stored at ~19°C, and sulfured to 25 mg/L free SO2 once malolactic conversion was complete. Samples were then drawn for analysis of tannins, iron-reactive phenolics, and anthocyanins following the same procedure as the berry extracts.
Statistical analysis. All statistical analyses were conducted and figures generated using R statistical software (v. 4.0.3; www.R-project.org). Data associated with vine water status, gas exchange, disease severity, vegetative growth, yield, fruit composition, and wine composition were analyzed with a three-way Type III analysis of variance for randomized complete block design and split-plot factorial treatment structure using the lmerTest package (v. 3.1.3; Kuznetsova et al. 2020) with the Kenward-Roger approximation of degrees of freedom. The main plots consisted of the 2 × 2 factorial combination of experimental treatments, and the split-plots were years. Means were generated and compared using the emmeans package (v. 1.5.2.1; Lenth et al. 2020) with the Tukey-Kramer adjustment method for multiple comparisons. Transformation of data due to heteroscedastic variance was conducted when required, and presented data are backtransformed. Nonlinear regression analyses of sugar per berry on various predictors were conducted using the following asymptotic function:

where Asym is the parameter representing the horizontal asymptote when sugar per berry was maximum, R0 is the parameter representing the predicted sugar per berry when x = 0, and lrc is the parameter representing the natural logarithm of the rate constant. Initial parameter estimates were obtained using SSasymp(), and data were fit using nls(), both functions from the R base package stats. Because R2 is invalid for assessing nonlinear regression fit, absolute strength of each model fit was assessed using the model residual standard error. Relative strength of model fits across predictors were tested using Akaike’s Information Criterion (AIC; Akaike 1974). Figures were generated using the ggplot2 package (v. 3.3.2; Wickham et al. 2020).
Results
Environmental conditions, vine phenology, and treatment imposition. Variability in environmental conditions at the study site among years was mainly due to differences in precipitation (Supplemental Table 1). 2018 was characterized by less precipitation both during the growing season and the prior dormant period and higher GDD accumulation compared to 2019 and 2020. The latter two years were milder with respect to both higher dormant and growing season precipitation and lower seasonal GDD accumulation.
Phenological dates were largely similar in all three years of the study. Budbreak was observed on 23, 16, and 16 April in 2018, 2019, and 2020, respectively. Bloom was determined on 3, 6, and 2 June in 2018, 2019, and 2020, respectively, and veraison was determined on 10, 7, and 7 Aug in 2018, 2019, and 2020, respectively. Harvest dates were slightly more variable than other phenological events—fruit was harvested on 1, 9, and 19 Oct in 2018, 2019, and 2020, respectively, following direction from the winery. Phenology by date and GDD accumulation may be referenced in Supplemental Table 2.
Total irrigation amounts were similar in 2018 and 2020, but approximately double in 2019 (Supplemental Table 1). Irrigation treatments commenced on 5 July, 12 June, and 2 June in 2018, 2019, and 2020, respectively. Considering the combination of applied irrigation and growing season precipitation, the water supply in 2019 was likewise much greater than in 2018 or 2020. Fertilizer treatments were applied on 27 June, 2 Aug, and 28 Aug in 2018; 9 July, 1 Aug, and 12 Sept in 2019; and 30 June and 7 Aug in 2020. Applied fertilizer quantities may be referenced in Supplemental Table 3. Fertilizer had no impact on vine macronutrient status in 2019, and only a slight influence on petiole K concentration in 2020 (Supplemental Table 4). Potassium was deficient (<0.7%) in leaf blades for all treatment groups in 2019 and 2020. Petiole potassium was slightly increased (+0.2 to 0.3%) with supplemental fertilizer and irrigation in 2020. Supplemental irrigation did slightly improve phosphorus status in both years, though phosphorus concentrations were within the healthy range for all treatment groups in both years (≥0.17% in blades and ≥0.12% in petioles).
Vine water status and leaf gas exchange. Vine water status was on average higher in 2019 than in 2020, though there was a significant effect of irrigation treatment on Ψstem in both years (Table 1). SUPP irrigation increased Ψstem by 0.40 MPa in 2019 and by 0.23 MPa in 2020 (p < 0.001; Supplemental Figure 1). There was no influence of fertilizer treatment on vine water status.
Response of water status, photosynthetic rate, and stomatal conductance to treatments and year. Water status data are means ± one standard error (n = 4) from three and four sampling dates in 2019 and 2020, respectively, during the treatment period. Gas exchange data are means ± standard error (n = 4) for one and two sampling dates in 2019 and 2020, respectively.
Net carbon assimilation (Anet) and stomatal conductance (gs) were significantly increased by SUPP irrigation relative to the CON irrigation treatment (Table 1). Though the SUPP irrigation effect was initially observed prior to veraison, it was generally greater postveraison. For example, Anet increased by 12 and 44% preveraison and 48 and 63% postveraison in 2019 and 2020, respectively (Figure 1). Similarly, gs increased by 43 and 108% preveraison and 89 and 83% postveraison in 2019 and 2020, respectively. Independently, gas exchange was not significantly affected by fertilizer treatment.
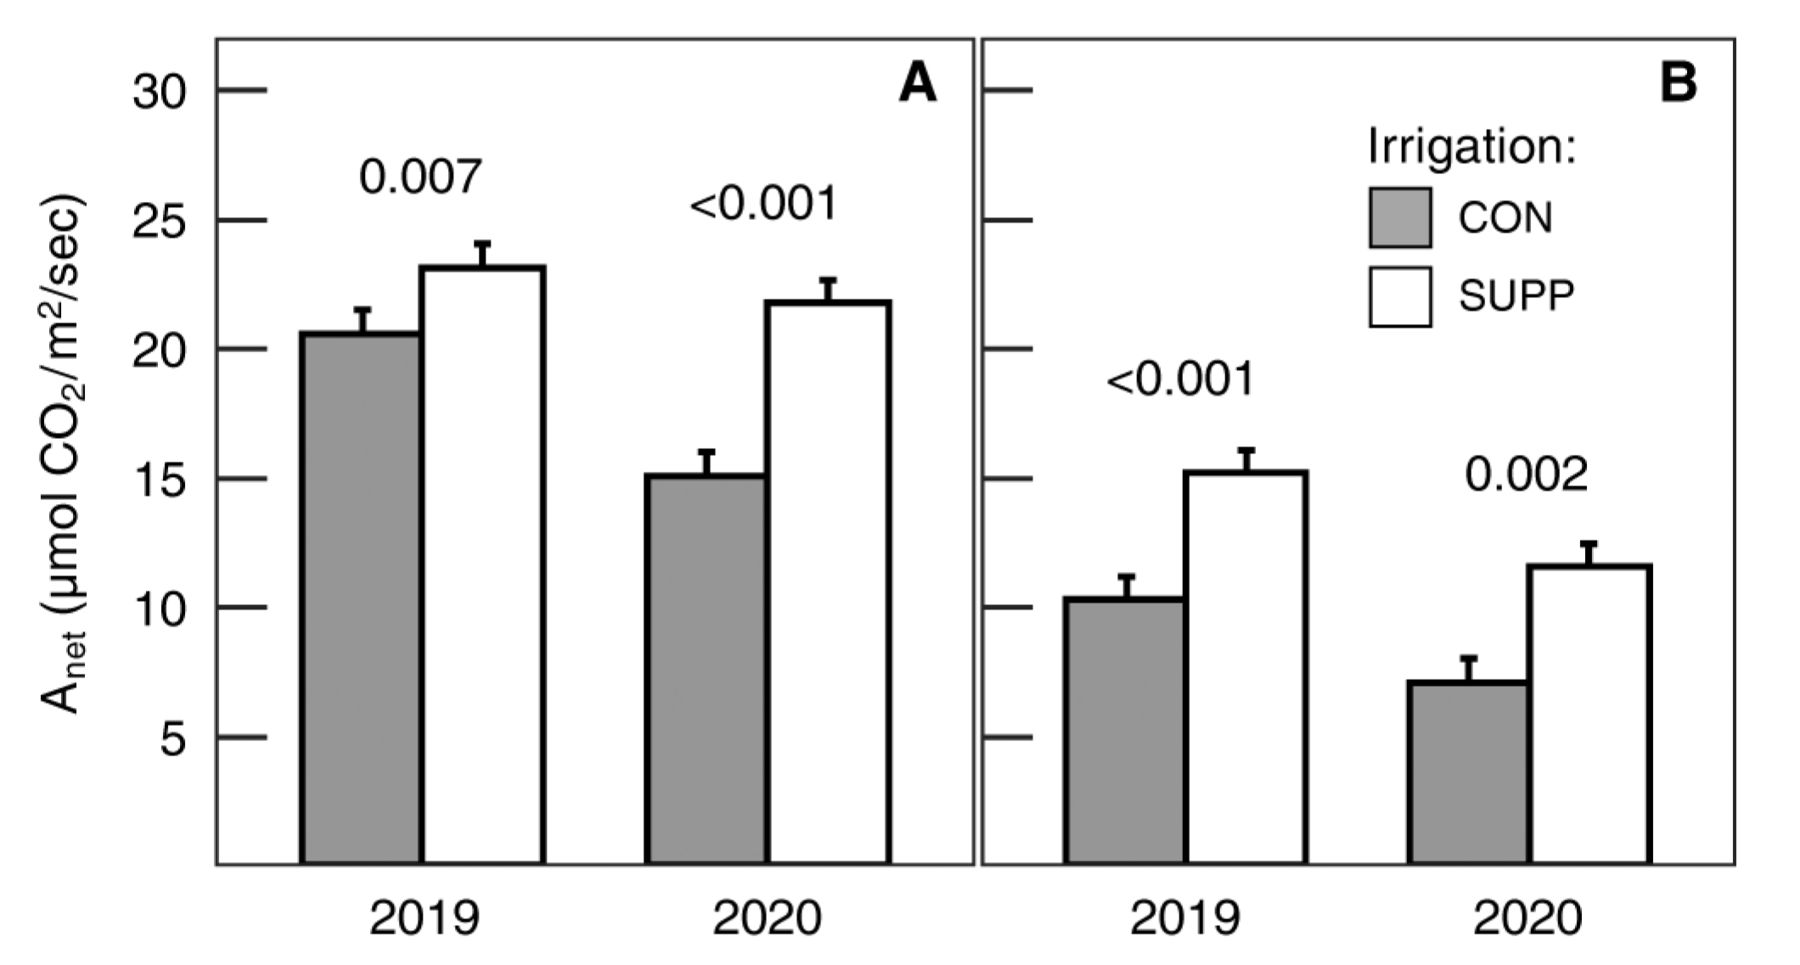
Response of photosynthesis to irrigation treatments preveraison (A) and postveraison (B). Data are means ± one standard error averaged across fertilizer treatments (n = 8). The p values in the figure reflect the contrasts between irrigation treatments within a given year. CON = Control (grower standard); SUPP = Supplemental (2× grower standard); Anet = net carbon assimilation.
Vegetative growth and disease severity. In general, pruning mass responded differentially to both SUPP irrigation and fertilizer treatments: SUPP irrigation slightly increased pruning mass, whereas SUPP fertilizer slightly reduced pruning mass (Table 2). However, the response of pruning mass to both irrigation and fertilizer depended on the year as indicated by the significant three-way interaction. Nevertheless, the responses of shoot mass and leaf area to irrigation level show that irrigation had a greater impact on vegetative growth compared to fertilizer.
Response of vegetative growth to treatments and year. Data are means ± one standard error (n = 4).
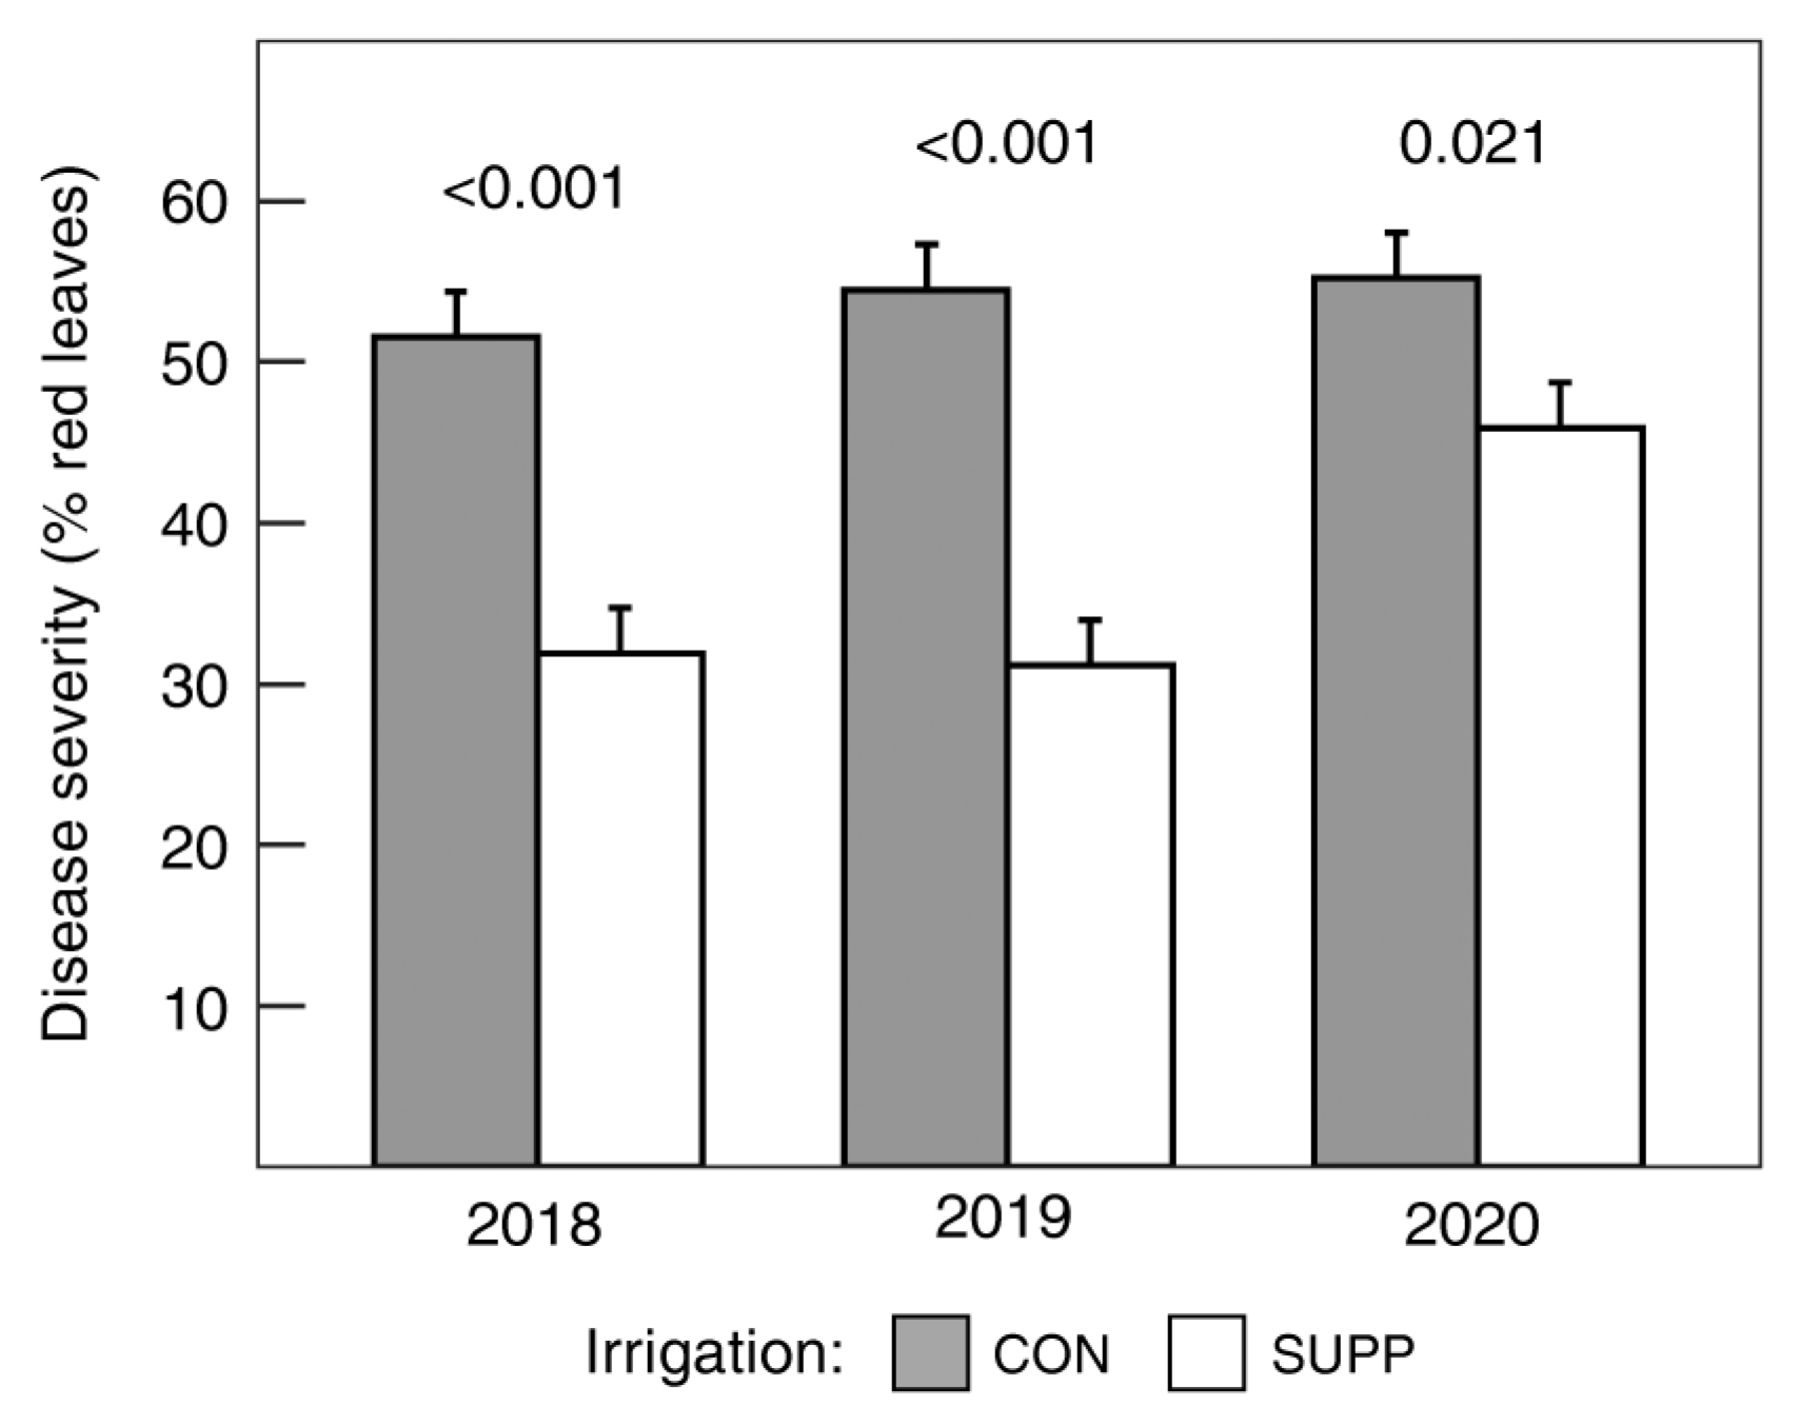
In all three years of the study, SUPP irrigation significantly reduced disease severity (p < 0.001), while SUPP fertilizer had no effect ( p = 0.464) (Figure 2). In 2020, when disease severity was multiplied by leaf area, the total area of symptomatic leaves comprised ~1.3 and 1.6 m2/vine for the CON and SUPP irrigation treatments, respectively. Yet, the SUPP irrigation treatment also resulted in a greater area of asymptomatic leaves: ~1.1 and 1.9 m2/vine of asymptomatic leaf area for the CON and SUPP irrigation treatments, respectively, in 2020.

Response of disease severity to irrigation treatments at harvest, estimated as percent symptomatic leaves per vine. Data are means ± one standard error averaged across fertilizer treatments (n = 8). The p values in the figure reflect the contrasts between irrigation treatments within a given year. CON = Control (grower standard); SUPP = Supplemental (2× grower standard).
Yield and yield components. In general, SUPP irrigation significantly increased vine yield, cluster number, cluster mass, and berry mass (Table 3). SUPP irrigation generally increased yield and yield component values, but the effect was much greater in 2018 and 2020. Yield increased by 26 and 63% with increased irrigation in 2018 and 2020, respectively, while the increase in 2019 was marginal at 4% (Supplemental Figure 2). Additionally, vine yield averaged across all treatments declined by 50% between 2018 and 2020. Berry mass was between 9 and 22% greater for SUPP irrigation in all three years of the study (Supplemental Figure 3). Fertilizer did not have any impact on yield or yield components in all three years of the study.
Response of yield and yield components at harvest to treatments and year. Data are means ± one standard error (n = 4).
Berry primary chemistry. At harvest, SUPP irrigation significantly increased TSS and sugar per berry in two out of three years and TA in all three years, while SUPP fertilizer had no effect on any variable in any year (Table 4). TSS was slightly lower with SUPP irrigation in 2018, but sugar per berry was nearly the same between irrigation treatments, which suggests that the impact of irrigation on TSS in 2018 was largely a consequence of increased berry fresh weight (FW). In 2019 and 2020, however, TSS and sugar per berry were both higher with SUPP irrigation. In all three years of the study, there was no pH response to all treatments. SUPP irrigation resulted in higher TA in all three years, suggesting that unlike sugar accumulation, the increased irrigation delayed the natural decline in acidity during ripening.
Response of primary berry chemistry at harvest to treatments and year. Data are means ± one standard error (n = 4).
The response of sugar per berry was modeled as a nonlinear function of other functional traits as predictors—Ψstem, Anet, pruning mass, and leaf area—that also increased with SUPP irrigation (Figure 3). The nonlinear relationships were well characterized by a four-parameter asymptotic regression function with predicted asymptotes of 0.263 to 0.271 g that corresponded to maximum sugar per berry. Of the three models with two years of data (Ψstem, Anet, and pruning mass; Figure 3A to 3C), residual standard error (RSE) was lowest for Ψstem (RSE = 0.0195, df = 29), followed by Anet (RSE = 0.0228, df = 29), and lastly pruning mass (RSE = 0.0250, df = 29). Model RSE for that using leaf area as a predictor (Figure 3D) was 0.0135 (df = 13). Using AIC to compare all models, the best fit model was that using Ψstem as the predictor variable, followed by Anet, pruning mass, and leaf area. From the fitted functions, key threshold values of Ψstem, Anet, pruning mass, and leaf area that corresponded to 90% of maximum sugar per berry were extracted. For example, 90% of maximum sugar per berry (0.238 g) coincided with Ψstem, Anet, and pruning mass values of approximately -0.8 MPa, 12.5 μmol CO2/m2/sec, and 0.8 kg/vine, respectively. For leaf area in 2020, significantly higher sugar per berry between irrigation treatments was observed at ~3.0 m2/vine.

Response of sugar per berry as a function of stem water potential (Ψstem) (A), net carbon assimilation (Anet) (B), pruning mass (C), and vine leaf area (D). Data are pooled from 2019 to 2020 and correspond to means averaged across fertilizer treatments. Ψstem data are averaged across the treatment period, from the commencement of irrigation to harvest. Anet and leaf area data are postveraison means. Leaf area data are only available for 2020 as plotted here using data from three weeks postveraison. Sugar per berry values as a function of Ψstem, Anet, pruning mass, and vine leaf area, respectively, were fit to the following asymptotic equations using nonlinear least squares:

Akaike’s Information Criterion values were -156, -146, -141, and -88 for Ψstem, Anet, pruning mass, and vine leaf area, respectively. CON = Control (grower standard); SUPP = Supplemental (2× grower standard).
Berry secondary metabolites. Similar to primary fruit composition, the impact of the treatments on berry secondary metabolites was mostly limited to irrigation (Table 5). Except for the interaction effect of irrigation and fertilizer on skin tannins—in which SUPP fertilizer decreased tannins with CON irrigation and increased tannins with SUPP irrigation—fertilizer had no significant impact on secondary fruit composition on a FW basis. Irrigation had a significant impact on the FW concentration of all secondary metabolites except for IRPs in seeds. Secondary metabolite contents per berry may be referenced in Supplemental Table 5. SUPP irrigation generally increased concentrations of skin IRPs, skin tannins, and seed tannins, though the effect varied by year.
Response of secondary fruit composition per unit fresh weight (FW) at harvest to treatments and year. Data are means ± one standard error (n = 4).
In 2018, the concentration (mg/g FW) and content (mg/berry) of anthocyanins were lower in fruit from the supplemental irrigation treatment. In 2019, both concentration and content of anthocyanins were not significantly different between irrigation treatments. In 2020, concentration was essentially the same but supplemental irrigation treatment increased anthocyanin content by 30%. This trend in anthocyanins correlates well with the response of sugar, demonstrated by the strong linear relationship between anthocyanin content and sugar per berry in 2019 to 2020 (R2 = 0.61, p < 0.001).
Wine chemistry. The concentration of secondary metabolites in the resulting wines yielded highly inconsistent results that did not significantly corroborate nor controvert the responses of secondary metabolites in berries (Supplemental Table 6). Interpretation of wine composition is further complicated by assumed differences in fermentation kinetics and extraction due to differing sugar and ethanol concentrations during fermentation. One noteworthy result was that supplemental irrigation did not significantly reduce wine anthocyanin concentration when averaged across fertilizer treatments.
Discussion
The present study was established to investigate whether reducing vine stress by increasing fertilizer and irrigation inputs could mitigate the impacts of GRBV on vine physiology and fruit composition. In the second and third years of the study, supplemental irrigation had positive impacts on gas exchange and canopy growth, which resulted in greater sugar accumulation at harvest. Elevated water status—the primary response to supplemental irrigation—improved the production and export of sugar, both of which have been hypothesized to be compromised by GRBV. The improvement in sugar accumulation in the third year was great enough to improve anthocyanin concentration despite a consistent increase in berry mass. The increase in yield is advantageous for growers but also indicates that absolute yield of sugar per vine was significantly increased in infected vines. Supplemental fertilizer proved to be ineffective, though this lack of response may have been a consequence of vines already having adequate mineral nutrition.
Irrigation improved carbon assimilation and translocation by elevating water status. Ultimately, the most significant result from this study was an improvement in TSS in fruit from vines that received supplemental irrigation. Studies of the impact of GRBV on vine physiology and fruit composition indicate that a reduction in TSS is the most consistent effect of the virus (Levin and KC 2020). Despite the fact that there were no non-infected vines in this study, there was nevertheless a significant increase in berry TSS of ~1 to 3 Brix in the SUPP irrigation vines. The Brix improvement observed in this study is within the range or greater than some reported reductions in TSS as a result of GRBV (Martínez-Lüscher et al. 2019, Levin and KC 2020). While berry TSS is a useful technological marker for important production decisions such as harvest, the amount of sugar per berry is perhaps more indicative of vine carbon metabolism and more directly demonstrates the overall impact of supplemental irrigation on vine physiology.
Several changes to vine physiology in response to supplemental irrigation likely contributed to an increase in sugar accumulation in the fruit: namely, increased rate of Anet and an increase in canopy size (pruning mass and leaf area). The impact of increased Anet directly counters the negative impact of GRBV on gas exchange and results in a greater pool of photosynthate for export toward ripening fruit. A larger canopy—initially inferred from pruning mass in 2018 and 2019 but corroborated in 2020 with leaf area measurements—provides more surface area for light interception and photosynthesis. This canopy-level effect is multiplicative when combined with higher observed leaf-level Anet. While these two changes would necessarily have increased the carbon pool, they cannot explain the mechanism for increased sugar export.
Reduced sugar export may actually drive the cascade of physiological changes in GRBV-infected vines. These include reductions in gas exchange and synthesis of anthocyanins in the leaves due to end-product accumulation of sugar and subsequent feedback inhibition of photosynthesis. The latter phenomenon has been described extensively in other plant systems (Paul and Pellny 2003, Das et al. 2011) and alluded to in GRBV-infected vines (Martínez-Lüscher et al. 2019). The coincidence of higher rates of carbon assimilation, reduced leaf reddening, and greater sugar accumulation as a result of increased irrigation suggests that the impact of GRBV on carbon export was overcome to some extent by the elevated vine water status in the present study.
The elevated water status may partially explain this increased export that cannot be accounted for by either Anet or increased canopy size. The pressure flow hypothesis introduced by Münch (1927) proposes that the rate of phloem sap movement is largely determined by the water potential gradient between the phloem sieve elements (lower Ψ) and the surrounding region (higher Ψ). Higher Ψstem may have increased this gradient, thus facilitating greater bulk flow of sugar toward the ripening fruit. Regardless of the mechanism by which elevated water status increased sugar export, it is likely the physiological linchpin for mitigating the impact of GRBV.
The impact of higher Ψstem on Anet could have been direct—by maintaining open stomata and thus increasing gas exchange—or indirect, by facilitating the export of sugar and preventing feedback inhibition of photosynthesis due to increased foliar sugar accumulation. It is worth noting as well that the response of gas exchange varied by year in accordance with water supply. The difference in gas exchange between SUPP and CON irrigation treatments was generally greater in 2020—except for postveraison gs—which is the year when applied irrigation and Ψstem were both overall lower. This also suggests that the impact of increasing irrigation on leaf gas exchange is more pronounced when vine water deficits are greater. The mechanisms by which elevated water status improves ripening in GRBV-infected vines remain to be investigated.
Improved sugar accumulation signals a concomitant increase in anthocyanin synthesis. One anticipated consequence of increased irrigation is increased berry size, which ultimately could dilute skin-associated phenolic compounds in wine. Indeed, irrigation consistently increased berry mass in the present study, but other impacts on berry physiology complicate the dilution effect. Due to the incomplete understanding of the impact of GRBV on non-anthocyanin phenolics, and the fact that non-anthocyanin phenolic compounds are largely synthesized prior to veraison, the impact of the treatments on anthocyanins was of primary concern in this study.
In ripening grape berries, sucrose has been established as both a signal and substrate for synthesis of anthocyanins (Pirie and Mullins 1976). Thus, the reduction in anthocyanins in GRBV-infected berries may be a direct consequence of reduced sugar accumulation. In 2018, supplemental irrigation did not improve sugar accumulation, and both sugar and anthocyanin levels were lower relative to the control irrigation treatment. There was a slight improvement to sugar accumulation in 2019 with supplemental irrigation, which ultimately increased anthocyanin content per berry slightly. Still, the concentration of anthocyanins per gram FW was slightly lower in 2019 due to greater berry mass. However, the anthocyanin concentrations of the wines made in 2019 were not significantly different between irrigation treatments. In 2020, the improvement in sugar accumulation as a result of supplemental irrigation was great enough to outpace the increase in berry mass with respect to anthocyanin concentration; both anthocyanin concentration (per gram FW) and content (per berry) were greater in 2020 when irrigation was doubled.
This result is significant from a practical winemaking perspective as well as for the understanding of GRBV on vine physiology. The correlation between berry anthocyanin content and sugar per berry suggests that 1) the relationship between berry sugar accumulation and anthocyanin biosynthesis is largely conserved in GRBV-infected vines, and 2) GRBV-induced anthocyanin reductions are likely caused directly by reductions to sugar accumulation. The hypothesis that sugar is central to many of the impacts of GRBV on vine physiology and fruit composition as described here is somewhat in conflict with the early work of Blanco-Ulate et al. (2017), which suggested that the impacts of GRBV are instead direct responses to altered transcription in the phenylpropanoid pathway. Future work integrating physiology with genomics may disentangle the true etiology of GRBV and associated symptoms.
Physiological measurements aid targeted irrigation of GRBV-infected vines. Absolute irrigation quantity did not appear to reliably predict or correlate with the irrigation treatment effect on sugar accumulation. The effect of irrigation on sugar accumulation was greater in 2020 than in 2019, though the irrigation quantity and total water supply were nearly double in 2019. Temporal distribution of irrigation may have influenced this as well, as 71 and 59% of irrigation was supplied preveraison and 29 and 41% supplied postveraison in 2019 and 2020, respectively. That is, a greater proportion of total irrigation was supplied during the ripening period in 2020. Although the data from the present study do not allow us to disentangle the effect of temporal distribution of irrigation any further, they raise the question about whether or not supplemental irrigation of—or rather maintenance of high vine water status in—GRBV-infected grapevines should be focused during the ripening period alone or season-long.
The relationships between sugar per berry and functional traits revealed physiological thresholds above which there was marginal improvement in sugar accumulation. These thresholds may assist growers in supplying enough water to support carbon assimilation and export without wasting water. In the years when a significant improvement of TSS was observed (2019 to 2020), the strongest relationship was observed between sugar per berry and Ψstem, which is a routine measurement for many growers. Sugar per berry saturated at Ψstem > -0.8 MPa, suggesting that maintaining vine water status above this threshold may maximize sugar accumulation in fruit from GRBV-infected vines. Vines with Ψstem values at or above -0.8 MPa are considered to be under weak to no water deficit (van Leeuwen et al. 2009). This corroborates recent work showing that water deficits do not improve fruit quality in GRBV-infected vines and also suggests that reducing vine water deficits may actually improve fruit quality (Levin and KC 2020). Anet, though correlating better with sugar per berry than pruning mass, is impractical to measure without expensive equipment. Still, the data presented suggest that sugar per berry saturated at average postveraison Anet values of 12.5 μmol CO2/m2/sec. Sugar per berry saturated at pruning mass values of 0.8 kg/vine, though the strong dependence of pruning mass on training/trellising system may preclude the utility of this threshold in vineyards of different design than that used in this study. Further, sugar per berry was better correlated to leaf area than pruning mass. As noted previously, significant differences in sugar per berry were observed when total vine leaf area was above ~3.0 m2, which corresponded to leaf area index values approaching 1.0. Finally, there was no relationship between sugar per berry and Ravaz index values.
Yield response to irrigation has implications for both production and physiology. The increase in yield was achieved with supplemental irrigation in all three years without a concomitant penalty on TSS, which is an obvious benefit to growers. The increase in fruit yield was multiplicative in all three years for the absolute yield of sugar per vine because there was a greater mass of fruit at the same or higher concentration of sugar. This demonstrates that supplemental irrigation has the potential to promote greater sugar accumulation in GRBV-infected vines even at higher yields relative to control irrigation. For production, this implies a greater quantity of fruit with greater TSS, while physiologically, the irrigation provides a benefit to sugar accumulation that supersedes source:sink limitations.
Fertilizer application influenced neither vine nutrient status nor fruit composition. The application of supplemental fertilizer in the present study was largely ineffective at mitigating the impacts of GRBV. The majority of plant nutrient values were sufficient, but K+ values reflected blade deficiencies for all treatment groups irrespective of fertilizer or irrigation treatment. It was hypothesized that increasing the supply of K+—which is critical for phloem loading of sugar—to the ripening fruit in GRBV-infected vines would enhance sugar loading and export, thereby mitigating the impact of GRBV on sugar translocation and accumulation in the fruit (Rogiers et al. 2017). The increase in petiole K+ status in 2020 with both supplemental fertilizer and irrigation corroborates reports that additional fertilizer and irrigation are critical to supplying K+ on clay soils (Sipiora et al. 2005). Despite these improvements to K+ status, values reflected a K+ deficiency for all treatment groups, largely explaining why the slight improvement to K+ status did not impact vine physiology or fruit composition.
The impact of water availability on GRBV-infected vines is likely exacerbated by soils like the smectitic clay in the present study, which have low plant-available water and whose minerology tends to strongly adsorb cations like K+, particularly at low moisture levels. The effectiveness of fertilizer and irrigation in improving K+ supply may have been improved by even greater amounts of fertilizer and water, but foliar K+ applications may potentially bypass problems with K+ uptake on dry, clay-heavy soils. Thus, postveraison foliar application of K+ to GRBV-infected vines may prove more efficacious than soil-applied fertilizer.
Conclusion
In addition to marked improvements in sugar accumulation, the effect of supplemental irrigation on infected vines provides new evidence that the impacts of GRBV on vine physiology and fruit composition comprise a cascade of responses to foliar sugar accumulation. The promising results of this study provide an alternative to vine replacement for growers who may wish to continue farming GRBV-infected vines and producing fruit of adequate quality. Contrary to the common practice of deficit irrigation in red wine grape production, it appears that increasing irrigation to maintain vines at low-to-no water deficit (Ψstem > -0.8 MPa) may have a more positive impact on vine physiology and fruit composition in GRBV-infected vines with the added benefit of increased yield.
Footnotes
Acknowledgments: The authors thank Dr. Achala KC for providing critical assistance related to early experimental design and grapevine viral pathology. Additionally, the authors thank Joseph DeShields, Ricky Clark, Christopher Jenkins, Carlee Wormington, and Claire Kirk for technical assistance related to data collection and laboratory work. The authors also thank Results Partners, LLC, and Belle Fiore Estate and Winery for their assistance with field plot maintenance and provision of the study site. This work was supported in part by the Oregon Wine Board (award number 2018-2223) and the USDA-NIFA-SCRI (grant number 2019-51181-30020). This work also served as partial satisfaction of the requirements for the completion of C. Copp’s Master’s thesis, which was generously supported by the Department of Horticulture at Oregon State University.
Supplemental data is freely available with the online version of this article at www.ajevonline.org.
By downloading and/or receiving this article, you agree to the Disclaimer of Warranties and Liability. The full statement of the Disclaimers is available at http://www.ajevonline.org/content/proprietary-rights-notice-ajev-online. If you do not agree to the Disclaimers, do not download and/or accept this article.
- Received March 2021.
- Revision received April 2021.
- Accepted April 2021.
- Published online October 2021
This is an open access article distributed under the CC BY license (https://creativecommons.org/licenses/by/4.0/).
Literature Cited
Vol 72 Issue 4


Jump to section
Related Articles
Cited By...
More from this TOC section
Similar Articles
