


Abstract
Cold climate interspecific hybrid grapevines (CCIHG) selected for their superior midwinter cold hardiness have expanded grape production to cold climate regions. However, extreme weather events, such as polar vortexes and the high frequency of fall and spring freezes, often result in yield and vine losses. The main objective of this study was to evaluate changes in bud cold hardiness of five CCIHG cultivars grown in the upper Midwest to identify relative risk for freeze damage throughout the dormant period and to adapt a bud cold hardiness prediction model to CCIHG cultivars grown in cold climate regions. Bud cold hardiness was evaluated biweekly throughout the dormant period by measuring lethal temperatures for buds using differential thermal analysis (DTA). CCIHG cultivars in our study had an early acclimation response with increased levels of cold hardiness before the occurrence of freezing temperatures. Maximum levels of hardiness (-28 to -30°C) were observed both years in February; however, deeper levels of freezing stress resistance, probably attained by freeze dehydration, were not detected using DTA. CCIHG cultivars had a rapid deacclimation response that was accelerated with additional chilling accumulation during spring. The reparametrizing of a discrete-dynamic cold hardiness prediction model by expanding the range of ecodormant threshold temperatures for CCIHG resulted in predictions with an average root mean square error (RMSE) = 1.01. Although CCIHG cultivars have superior midwinter bud cold hardiness, fast deacclimation responses increase the risk of freeze damage during spring, thus this trait should be evaluated for future CCIHG cultivar release. The development of tools such as the discrete-dynamic cold hardiness prediction model for CCIHG cultivars will aid growers in decision-making to minimize damage and yield and vine losses.
- differential thermal analysis
- explanatory model
- freezing stress resistance
- hybrid grapevine
- prediction model
Extreme low temperature is the most significant constraint for grape production in cold climate regions. Freeze injury to buds, canes, cordons, and trunks limits yields and increases production costs because of the additional retraining and replacing of damaged vines (Zabadal et al. 2007). Thus, grapevine genotypes with superior cold hardiness are essential for a successful viticulture industry in cold climate regions.
Cold climate interspecific hybrid grapevines (CCIHG) have genetic backgrounds that include Vitis aestivalis, V. labrusca, V. riparia, V. rupestris, and V. vinifera (Smiley and Cochran 2016, Atucha et al. 2018). The development of CCIHG cultivars has combined high fruit quality traits of V. vinifera with the superior midwinter cold hardiness traits found in wild Vitis species, which has propelled the development of a $539.2 million viticulture industry in cold climate regions such as the U.S. Midwest (Dami et al. 2005, Luby and Fennell 2006, Tuck et al. 2017). However, extreme and erratic weather events continue to result in substantial freeze damage to CCIHG and, in turn, economic losses. Some recent examples of devastating freezing events that led to unprecedented crop and vine losses include the Easter freeze of 2007, Mother’s Day freeze of 2010, the “killer frost” of 2012, and the polar vortex event of 2014 (Dami and Lewis 2014, Wisniewski et al. 2017). The Easter freeze of 2007 alone was estimated to be nearly $1 billion in economic losses to small fruit-crop growers, including grapes, across 21 states (Warmund et al. 2008). Most recently, in 2019, the polar vortex split, in which a portion of the polar vortex separated and traveled southward and resulted in record-setting cold temperatures in many cold climate regions of the United States (as found on the website https://www.ncdc.noaa.gov/). The economic consequences of these extreme weather events highlight the need for more information on CCIHG cold hardiness dynamics to more specifically identify i) periods of high risk, ii) the extent of variability among CCIHG cultivars, and iii) potential risk-mitigation practices.
Previous studies have described a U-shaped pattern of grapevine bud cold hardiness that spans the duration of the dormant period (Mills et al. 2006, Ferguson et al. 2011, 2014, Londo and Kovaleski 2017). This pattern begins with acclimation (gain of cold hardiness) in the fall, continues with maintenance of cold hardiness throughout the winter, and ends with deacclimation (loss of cold hardiness) in the spring. While this general pattern of seasonal response has been described extensively, there is substantial variability in grapevine cold hardiness across years, genotypes, climates, and cultural practices (Pierquet and Stushnoff 1980, Williams et al. 1994, Ferguson et al. 2014, Grant and Dami 2015, Londo and Kovaleski 2017). The use of explanatory models, such as the one developed by Londo and Kovaleski (2017), characterizes the relationship between cold hardiness and temperature fluctuations during the dormant season by genotype.
While characterizing grapevine cold hardiness changes in response to temperature fluctuations across the dormant period is critical to understand how genotypes will behave in different growing conditions, the need for information on short-term changes in cold hardiness is critical for protection decision-making by growers. However, routine assessment of bud cold hardiness is a time-intensive process that requires specialized equipment. One approach to this is the use of discrete-dynamic modeling where continuous changes to a system are modeled using arbitrary incremental time steps, such as hours, days, etc. A discrete-dynamic model developed by Ferguson et al. (2011, 2014) predicts daily changes of cold hardiness for 21 V. vinifera cultivars and two V. labrusca cultivars using daily maximum and minimum temperatures and cultivar-specific parameters. However, this model was developed using cold hardiness data collected in Washington State from primarily V. vinifera genotypes. Therefore, to extend its utility to CCIHG and the cold climate regions where they are mostly grown, this model must be reparametrized for these genotypes and evaluated using cold hardiness data collected in these additional relevant growing regions.
The main objective of this study is to evaluate changes in bud cold hardiness of five CCIHG cultivars to identify relative risk for freeze damage throughout the dormant period. The secondary objective is to optimize and evaluate a bud cold hardiness prediction model for these five CCIHG cultivars grown in a cold climate region with the same two-year data set. This information will contribute to cultivar selection for particular regions and inform designs for future research into the physiological and mechanistic processes of grapevine cold hardiness. In addition, this work will promote the testing and refinement of predictive models with independent sets of data and will strengthen grapevine bud cold hardiness protection decision-making in cold climate regions.
Materials and Methods
Site description. This study was conducted over two winters, 2017 to 2018 (Year 1) and 2018 to 2019 (Year 2), in a vineyard at the West Madison Agricultural Research Station in Verona, Wisconsin (43°03′N; 89°31′W). The vineyard is in the U.S. Department of Agriculture Plant Hardiness Zone 5a (as found on the website https://planthardiness.ars.usda.gov/), and has deep silt Griswold loam soil with 2 to 6% slopes (as found on the website https://websoilsurvey.sc.egov.usda.gov/App/WebSoilSurvey.aspx).
Vineyard design and vine material. The vineyard was established with one-year-old bare root vines. In 2008, Brianna (BR), Frontenac (FR), La Crescent (LC), and Marquette (MQ) were planted and grown on a vertical shoot-positioned trellis system with double trunks trained into unilateral cordons 1 m aboveground. In 2011, Petite Pearl (PP) was planted and trained to a high cordon trellis system with double trunks trained into unilateral cordons 1.5 m aboveground. All vines were spur pruned to ~45 nodes per vine, and all cultivars were thinned to 20 shoots per meter-length of trellis. The vineyard is arranged as a randomized complete block design with four replications. Each block includes two rows of vines with six, four-vine panels per row. At the time of the study, seven of the 12 panels within each block contained cultivars that were not included in this study. Rows are oriented north-south with 3.4 m between rows and 2.1 m between vines for a total density of 1398 vines/ha (566 vines/acre).
Weather data. Hourly average, daily maximum, and daily minimum air temperature data were collected from 1 Sept to 30 April using a Network for Environment and Weather Applications (as found on the website http://www.newa.cornell.edu/) participating station (Model MK-III SP running IP-100 software; Rainwise) located onsite, 2 m aboveground level (43°3′N; 89°32′W, and elevation at 330 m).
Bud collection. Buds were collected in the morning using similar methods as described in Mills et al. (2006), Ferguson et al. (2014) and Londo and Kovaleski (2017). Buds from node positions four to seven were sampled (four buds per vine) from canes with green phloem and xylem. Buds were sampled biweekly, across vineyard blocks and vines within blocks (from a total of 16 vines). There were 15 and 14 sampling times in Year 1 and Year 2, respectively. Canes were cut several centimeters away from the bud. Buds were collected in plastic bags, stored on ice during transportation, and processed immediately upon returning to the lab.
Differential thermal analysis (DTA). The DTA equipment used in this study was the same as described by Villouta et al. (2020). Thermoelectric modules (TEMs) (model HP-127-1.4-1.5-74 and model SP-254-1.0-1.3, TE Technology) were used to detect freezing exothermic reactions. TEMs were placed in individual, hinged, tin-plated steel containers lined with 5 mm thick open-cell foam pieces to reduce effects of freezing chamber air turbulence. Eleven TEM units were evenly spaced and attached to each of four 30 × 30 cm perforated aluminum sheet pieces (hereafter called “trays”) with the leads of each tray wired to a single 24-pin D-sub connector. A copper-constantan (Type T) thermocouple (22 AWG [American Wire Gauge]) was positioned on each tray to monitor temperature in proximity to the TEM units. Trays were positioned vertically in a Tenney Model T2C programmable freezing chamber (Thermal Product Solutions) and connected to a Keithley 2700-DAQ-40 multimeter data acquisition system (Keithley Instruments). TEM voltage and thermocouple temperature readings were collected at 6-sec intervals via a Keithley add-in in Microsoft Excel (Microsoft Corp.). The effect of freezing chamber fan turbulence on the TEM units was minimized by covering trays with 13 mm open-cell foam sheets and by installing a removable piece of perforated, corrugated cardboard across the top of the chamber’s interior to function as a damper.
To prepare samples for DTA, nodes were pruned out of the canes. Buds, including the bud cushion, were excised from the node using a razor blade. Five buds were arranged with the cut surface up (i.e., bud on the bottom) on a small piece of aluminum foil (Reynolds Consumer Products). Cut surfaces of the buds were covered with a piece of moistened Kimwipe disposable wipe (Kimberly Clark) to provide an extrinsic ice nucleator source and to prevent dehydration prior to bud freezing. The aluminum foil was folded into a packet containing the five buds. Each single aluminum foil packet was randomly assigned to a TEM chamber.
The DTA protocol used a temperature ramp from room temperature to 4°C over 1 hr, a 1-hr hold, ramp to 0°C over 1 hr, a 1-hr hold, ramp to -44°C over 11 hrs, a 30-min hold, and then a finishing ramp back to 4°C over 2 hrs. The resulting cooling rate was -0.067°C/min (or -4°C/hr). One TEM chamber on each tray was left empty to document baseline background electrical noise. Heat was released with the freezing of each supercooled meristem in the grape compound bud; this release is referred to as a “low temperature exotherm” (LTE). A single compound grapevine bud contains primary, secondary, and tertiary meristems. In this experimental setup, a TEM will occasionally record a large peak followed by one or two smaller peaks. The larger peak relates to the freezing of the primary meristem, while the smaller peaks correspond to the freezing of the secondary and tertiary meristems, a reflection of their smaller size and lower water content. Frequently, these peaks are undiscernible. In a given set of DTA run results, up to five bud LTEs were identified and documented for each TEM, corresponding to the freezing of the primary meristems. As only obvious peaks were identified in this way, occasionally fewer than five peaks were documented for some TEMs.
In Year 1, DTA was performed biweekly from 2 Nov to 30 April (40 buds per sampling date per cultivar) for a total of 15 times. In Year 2, DTA was performed biweekly from 26 Sept to 16 April (30 buds per sampling date per cultivar) for a total 14 times.
Additional DTA runs were performed as part of a temperature conditioning experiment following an extreme cold weather event in late January 2019. Buds were sampled from all cultivars (16 buds per cultivar) on 12 Feb 2019, less than two weeks after the extreme low temperatures. Excised and prepared buds were conditioned in the TEM chambers. The protocol used a temperature ramp from room temperature to 4°C over 1 hr, a 1-hr hold, ramp to 0°C over 1 hr, a 1-hr hold, ramp to -33°C over 33 hrs (-1°C/hr), a 30-min hold, a ramp to -10°C over 6 hrs, ramp to 0°C over 5 hrs, ramp to 4°C over 2 hrs. A freezing experiment was then started with the standard DTA protocol, which cools to a minimum of -44°C.
Visual bud injury evaluation. Following the extreme cold weather event in January 2019, an additional collection of buds was dissected while visually evaluating freeze injury using an Olympus SZX12 microscope with a 1× objective (Olympus Optical Company). Forty buds for each cultivar were collected following the same protocol as for DTA. Before dissection, buds were incubated in sealed plastic bags on ice for 24 hrs, then at 4°C for 24 hrs, and finally at room temperature for 24 hrs. Sequential cross sections were cut from the buds with a double-edged razor blade until meristems were visible for evaluation. Freezing injury was assessed for primary and secondary meristems in each bud. Oxidative browning (Goffinet 2004) was rated as present (injured) or absent (not injured).
Statistics. For each DTA run, the temperatures at which 10, 50, and 90% of the buds froze were determined and referred to respectively as the LT10, LT50, and LT90 temperatures. Two models were developed in R (ver. 3.5.2, R Foundation for Statistical Computing), an explanatory regression model (Londo and Kovaleski 2017) and a predictive discrete-dynamic model (Ferguson et al. 2011, 2014). Symbols and abbreviations used for each model are listed in Table 1. Data from both years of the study were used in the evaluation of each model (more detail below).
Symbols, abbreviations, and units of measurement used in explanatory and predictive models.
Explanatory model. An explanatory linear regression model was created in R using multiple linear regression and a model selection process based on Londo and Kovaleski (2017). The model was used to determine significant differences among cultivars’ seasonal bud cold hardiness and their relative responsiveness to temperature fluctuations and time. The explanatory variables used were Cultivar, Time, Time2, Year, and a temperature index (σT). The Cultivar parameter was included as a categorical variable. Time and Time2 were measured in units of days from 6 Sept. The temperature index σT describes shifts in temperature during a time period preceding cold hardiness measurement by DTA and was calculated using the same formulas described by Londo and Kovaleski (2017):

where TE is the temperature experienced by the plant and T is the hourly average temperature. The base temperature, Tbase, used was 0°C. The ‘n’ used was 168 and specifies that σT is a sum of the temperature variations experienced during the 168 hrs (or 7 days) preceding cold hardiness measurements by DTA. The square of TE was calculated by multiplying the value of TE by its absolute value to keep the sign. A similar tactic is used to calculate the square root of  to keep the sign.
Model selection included a forward-backward stepwise procedure with a Bayesian Information Criterion (BIC). BIC was chosen to avoid overfitting the model and because there is a high number of sampling points. First, a model was selected using data from a single year (Year 1), precluding the use of a year term. For this process, the null model included only the intercept, and the full model included all parameters as well as interactions. Subsequently, a model was selected with the full two-year data set. This time the null model was the regression model previously found, and the full model included the interaction between the terms in the null model with year. Using this new regression model, data points with studentized residual ≥ 2 or Cook’s distance ≥ 0.002 were ranked as outliers and removed from the data set. Finally, the regression model was refit using the nonoutlier subset to obtain the final coefficients. Dominance analysis was performed to evaluate the relative contribution of each parameter.
Prediction model. A predictive discrete-dynamic model with 1-day time steps described in detail by Ferguson et al. (2011, 2014) was created in R. The model generates daily cold hardiness predictions for grapevine buds from 7 Sept to 15 May. A stepwise iterative method was used to identify 11 pre-defined cultivar-specific parameters. We included four more levels (-1, 0, 1, and 2°C) for the ecodormant temperature threshold parameter, in addition to the five levels (3, 4, 5, 6, and 7°C) used by Ferguson et al. (2011, 2014), resulting in a total of 2,976,750 parameter combinations (1,323,000 additional combinations, Table 2). The model was optimized and evaluated with the same two-year data set. The parameter combination that minimized the RMSE between predicted and observed LT50 was selected and evaluated for each year. Internal model validity was tested by Pearson correlation analysis of predicted versus observed LT50.
Parameter levels tested in all combinations stepwise for five cold climate interspecific hybrid grapevine cultivars to minimize root mean square error (RMSE): endodormant temperature threshold (Tth,endo), ecodormant temperature threshold (Tth,eco), endodormant acclimation rate (ka,endo), ecodormant acclimation rate (ka,eco), endodormant deacclimation rate (kd,endo), ecodormant deacclimation rate (kd,eco), theta exponent in deacclimation logistic equation (θ), and ecodormancy boundary (EDB). A total of 2,976,750 combinations were tested per cultivar and for two years (2017 to 2018 and 2018 to 2019).
Results
Summary of weather conditions. Winter conditions in the two years of this experiment were distinctly different; therefore, the results for each year are described separately. The first day that air temperatures dropped below 0°C was 28 Oct and 12 Oct for Year 1 and Year 2, respectively, and the last day air temperatures dropped below 0°C was 29 April and 28 April for Year 1 and Year 2, respectively. In Year 1, between 1 Sept and 30 April, for 62 days the maximum temperature was ≤0°C (180 days >0°C). During the same time period in Year 2, for 78 days the maximum temperature was ≤0°C (164 days >0°C). The minimum temperature reached during winter of Year 1 was -25.3°C on 1 Jan. The minimum temperature reached during winter of Year 2 was -32.9°C on two days, 30 and 31 Jan, and was part of the 2019 polar vortex split event. These minimum temperatures in Year 2 were extreme for the area. During this event, temperatures in the vineyard dropped below -25°C for 37 consecutive hours. The minimum temperature during this time, -32.9°C, was reached twice, in the evening of 30 Jan and again in the morning of 31 Jan.
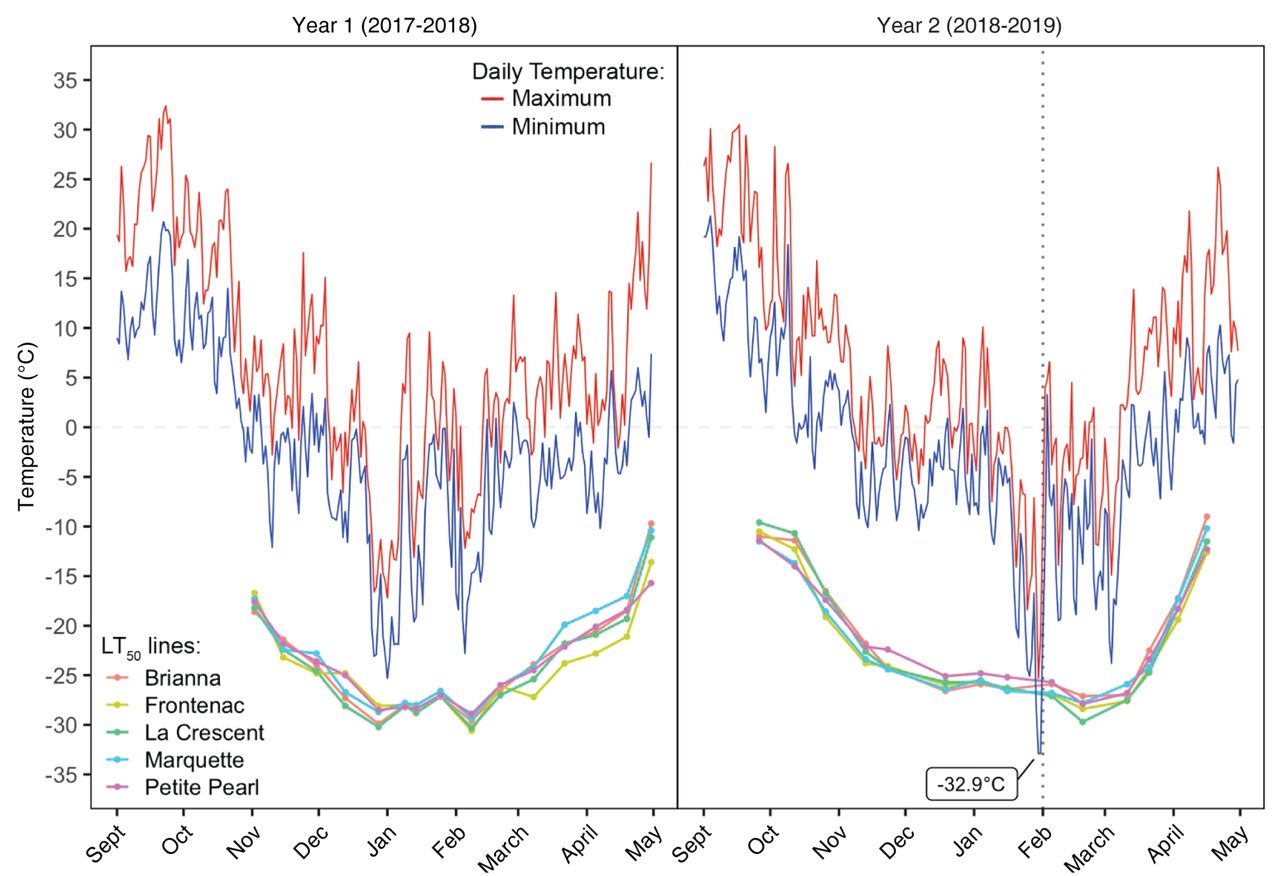
Cold hardiness response of CCIHG. All cultivars exhibited the standard U-shaped cold hardiness curve, with acclimation in the fall/early winter and deacclimation in late winter/spring. Figure 1 illustrates the LT50 response for each cultivar in both years tested. There were slight differences among cultivars and years in the LT50 temperature. The timing of minimal LT50 temperatures occurred nearly unanimously in mid-February. The exception to this was BR in Year 1, which reached its minimal LT50 in late December and had a comparable (+0.3°C) LT50 in mid-February. FR and LC had the overall lowest LT50 values in both years (respectively, -30.6 and -30.3°C in Year 1 and -28.4 and -29.7°C in Year 2).

Median low temperature exotherm (LT50) trends plotted for five cold climate interspecific hybrid grapevine cultivars, with daily maximum (red line) and minimum (blue line) temperatures for 2017 to 2018 and 2018 to 2019. Vertical dotted line identifies the date that buds tested with differential thermal analysis showed no low temperature exotherms (1 Feb 2019).
There were also differences in the range of temperature between LT10 and LT90 throughout the dormant season. The general trend was a small difference between LT10 and LT90 in the fall during acclimation, changing to a wide difference in midwinter, and then returning to a small difference in spring during deacclimation. The average LT10-to-LT90 range for all cultivars in both years was 3.9°C. The largest LT10-to-LT90 range was 9.5°C measured in BR on 28 Dec in Year 1. The smallest LT10-to-LT90 range was 1.6°C measured in PP on 15 Nov in Year 1. Across all cultivars, the changes in LT90 mimicked changes in LT50 and had a similar magnitude of difference (average of 1.5°C). In contrast, the changes in LT10 did not parallel the changes in LT50 and were also more distant in magnitude (average of 2.3°C difference).
Year 1 (2017 to 2018). All cultivars had LT50 values lower than -20°C by 15 Nov. BR’s maximal hardiness (-29.9°C) occurred in the end of December, while the maximal hardiness for FR (-30.6°C), LC (-30.3°C), MQ (-29.3°C), and PP (-28.9°C) occurred in early February. All of the cultivars acclimated through the end of December, followed by a period of fluctuating maximal hardiness until the end of February, before continuously deacclimating for the remainder of the sampling period. The only exception to this pattern was FR, which gained hardiness between February and March. All of the cultivars maintained LT50 values lower than the daily minimum air temperatures.
Year 2 (2018 to 2019). All of the cultivars had LT50 values lower than -20°C by 13 Nov. The rate of acclimation increased after 12 Oct (Figure 1). Maximal hardiness was measured in the end of February for all cultivars: BR (-27.1°C), FR (-28.4°C), LC (-29.7°C), MQ (-27.8°C), and PP (-27.9°C). All of the cultivars acclimated rapidly through December, then continued with slow acclimation through the first part of February before deacclimating rapidly for the remainder of the sampling period.
The minimum temperature of -32.9°C on 30 and 31 Jan 2019 was 6.3 to 7.7°C colder than the LT50 measured most recently (16 Jan) for all of the cultivars. Buds from all cultivars tested by DTA on 1 Feb showed no LTEs. Based on these observations, we expected extensive and severe damage in the vineyard. Buds from all cultivars tested by DTA on 5 Feb showed the resumption of normal peak patterns.
Visual bud injury evaluation. Following the extreme cold weather event in January 2019, an additional collection of buds was dissected to visually evaluate the extent of damage in the vineyard. While some damage was observed, it was not as widespread as the most recently preceding DTA results had indicated to be likely. A higher rate of injury was visible in primary meristems, as compared to secondary meristems. Specifically, meristem injury was 12.5% primary and 5.0% secondary for BR, 5% primary and 0% secondary for FR, 10% primary and 5.0% secondary for LC, 7.5% primary and 0% secondary for MQ, and 17.5% primary and 2.5% secondary for PP.
Explanatory model. The final multiple linear regression model selected included four parameters, six interaction terms, and an intercept. The equation selected was

Estimates were calculated separately for each cultivar in each year’s data set (Table 3). Parameters with estimates that vary across cultivar interacted with the Cultivar parameter (σT, Time2, Time). The Time parameter (in days) is the only parameter that varies between years, as identified by the Time × Year interaction. The overall model selected had a p value of < 0.0001 (2.2 × 10⁻¹⁶) and adjusted r2 = 89.5%. The temperature index parameter, σT, had an interaction with cultivar but not with year. Groupings for the significant differences between the estimates for σT, Time, and Time2 are listed in Table 3. In addition, overall dominance analysis showed σT had the largest relative contribution (50.1%), followed by Time2 (18.0%), and then Time (16.4%) (Table 4).
Estimates for parameters and interactions for the explanatory linear regression model describing low temperature exotherms for five cold climate interspecific hybrid grapevine cultivars during two years using the temperature index (σT), Time (days), and Time2 (days2) as parameters. Parameters separated by a colon represent interactions between two parameters. Different letters within a column denote statistical differences between cultivars using a t-test with α = 0.05.
Relative contribution of parameters in the explanatory linear regression model calculated using dominance analysis. The temperature index is represented by σT. Parameters separated by a colon represent interactions between two parameters.
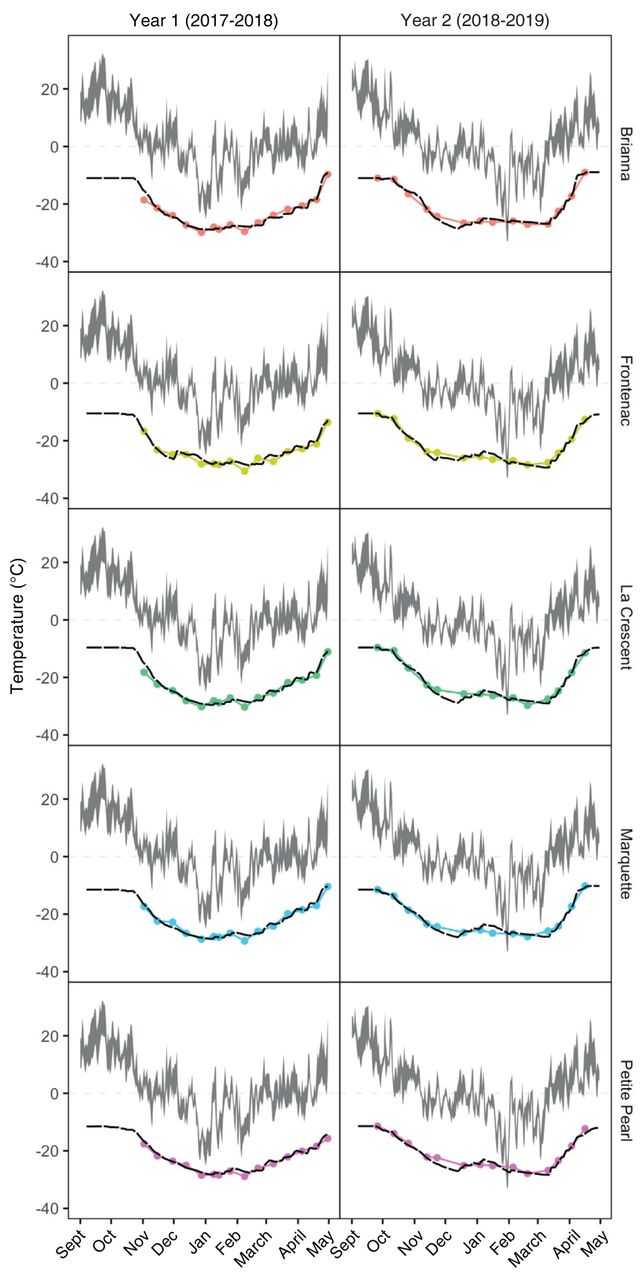
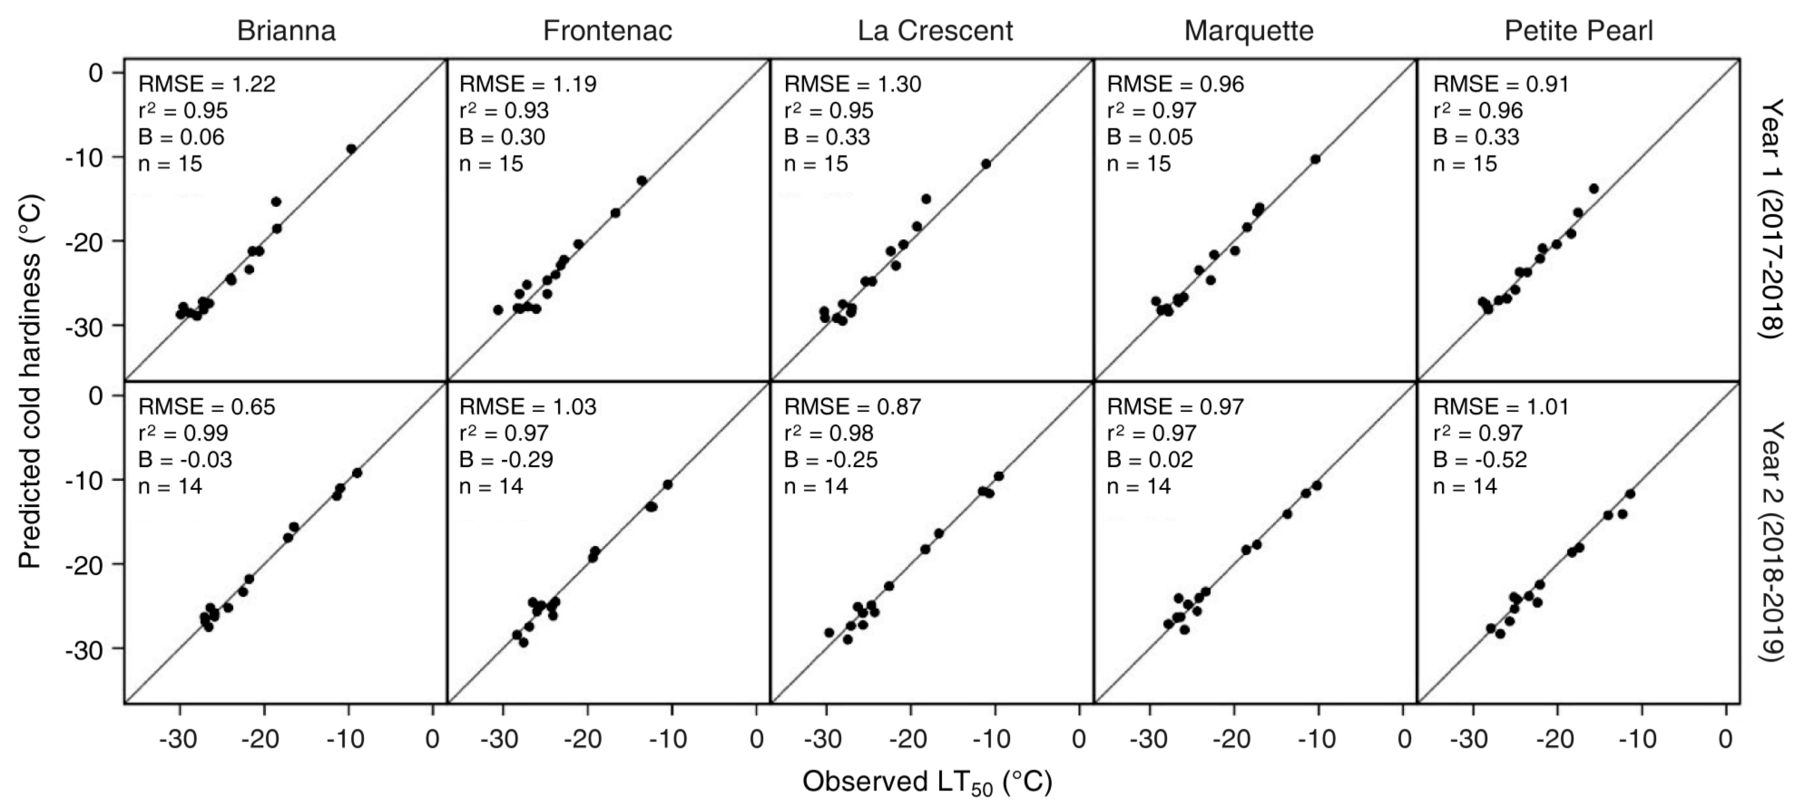
Prediction model. Collectively, the optimized model parameters predicted LT50 values with an overall r2 = 0.97 (r2Year 1 = 0.95 and r2Year 2 = 0.98) and RMSE = 1.01°C (RMSEYear 1 = 1.11 and RMSEYear 2 = 0.91). For all cultivars, r2 ≥ 0.93 by internal validity test, while RMSE varied from 0.65°C for BR in Year 2 to 1.30°C for LC in Year 1. The optimized model parameters for all cultivars and both years predicted LT50 values with an overall bias = 3.13 × 10⁻⁴ (biasYear 1 = 0.21 and biasYear 2 = -0.21). In general, the model slightly underpredicted LT50 values in Year 1 and slightly overpredicted LT50 values in Year 2. Parameters for each cultivar are listed in Table 5 and performance is illustrated in Figures 2 and 3.
Parameter value combinations that minimize root mean square error (RMSE) after reparametrizing the predictive discrete-dynamic model to simulate bud cold hardiness for five cold climate interspecific hybrid grapevine cultivars. Cold hardiness (Hc) predictions begin at Hc, initial, which is the earliest median low temperature exotherm (LT50) observed. Predictions are bound by lower (Hc, max) and upper (Hc, min) limits. Hc, max is the lowest LT50 observed, while Hc, min is highest LT50 observed. Other parameters include endodormant temperature threshold (Tth,endo), ecodormant temperature threshold (Tth,eco), endodormant acclimation rate (ka,endo), ecodormant acclimation rate (ka,eco), endodormant deacclimation rate (kd,endo), ecodormant deacclimation rate (kd,eco), theta exponent in deacclimation logistic equation (θ), and ecodormancy boundary (EDB).

Predicted bud cold hardiness (black, dashed lines) and observed median low temperature exotherm (LT50) values (colored lines and circles) plotted for five cold climate interspecific hybrid grapevine cultivars, with daily maximum and minimum temperature ranges for 2017 to 2018 and 2018 to 2019 (gray shaded area). Predictions were generated using the Ferguson et al. (2011, 2014) model reparametrized for each cultivar.

Comparison between predicted and observed bud cold hardiness, expressed as median low temperature exotherm (LT50) for five cold climate interspecific hybrid grapevine cultivars including r2, bias (B), and sample size (n) for each cultivar and year. Predictions were generated using the Ferguson et al. (2011, 2014) model reparametrized for each cultivar. RMSE, root mean square error.
Discussion
This is the first study to report continuous, time series-based bud cold hardiness measurements for CCIHG cultivars grown in a cold climate region. The main objective of this study was to evaluate changes in bud cold hardiness of CCIHG cultivars during the dormant period, with the goal of identifying periods of higher risk for incurring freeze damage. Bud cold hardiness patterns observed in CCIHG had a similar U-shape as those previously reported for V. vinifera and wild North American species (Pool et al. 1990, Wolf and Cook 1992, Kovács et al. 2003, Fennell 2004, Mills et al. 2006, Grant and Dami 2015, Cragin et al. 2017). However, CCIHG cultivars present noteworthy differences within the classic U-shaped pattern.
Acclimation. The CCIHG cultivars in this study acclimated before experiencing freezing temperatures. During Year 1, these cultivars had LT50 values ranging from -16.7 to -18.6°C within five days of the first frost. During Year 2, these cultivars had LT50 values ranging from -10.7 to -14.0°C on the day of the first frost (Figure 1). This is consistent with reports that gradually decreasing daylengths and photoperiods less than 13 hrs promote cold acclimation in V. labrusca and V. riparia, while these phenomena do not promote acclimation in V. vinifera (Fennell and Hoover 1991, Wake and Fennell 2000, Fennell 2004). It is possible that the synergistic effect of shorter photoperiods and cooler, but not freezing, temperatures during the late summer and early fall in our study area promote faster acclimation rates in CCIHG cultivars than in other areas with warmer falls. In Wisconsin, the fast acclimation rate of CCIHG, plus the low incidence of hard freeze events (< -2.2°C) before mid-October (as found on the website https://mrcc.illinois.edu/VIP/frz_maps/area_150.html#frzMaps) result in a relatively low risk of freeze damage during fall for these cultivars.
Midwinter cold hardiness. The lowest LT50 values for these CCIHG cultivars ranged from -28.9 to -30.6°C in Year 1 and -27.1 to -29.7°C in Year 2 and were recorded in both years during midwinter (Figure 1). This is comparable to bud cold hardiness levels reported for wild Vitis species in northern North America including V. labrusca, V. riparia, and V. aestivalis, which are able to withstand temperatures as low as -35°C (Fennell 2004, Londo and Kovaleski 2017, Keller 2020). This is not surprising given that CCIHG cultivars include wild Vitis species in their complex genetic background (Maul et al. 2020) and that the focus of CCIHG breeding programs is to release cultivars to be grown in regions where winter temperatures regularly reach -25°C and colder.
On 30 and 31 Jan 2019, minimum temperatures were lower than the LT50 measured for all cultivars (most recently tested on 16 Jan), when a polar vortex brought record low temperatures across the U.S. Midwest region (as found on the website https://w2.weather.gov/climate/xmacis.php?wfo=mkx). Temperatures at our study site reached -32.9°C twice within 48 hrs and remained below -25°C for 37 consecutive hours, including 15 hrs below -30°C. No LTEs were detected from the DTA performed the day after the lowest temperature was recorded (vertical dotted line in Figure 1), which led us to believe buds had been damaged in the field when the temperature was lower than their supercooling capacity. However, there was only 10.5% and 2.5% damage in primary meristems and secondary meristems, respectively, found in bud dissections performed on a subset of the buds. It is possible that the long exposure to temperatures below -30°C resulted in freeze dehydration of the buds, lowering the water content inside the buds, thus leading to an increase in freezing stress resistance. This phenomenon has been described by Kasuga et al. (2020) in interspecific hybrid grapes grown in northern Japan. In that study, buds conditioned to -15°C for 12 hrs experienced partial dehydration of primordial cells, as revealed by cryo-scanning electron microscopy, resulting in a lowering of the buds’ median freezing temperature (Kasuga et al. 2020). Similarly, DTA-based studies of V. riparia buds did not produce LTEs following prolonged exposure to extreme cold conditions and low relative humidity, which may indicate the loss of all freezable water (Pierquet et al. 1977, Pierquet and Stushnoff 1980). In our conditioning experiments conducted less than two weeks after the extreme low temperature event, no LTEs were detected in the DTA performed after the conditioning protocol, and no visual symptoms of freezing damage were observed in bud dissections after allowing expression of damage symptoms (data not shown). DTA is widely used in the scientific community to assess cold hardiness of grape buds. However, its exclusive use to monitor changes in bud freezing stress resistance of existing and future releases of CCIHG cultivars adapted to cold climate regions may underestimate their true cold hardiness potential. This is because of their buds’ ability to partially dehydrate when exposed to prolonged and extreme cold temperature conditions (e.g., 15 hrs below -30°C). Future studies aiming to quantify the full extent of grapevine midwinter cold hardiness should include controlled freezing tests and visual evaluation of freeze damage in buds (e.g., oxidative browning or water-soaked appearance) to complement DTA (Villouta et al. 2020).
Deacclimation. Grapevines in our study began deacclimating in early February 2018 and March 2019; and from this point, buds lost hardiness (Figure 1). One exception to this general trend was in Year 1 when buds deacclimated in early January but then reacclimated by the time of the first hardiness evaluation in February (Figure 1). Although many factors can affect deacclimation dynamics (Kalberer et al. 2006), the completion of endodormancy appears to be a key factor influencing the onset of deacclimation (Ferguson et al. 2011, 2014). The fulfillment of chilling requirements marks the transition from endo- to ecodormancy (Lang et al. 1987) and is considered to happen in V. riparia, V. vinifera, V. labrusca, and some interspecific hybrids after exposure to 750 to 1000 chilling hours (Londo and Johnson 2014). In our study, vines experienced 750 chilling hours by February and January in Year 1 and Year 2, respectively. The attainment of 1000 chilling hours by late March in both years coincided with the onset of deacclimation. However, in unpublished data on chilling requirements for these CCIHG cultivars collected by our research group, endodormancy was complete when 400 to 500 chilling hours had been accumulated, which typically occurs in November to mid-December in our region. The potential for deacclimation could begin as early as December for CCIHG cultivars grown in Wisconsin. However, deacclimation does not occur during this point in ecodormancy until vines are exposed to temperatures above freezing.
We also observed an increase in the deacclimation rate from late March throughout April in both years. In Year 1, deacclimation rates increased from 0.12 to 0.14°C/day to 0.26 to 0.83°C/day during this time period. In Year 2, deacclimation rates increased from 0.38 to 0.53°C/day to 0.46 to 0.63°C/day. Kovaleski et al. (2018) established that grapevine bud deacclimation rate increases in a logistic relationship as more chilling is accumulated. During the deacclimation period from late March through April, air temperatures were between 0 to 7.2°C ~37% and 55% of the time for Year 1 and Year 2, respectively. This additional chilling accumulated during ecodormancy likely increases deacclimation potential, meaning deacclimation responses happen at cool temperatures above 0°C.
Cultivar differences. Cultivar differences in cold hardiness responsiveness can be compared using the explanatory model because Cultivar was a significant parameter in the final model (Table 3). Cultivar-specific estimates for a particular parameter quantify differences in aspects of cold hardiness responsiveness across cultivars. Overall, PP and BR bud cold hardiness had relatively low levels of responsiveness to temperature fluctuations compared to LC, the cultivar with the highest responsiveness, and to MQ and FR, which had moderate responses to temperature fluctuation, reflected in their respective σT estimates (Table 3). In terms of acclimation and deacclimation responses, LC and BR had relatively fast responses, reflected in their high Time and Time2 estimate values, while PP and FR had slow acclimation and deacclimation responses, compared to the other cultivars (Table 3).
Grape bud cold hardiness prediction. The secondary objective of this study was to test and adapt the discrete-dynamic cold hardiness prediction model developed by Ferguson et al. (2011, 2014) for CCIHG cultivars grown in cold climate regions. The ecodormant temperature thresholds above 2°C in the original version of the model limited the accurate estimation of deacclimation during late winter and early spring for the CCIHG cultivars, and thus overpredicted cold hardiness once deacclimation began. Reparametrizing the model with an expanded range for the ecodormant temperature threshold parameter (including -1, 0, 1, and 2°C) was critical to improve the performance of the prediction model (Figures 2 and 3). The warmest ecodormant temperature threshold parametrized was for BR and FR (1°C), the coldest was for MQ (-1°C), and an intermediate threshold was for LC and PP (0°C). Lower ecodormant temperature thresholds than those used by Ferguson et al. (2011, 2014) allowed the model to accurately calculate deacclimation during cool spring temperatures (Figure 2). Deacclimation at lower temperatures in preparation for budbreak could be an important ecological adaptation by CCIHG to maximize their use of shorter growing seasons. However, it also increases the risk of freezing damage for CCIHG buds throughout spring. After reparametrizing with an expanded range of ecodormant temperature thresholds, the overall performance of the predictive model had an RMSE = 1.01°C, r2 = 97%, and bias = 3.13 × 10⁻⁴. While these are exceptional model statistics that provide evidence for the possibility to adapt the discrete-dynamic cold hardiness prediction model for CCIHG cultivars, our results are partially a consequence of the limited number of years in our data set. This model requires further optimization and testing for CCIHG using longer-term cold hardiness data sets collected in the future.
Conclusion
This is the first study to evaluate continuous changes in bud cold hardiness for CCIHG grown in a cold climate region. These CCIHG cultivars had an early acclimation response during fall, with increased levels of cold hardiness before the occurrence of freezing temperatures, which reflects the decreased risk of freezing damage during the fall in regions with similar fall conditions to southern Wisconsin. Although these CCIHG cultivars maintained deep levels of cold hardiness throughout midwinter, the higher frequency of extreme weather events due to climate change may increase the risk of freezing damage during midwinter. The highest risk of freezing damage to CCIHG is during spring, because of the rapid deacclimation response once air temperatures rise above freezing. This trait should be considered when evaluating future releases of CCIHG cultivars for cold climate regions.
Following an extreme cold weather event during our study, we observed a cold hardiness response that presumably leveraged the mechanisms of both deep supercooling and freeze dehydration, which allowed these hybrids to achieve a deeper level of freeze stress resistance than previously evaluated. Further research to provide direct or further supporting evidence of the physiological mechanism underlying this interplay between deep supercooling and freeze dehydration will provide critical information for the breeding of new CCIHG cultivars.
Finally, our predictive model demonstrates that the discrete-dynamic model can be reparametrized to predict CCIHG cultivars’ cold hardiness in a cold climate region. This model and the CCIHG-specific parameters will be a useful tool in the prediction of CCIHG cold hardiness responses to variable climate scenarios and for the evaluation of new sites before planting vineyards, as well as providing assistance to growers in decision making to minimize yield and vine losses based on freeze damage risk.
Footnotes
Acknowledgments: The authors thank Janet Hedtcke and Rodney Denu, West Madison Agricultural Research Station, for assistance with vineyard maintenance. The authors also thank Maria Kamenetsky, University of Wisconsin-Madison Statistical Consulting Group, and Andrew Maule, UW-Madison Horticulture Department, for assistance with model development. This work was supported by a grant from the Wisconsin Department of Agriculture, Trade and Consumer Protection Specialty Crop Block Grant Program (award no. 17-14).
By downloading and/or receiving this article, you agree to the Disclaimer of Warranties and Liability. The full statement of the Disclaimers is available at http://www.ajevonline.org/content/proprietary-rights-notice-ajev-online. If you do not agree to the Disclaimers, do not download and/or accept this article.
- Received January 2021.
- Revision received April 2021.
- Accepted April 2021.
- Published online October 2021
This is an open access article distributed under the CC BY license (https://creativecommons.org/licenses/by/4.0/).
Literature Cited
Vol 72 Issue 4


Jump to section
Related Articles
Cited By...
More from this TOC section
Similar Articles
