


Abstract
Rotundone was recently identified as the compound that imparts the black pepper aroma in several winegrape cultivars. This two-year study aimed to identify the presence of rotundone in Noiret (interspecific hybrid of Vitis) and to determine the impact of fruit-zone leaf removal on rotundone concentrations in fruit and wine. The relationship between the intensity of black pepper aroma and rotundone concentration in Noiret wine was also explored. An undefoliated control (CON) was compared to a maintained fruit-zone sunlight exposure (MSE) treatment, where leaves were periodically removed from the fruit-zone. The influence of timing of fruit-zone leaf removal was assessed in a separate experiment by comparing preveraison leaf removal (LR) and postveraison leaf removal (PVLR) treatments. MSE vines had greater fruit-zone sunlight exposure compared to the CON throughout the season in 2015, both at the pre- and postveraison stages, but in 2014, only after veraison. PVLR increased fruit-zone sunlight exposure during ripening compared to LR in 2015 only. Rotundone could not be quantified in Noiret berries sampled before or at veraison (limit of quantitation = 0.16 μg/kg). Rotundone concentrations in harvested fruit and wines did not differ between treatments in 2014, but were significantly higher in MSE than in CON in 2015 (1.98 versus 1.28 μg/kg). PVLR temporarily increased rotundone concentration compared to LR, but differences disappeared by harvest. Black pepper aroma intensity, as determined by a sensory panel, was positively correlated (p = 0.023, r = 0.791) with rotundone concentration in wines made from imposed viticulture treatments, providing evidence that black pepper notes in Noiret are positively related to concentration of rotundone in the wine.
The aroma impact compound rotundone has been identified as the main contributor to the spicy black pepper aroma in many winegrape varieties, including Vitis vinifera Shiraz, Vespolina, Duras, Gamay, and Grüner Veltliner (Siebert et al. 2008, Geffroy et al. 2014, Mattivi 2016). Rotundone (C12H22O) is a hydrophobic aroma-active molecule (log Kow = 4.98) classified as a sesquiterpene ketone belonging to the guaiene family (Caputi et al. 2011, Mattivi et al. 2011a). This compound was the first aroma-active sesquiterpene identified in grapes and has received increasing interest in recent years with respect to grape and wine aroma.
The mechanism of rotundone formation in winegrapes is unknown, but it develops in the berry skin, and its concentration increases during the late stages of ripening (Caputi et al. 2011, Mattivi et al. 2011b, Geffroy et al. 2014, Logan 2015). Maximum rotundone concentrations in fruit at harvest were 1.08 μg/kg for Shiraz grown in Australia (Scarlett et al. 2014), 2.34 μg/kg for Shiraz grown in Japan (Takase et al. 2015), 5.44 μg/kg for Vespolina, and 1.91 μg/kg for Grüner Veltliner (Caputi et al. 2011).
Identification and quantification of rotundone is challenging; it requires sensitive instrumentation and high accuracy and reproducibility to determine concentrations near the sensory detection thresholds (8 ng/L in water and 16 ng/L in red wine). In addition, standards of rotundone and its deuterium-labeled derivative are not commercially available, and therefore, must be synthesized (Culleré et al. 2016). Previous studies used stable isotope dilution analysis, solid-phase extraction (SPE), stir-bar sorptive extraction (SBSE), solid-phase microextraction (SPME), and various gas chromatography-mass spectrometry configurations (GC-MS, multidimensional GC-MS [MDGC-MS], and gas chromatography-tandem mass spectrometry [GC-MS/MS]) to isolate, concentrate, detect, and quantify rotundone in grapes and wine (Siebert et al. 2008, Caputi et al. 2011, Mattivi et al. 2011a, Geffroy et al. 2014, Takase et al. 2015, Culleré et al. 2016).
Like other grape-derived aroma compounds, rotundone biosynthesis can be controlled by environmental and cultural factors (Geffroy et al. 2014). Vineyard mesoclimate plays an important role in rotundone development, with cooler vintages and sites leading to greater rotundone accumulation (Caputi et al. 2011, Herderich et al. 2012, Scarlett et al. 2014). The strong positive relationship between the perceived intensity of black pepper aroma and rotundone concentration in wine (Wood et al. 2008, Geffroy et al. 2016) has led to interest in knowing whether black pepper intensity in finished wines can be manipulated by vineyard management techniques to meet consumer preferences.
Fruit-zone leaf removal is a common viticultural practice used to improve microclimate conditions (sunlight exposure, air temperature, and air circulation) for disease control, and to modify grape maturity and quality parameters (Bavaresco et al. 2008, Scheiner et al. 2010). Recent studies of the relationships between fruit-zone microclimate and rotundone development have led to mixed findings. Leaf removal at veraison resulted in decreased rotundone concentration in Duras wines compared to an undefoliated control (Geffroy et al. 2014), but earlier leaf removal (at and prior to bloom) did not impact rotundone concentrations in Shiraz fruit (Logan 2015). Additionally, artificial shading of the fruit-zone or whole vine from veraison to harvest did not impact rotundone concentrations in the fruit, compared to vines with natural canopy coverage (Zhang et al. 2015a).
Rotundone development in grapes has only been studied in V. vinifera cultivars; it is not known whether it is present in other Vitis species. Noiret is a cool-climate interspecific red Vitis hybrid released by Cornell University in 2006 (Reisch et al. 2006), and growth of this cultivar in the northeastern United States has increased in recent years. Winemakers and professional wine evaluators have anecdotally noted that Noiret wine possesses the spicy black pepper aroma characteristic of rotundone, but the presence of this compound has not been chemically verified. Furthermore, rotundone has not been identified in any cultivars present in the Noiret genealogy, which includes Steuben, Chancellor, Sheridan, and Wayne, among others (Reisch et al. 2006).
This study aimed to confirm the presence of rotundone in Noiret and to determine if and how the timing of fruit-zone leaf removal and the intensity of sunlight exposure affect rotundone accumulation in the fruit and concentration in the finished wine. We also investigated whether a relationship exists between the perceived intensity of black pepper aroma and rotundone concentration in the wines vinified from the imposed viticulture treatments.
Materials and Methods
Vineyard site and experimental design
The experiment was conducted from 2014 to 2015 at the Cornell University New York State Agricultural Experiment Station (NYSAES) in Geneva, NY. The vineyard soil was deep, well-drained Honeoye fine silt loam. Eight-year-old Noiret vines were trained on a high-wire cordon trellis system oriented north-south with spacing of 3.6 m between vines and 2.7 m between rows. The experimental design was a randomized complete block design with five replications per treatment, and the experimental unit consisted of a two-vine panel (7.2-m long row). Treatments were implemented at defined phenological stages, visually assessed using the modified Eichhorn and Lorenz (E-L) system (Coombe 1995).
The vineyard was established in 2006 to assess the impact of training system, rootstock, and vine spacing on Noiret growth, yield, and fruit composition (Vanden Heuvel et al. 2013). To obtain five replications per treatment, we needed to use Noiret vines on two different rooting systems, which were treated as two separate experiments (1 and 2). For the first experiment, two treatments were implemented on own-rooted Noiret vines to assess the impact of fruit-zone sunlight exposure intensity on rotundone development: 1.1, control (CON): no leaf removal, highly shaded clusters; and 1.2, maintained fruit-zone sunlight exposure (MSE): leaves periodically removed from the fruit-zone beginning at berry pea-sized stage (E-L 31) to maintain sun exposure until harvest. For the second experiment, two treatments were imposed on Noiret vines grafted on Millardet et de Grasset 101-14 (101-14 Mgt) rootstock to assess the impact of phenological timing of fruit-zone leaf removal on rotundone accumulation: 2.1, preveraison leaf removal (LR): basal leaves removed at berry pea-sized stage (E-L 31); and 2.2, postveraison leaf removal (PVLR): basal leaves removed one week after 50% veraison (E-L 35). Basal leaf removal for treatments 2.1 and 2.2 was only performed at the single specified time point; further leaf removal to maintain sun exposure in the fruiting zone was not implemented.
Weather measurement
Seasonal weather data (hourly rainfall and hourly average, minimum, and maximum air temperature) were recorded at a weather station located at the NYSAES research farm (newa.cornell.edu). Growing degree days (GDDs) were determined from 1 May to harvest using the formula GDDs = [(max daily temperature + min daily temperature) / 2] − 10°C. The percentage of degree hours above 25°C from veraison to harvest (DH25) was calculated for each vintage with the formula DH25 = [(number of hours >25°C between veraison and harvest / number of hours between veraison and harvest) × 100] (Zhang et al. 2015b).
Canopy characterization
Enhanced point quadrat analysis (EPQA) was used to assess the effects of treatments on canopy density and sunlight availability in the fruit-zone (Meyers and Vanden Heuvel 2008). For both seasons, EPQA measurements were collected three times after initiation of cultural treatments (Figure 1). For point quadrat analysis (PQA) measurements, a tape measure was first extended across each experimental unit parallel to the fruit-zone, a thin metal rod was inserted into the canopy at 20-cm intervals (36 insertions per experimental unit), and the order in which clusters and leaves were contacted was recorded. These measurements were used to calculate leaf layer number (LLN) and percent interior clusters and leaves (PIC, PIL). Photosynthetically active radiation (PAR) measurements were taken on cloudless days in the fruit-zone of each vine and above the canopy using a ceptometer (AccuPAR LP-80, Decagon Devices). The PQA and PAR data were analyzed using EPQA and Calibrated Exposure Mapping Tools version 1.6.2 to calculate occlusion layer number (OLN) and cluster and leaf exposure flux availability (CEFA, LEFA) (Meyers and Vanden Heuvel 2008).

Calendar dates for fruit-zone leaf removal (LR: preveraison leaf removal; MSE: maintained fruit-zone sunlight exposure; PVLR: postveraison leaf removal), berry sampling, and enhanced point quadrat analysis (EPQA) measurements in 2014 and 2015. Phenological stages are annotated with superscripts: apea-size, E-L 31; bbunch closure, E-L 32; c100% veraison, E-L 35; done week after 50% veraison, E-L 35; eberries not quite ripe, E-L 37; fharvest, E-L 38. In 2015, berry sample 2 was collected prior to removing leaves from the PVLR vines on the same calendar day.
Berry sampling and yield components
A berry sample (250 g) was collected from each experimental unit four times during the growing season at E-L 32 (beginning of bunch closure), E-L 35 (veraison), E-L 37 (berries not quite ripe), and E-L 38 (harvest) (Figure 1). Berries were collected from many clusters within each experimental unit and from various positions within each cluster; they were placed in plastic storage bags, kept on ice during transport, and stored at −20°C until rotundone analysis.
Grapes were hand-harvested on 28 Oct 2014 and 21 Oct 2015. Clusters were counted for each experimental unit, and crop yield was assessed using a hanging scale with 0.1-kg accuracy (Pelouze 7710, Rubbermaid, Inc.). These measurements were used to estimate average cluster weight, crop weight, and number of clusters per vine. A 100-berry sample was collected from each experimental unit for determination of average berry weight, pH, titratable acidity (TA), and total soluble solids (TSS).
The vines were pruned to an average of 18 nodes/m of cordon during the dormant season (3 April 2015 and 4 March 2016), and cane pruning weight of each experimental unit was collected using a hanging scale with 0.1-kg accuracy (model SA3N340, Salter Brecknell); crop load was calculated and expressed as Ravaz index (yield/pruning weight).
Vinification
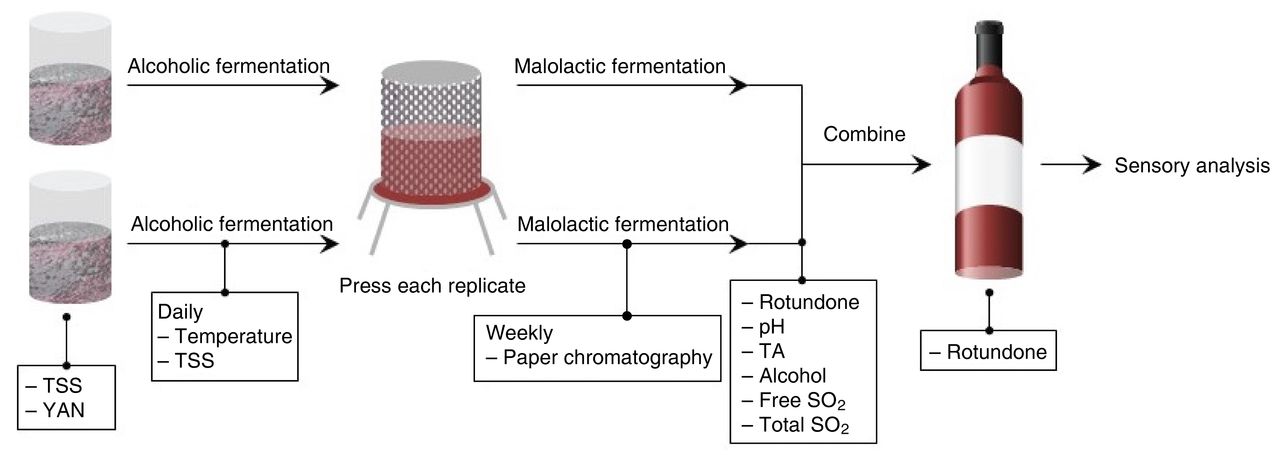
Hand-harvested fruit was transported to the Department of Food Science at the Pennsylvania State University where it was stored for <48 hrs at 3°C until processing (30 Oct 2014 and 22 Oct 2015). The fruit from each field treatment replication (n = 5) was pooled for vinification. Fruit was crushed and destemmed with a stainless-steel crusher/destemmer and evenly divided into duplicate lots for fermentation (n = 2) (Figure 2). Open-top, low-density polyethylene fermentation bins (Nalgene Nunc International) were used (40-L bins in 2014, 60-L bins in 2015), yielding 30 to 40 L of must per bin. Juice samples (50 mL) were taken from each fermentation lot for TSS and yeast assimilable nitrogen (YAN) measurements.

Key steps from alcoholic fermentation to wine sensory analysis, including the timeline of wine chemical analyses. TA, titratable acidity; TSS, total soluble solids; YAN, yeast assimilable nitrogen.
Both years, the must of each bin was chaptalized with sucrose to achieve a TSS value of 21 Brix based on juice chemical analysis. Must was inoculated with a commercial strain of Saccharomyces cerevisiae ICV-GRE yeast (Lallemand) at an inoculation rate of 0.25 g/L with 0.30 g/L of Go-Ferm nutrient (Lallemand) added to the rehydration water. Primary fermentation was carried out without the use of external temperature control. Pomace caps were punched down three times per day, and the progression of alcoholic fermentation was monitored daily by temperature and TSS readings using an electronic thermocouple (Fluke Corporation) and hydrometer, respectively. In 2014, wines were kept between 15 and 20°C for the first 24 hrs of fermentation, and between 20 and 25°C until the end of alcoholic fermentation. In 2015, wines were kept between 14 and 20°C for the first 24 hrs of fermentation, and between 21 and 29°C until the end of alcoholic fermentation.
YAN adjustments were performed at one-third sugar depletion with the addition of Fermaid K nutrient (Lallemand) to achieve a final concentration of 0.25 g/L. Clinitest (Bayer AG) was used to determine dryness, defined as <1% residual sugar. At dryness, wines were pressed using a hydraulic stainless-steel air-bladder press and transferred into an 18.93-L glass carboy. A 250-mL wine sample was taken from each fermentation duplicate for chemical analysis (data not shown). The wines were inoculated with a commercial strain of Oenococcus oeni Alpha MBR malolactic bacteria (Lallemand) at a concentration of 105 CFU/mL. Malolactic fermentation (MLF) was monitored weekly by paper chromatography (Zoecklein et al. 1999).
At the completion of MLF, wine samples (200 mL) were collected from each duplicate fermentation lot and stored in a −80°C freezer until rotundone analysis. An additional sample (500 mL) was taken for pH, TA, alcohol, free SO2, and total SO2 measurements. The wines were placed in cold storage (3°C) for two weeks to begin tartrate stabilization, after which they were racked off the lees, and the duplicate fermentations for each treatment were combined into a single 18.93-L glass carboy per treatment (n = 1) (Figure 2). At this time, SO2 was added to achieve a final concentration of 0.90 mg/L molecular free SO2, adjusted according to pH, and the wines were placed back into cold storage for continued stabilization. A second racking was performed at least one week prior to bottling, and additional SO2 was added to achieve the desired molecular free SO2 concentration of 0.90 mg/L. Existing free SO2 concentrations were determined one day before racking by aeration oxidation. Wines were bottled in sanitized 750-mL-capacity clear glass bottles, sealed with a screwcap, and stored at 3°C. Post-MLF and post-bottling wine samples were collected and prepared for rotundone analysis within eight days after wine sensory evaluation (Figure 2).
Berry and wine chemical analyses
Frozen berry samples were placed into a water bath at 60°C to thaw and dissolve tartrates. The samples were then pressed in the bags to expel juice, strained through layers of cheesecloth to remove solids, and collected in a beaker. TSS was measured using a handheld refractometer (Master, Atago); pH values were measured with a pH meter (Orion Star A111, Thermo Fisher Scientific), and TA was measured using an automatic titrator (G20, Mettler Toledo). A 10-mL sample of juice was made up to 40 mL with deionized water, titrated to pH 8.2 using 0.10 N sodium hydroxide, and the results were recorded using tartaric acid equivalents.
Wine pH was measured as described above. Prior to TA measurements, a wine sample aliquot was heated in warm water (~60°C) for 10 min. The samples were then purged with gaseous argon for 30 sec to remove carbon dioxide. After purging, TA was measured using an automatic titrator as described previously. Alcohol content, total SO2, and free SO2 were analyzed using standard wine analysis methods (Zoecklein et al. 1999). Alcohol content in the wines was determined using an ebulliometer (Laboratories Dujardin-Salleron). Total SO2 was measured using the Ripper method. Samples were diluted 1:1 prior to analysis because the intense color prevented color differentiation; the concentration determined using the diluted sample was then multiplied by the respective dilution factor. Free SO2 was measured using the aeration-oxidation method.
Berry and wine sample preparation for rotundone analysis
Berries (125 g) from each frozen sample were processed as described in Caputi et al. (2011). Briefly, berries were deseeded, transferred to liquid nitrogen, and homogenized to a fine powder using a kitchen blender (Sunbeam Products, Inc.). The frozen berry powder was transferred to labeled glass sample jars, and the headspace was purged with argon for 30 sec before sealing with the cap. The sample jars were placed in frozen storage (−80°C) until analysis.
Rotundone was extracted from the frozen grape powder according to Caputi et al. (2011) with slight modifications. Twenty-five grams of frozen grape powder was spiked with 100 μL d5-rotundone (516 μg/L in ethanol) internal standard; 50 mL acetone was added and the mixture was orbitally shaken at 225 rpm for one hour. The extracts were vacuum filtered using 0.10-μm glass fiber filter paper (Pall Corporation). The solvent was carefully evaporated at 40°C using a nitrogen blow-down RapidVap Vertex+ Dry Evaporator (Labconco Corp.). The remaining aqueous residue (~20 mL) was diluted to 85 mL with model wine (12% ethanol, 5 g/L tartaric acid, pH 3.2). The diluted samples were distributed across two Teflon fluorinated ethylene propylene centrifuge tubes (Nalgene Nunc International Corp.) and centrifuged at 4000 rpm for 12 min. The centrifuged extract was used for SPE analysis.
SPE was carried out according to Siebert et al. (2008) with minor modifications. Using a TELOS 12-position sample-processing manifold (Kinesis Ltd.), SPE cartridges (Phenomenex Strata styrene-divinylbenzene [SDB-L] 500 mg/6 mL) were conditioned with one cartridge volume of n-pentane/ethyl acetate (4:1), followed by methanol and model wine. The berry extract/wine sample was then loaded onto the SPE cartridge, which was subsequently washed with a cartridge volume of ultrapure water followed by n-pentane (2 mL, discarded). Elution was carried out using two 5-mL aliquots of n-pentane/ethyl acetate (9:1). The two sample fractions were evaporated to dryness using a nitrogen blow-down evaporator at 40°C. The remaining dried residues were reconstituted in ethanol (0.5 mL), and ultrapure water (6.5 mL) was added. The reconstituted liquid was transferred to a 10-mL GC vial with magnetic screwcap for analysis by SPME-GC-MS.
For post-MLF (n = 2) and post-bottling (n = 1) samples, 100 mL of wine was directly spiked with 100 μL of d5-rotundone (516 μg/L in ethanol). SPE was carried out as described previously, with minor modifications. The dried eluate was reconstituted in ethanol (0.5 mL), and ultrapure water (4.5 mL) was added. The sample was then poured into a 10-mL GC vial with a magnetic screwcap. Sample vials were placed in frozen storage (−80°C) until analysis. Once prepared, the wine extracts were packaged with Techni Ice packs (frozen at −80°C) and sent to the Australian Wine Research Institute (Urrbrae, South Australia) for rotundone quantification.
Rotundone quantification in berries and wine
Rotundone concentration in the berry extracts was quantified using a modification of the protocol described by Siebert et al. (2008). A gas chromatograph (Agilent 7890A, Agilent Technologies Inc.) equipped with a Gerstel MPS2 multipurpose autosampler (Gerstel GmbH & Co. KG) was coupled to an Agilent 5975C mass selective detector. Agilent MassHunter GC/MS Acquisition software (Version B.07.00 SP2.1654) and Gerstel Maestro 1 software (Version 1.3.20.41) were used to control the instrument and autosampler, respectively. The GC was fitted with a J&W VF-35ms capillary column (60 m × 0.25 mm × 0.25 μm) (Agilent Technologies, Inc.). The GC inlet was fitted with a silanized glass straight design inlet liner (78.5 mm long × 6.5 mm o.d. × 0.75 mm i.d.) (Supelco). Helium (ultra high purity) was used as the carrier gas.
A Supelco “pink” StableFlex polydimethylsiloxane/divinylbenzene fiber was directly immersed in the sample for 60 min at 35°C with agitation (250 rpm). The SPME fiber was desorbed in the inlet of the gas chromatograph at 240°C for 5 min. Pulsed pressure mode was used during injection with a pulsed pressure of 18.362 psi until 36 sec. The split valve ratio was set to 30:1 after 33 sec. Helium carrier gas was delivered under constant flow mode at a rate of 1 mL/min. The oven temperature was held at 80°C for 1 min, increased to 220°C at 3°C/min, followed by an increase to 240°C at 40°C/min, and finally maintained at 240°C for 20 min. The MS transfer line was held at 240°C. The MS source and quad were operated at 230°C and 150°C, respectively. Positive ion electron impact selected ion monitoring (SIM) at 70 eV was used to determine rotundone and d5-rotundone. The monitored ions were m/z 147.1, 161.0, 203.1, 208.1, 218.1, and 223.2 with a dwell time of 30 ms for each. Rotundone was quantified using m/z 218.1 as the target ion and m/z 203.1 as the qualifier, and d5-rotundone was quantified using m/z 223.2 as the target ion and m/z 208.1 as the qualifier. Data analysis was performed using the Agilent MSD Enhanced ChemStation software package (Version F.01.00.1903).
The GC-MS method used for berry extracts did not achieve adequate separation of rotundone and the deuterated internal standard in wine extracts. Therefore, wine sample extracts were analyzed at the Australian Wine Research Institute using an established MDGC-MS method (Geffroy et al. 2014). Data were analyzed in-house using Agilent MSD Enhanced ChemStation software.
Calibration and validation of rotundone quantification methods
Two kg of black seedless table grapes (STEVCO) were crushed in large plastic bags, and juice TSS, pH, and TA were measured; the juice chemistry values were adjusted to reflect the average harvest chemistry of Noiret grapes grown in the Finger Lakes AVA (NY) between 2010 and 2014 (Martinson 2014). The juice was recombined with the grape skins before processing into powder as described above. Subsamples of the grape powder were spiked in duplicate with rotundone at concentrations ranging from 0 to 4.23 μg/kg (n = 9 × 2; y = 3.947x − 0.1064, r2 = 0.992).
To assess the reproducibility of this method, replicate additions of high and low concentrations of rotundone within this calibration range were analyzed, yielding relative standard deviation (RSD) values of <3. The limit of detection (LOD) and limit of quantitation (LOQ) (Harris 2010) were 0.05 and 0.16 μg/kg, respectively, which are above the sensory detection threshold for rotundone (16 ng/L = 0.016 μg/L in red wine). However, considering that only a small amount (~5 to 6%) of rotundone in the harvested fruit is present in the finished wine (Caputi et al. 2011), berry rotundone concentrations below the LOQ would not likely be perceived in wine.
A calibration curve for the MDGC-MS wine analysis method was obtained by spiking a Cabernet Sauvignon wine with rotundone in duplicate at concentrations from 0 to 629 ng/L (n = 4 × 2; y = 0.222x + 0.0027, r2 = 0.999).
Sensory evaluation
Sensory evaluation was conducted at the Cornell University Sensory Evaluation Center (Ithaca, NY) in March 2016. The two-step procedure, adapted from Lawless and Heymann (1999), involved panelist screening and training followed by sensory evaluation. All data were collected in the sensory booth area under fluorescent lighting that simulated daylight (Sylvania pentron 6500k 14w fp14/865/eco) on 22-inch touch-screen monitors. RedJade software (Tragon Corporation) was used for data collection and analyses. The XLStat (Addinsoft) sensory module was used for additional statistical analyses.
Initially, 65 panelists consisting of university faculty, staff, and students aged 18 to 64 were recruited for the training session to ensure that they could identify the black pepper aroma. Although most panelists had participated in sensory studies previously and were familiar with the general evaluation procedures, none had received formal training in descriptive analysis of wine.
The training session included an aroma identification and a discrimination task. Panelists attended one of three sessions offered. After signing a consent form, panelists were seated in individual sensory booths and presented with a 150-mL opaque white plastic cup with opaque white plastic lid containing ~2 g of ground black pepper standard (Mayr et al. 2014). The panelists were instructed to open the lid slightly, smell the substance, then close the lid and describe, in their own words, what they smelled. After completing this task, panelists were informed that they had smelled the black pepper aroma standard, and they were given the opportunity to smell the standard again using the same procedure. Panelists were asked to remember this aroma before moving on to a triangle test in which they were presented with three wine samples, two of which were the same (ASTM 2011). The wines chosen for the triangle test were MSE and LR wines from the 2014 vintage, as they had noticeably different intensities of the black pepper aroma, based on a screening by an expert panel. Wine samples (50 mL), identified by a four-digit random code, were presented in standard ISO (International Organization for Standardization) glasses at 20 ± 2°C, and covered with a petri dish to limit loss of volatile aromas. The panelists were asked to evaluate each wine individually, starting with the sample on their left, by removing the lid from the glass, swirling the sample, smelling it, and replacing the lid. Panelists were allowed to re-smell the samples as much as they wished before making their decision. They were also asked to leave a comment explaining their choice.
Fifty-four out of 65 panelists (78%) correctly identified the black pepper aroma, and 29 of the 65 (45%) correctly chose the different sample in the triangle test. This was statistically significant at 95% level of confidence (Thurstonian model, p = 0.030, ɑ = 0.05, Power = 0.548). Among the 54 panelists who correctly named the black pepper standard, 25 out of 54 (46%) correctly chose the different sample in the triangle test. This was statistically significantly different at 95% level of confidence (Thurstonian model, p = 0.024, ɑ = 0.05, Power = 0.553).
The 54 panelists who correctly identified the aroma of the black pepper standard in the initial training were invited to come back. Seven additional panelists were admitted in the evaluation session after “on the spot” abbreviated training. These panelists were individually prescreened by smelling the black pepper standard as described above and correctly naming the aroma as that of black pepper. The total panel consisted of 41 females and 20 males between 21 and 64 years old who reportedly drank wine at least twice per year.
Considering the results of the triangle test and the strong black pepper aroma across all the wines, we decided to test diluted wine samples (two parts wine with one part deionized water, or 2:1 v/v ratio) during the evaluation session, as differences between the black pepper aroma intensities became more evident to the researchers with the dilution.
Diluted wines were presented at 20 ± 2°C in four-digit random-coded standard ISO glasses. Glasses were covered with a petri dish to reduce the loss of volatile aromas. Panelists assessed 16 wines (four treatments × two vintages × duplicate) during one test session, with each wine presented individually. Two sets of wines (four treatments × two vintages) were assessed successively, and the presentation order was randomized within each set. Black pepper aroma standards were available for the panelists in each sensory booth, and panelists were encouraged to re-smell the standard before the start of the sensory evaluation. Panelists were asked to evaluate the aroma of each sample orthonasally, by swirling the sample in the glass, removing the cover, smelling the test sample, and re-covering the glass. Panelists then rated the black pepper aroma intensity on a vertical line scale with two anchor points (“not at all” at the bottom and “extremely strong” at the top) and eight intermediate points, adapted from ASTM procedure 1083 (ASTM 1991).
Data analysis
Statistical analyses were performed using SAS version 9.4 (SAS Institute, Inc.). Data were subjected to analysis of variance using Proc MIXED (α = 0.05, 0.10) with replication coded as a random effect. The fruit-zone sunlight exposure intensity treatments (CON and MSE) could not be compared to the phenological timing of leaf removal treatments (LR and PVLR) because the vines had grown on different root systems (ungrafted Noiret versus Noiret/101-14Mgt). Data from the 2014 and 2015 seasons were not combined over years because of significant treatment-by-year interactions for the rotundone data. Regression analysis (Proc REG, α = 0.05) was used to investigate the relationship between black pepper aroma intensity ratings and wine rotundone concentrations.
Results
Weather conditions
From 1 May to harvest, there were 1305 cumulative GDDs (base 10°C) in 2014 and 1419 GDDs in 2015 (Figure 3A). From veraison to harvest, there were 338 GDDs in 2015 and 249 in 2014. The average daily temperature from veraison to harvest was 15.6°C in 2015 and 14.0°C in 2014 (Figure 3). From veraison to the E-L 37 stage (1 Sept to 26 Sept 2014, 27 Aug to 25 Sept 2015), average daily temperature was 15.9°C in 2014 and 19.1°C in 2015; the period from the E-L 37 stage to harvest (26 Sept to 28 Oct 2014, 25 Sept to 21 Oct 2015) average daily temperature was 12.6°C in 2014 and 11.7°C in 2015 (Figure 2B). The DH25 was 3.6% in 2014 and 8.5% in 2015.
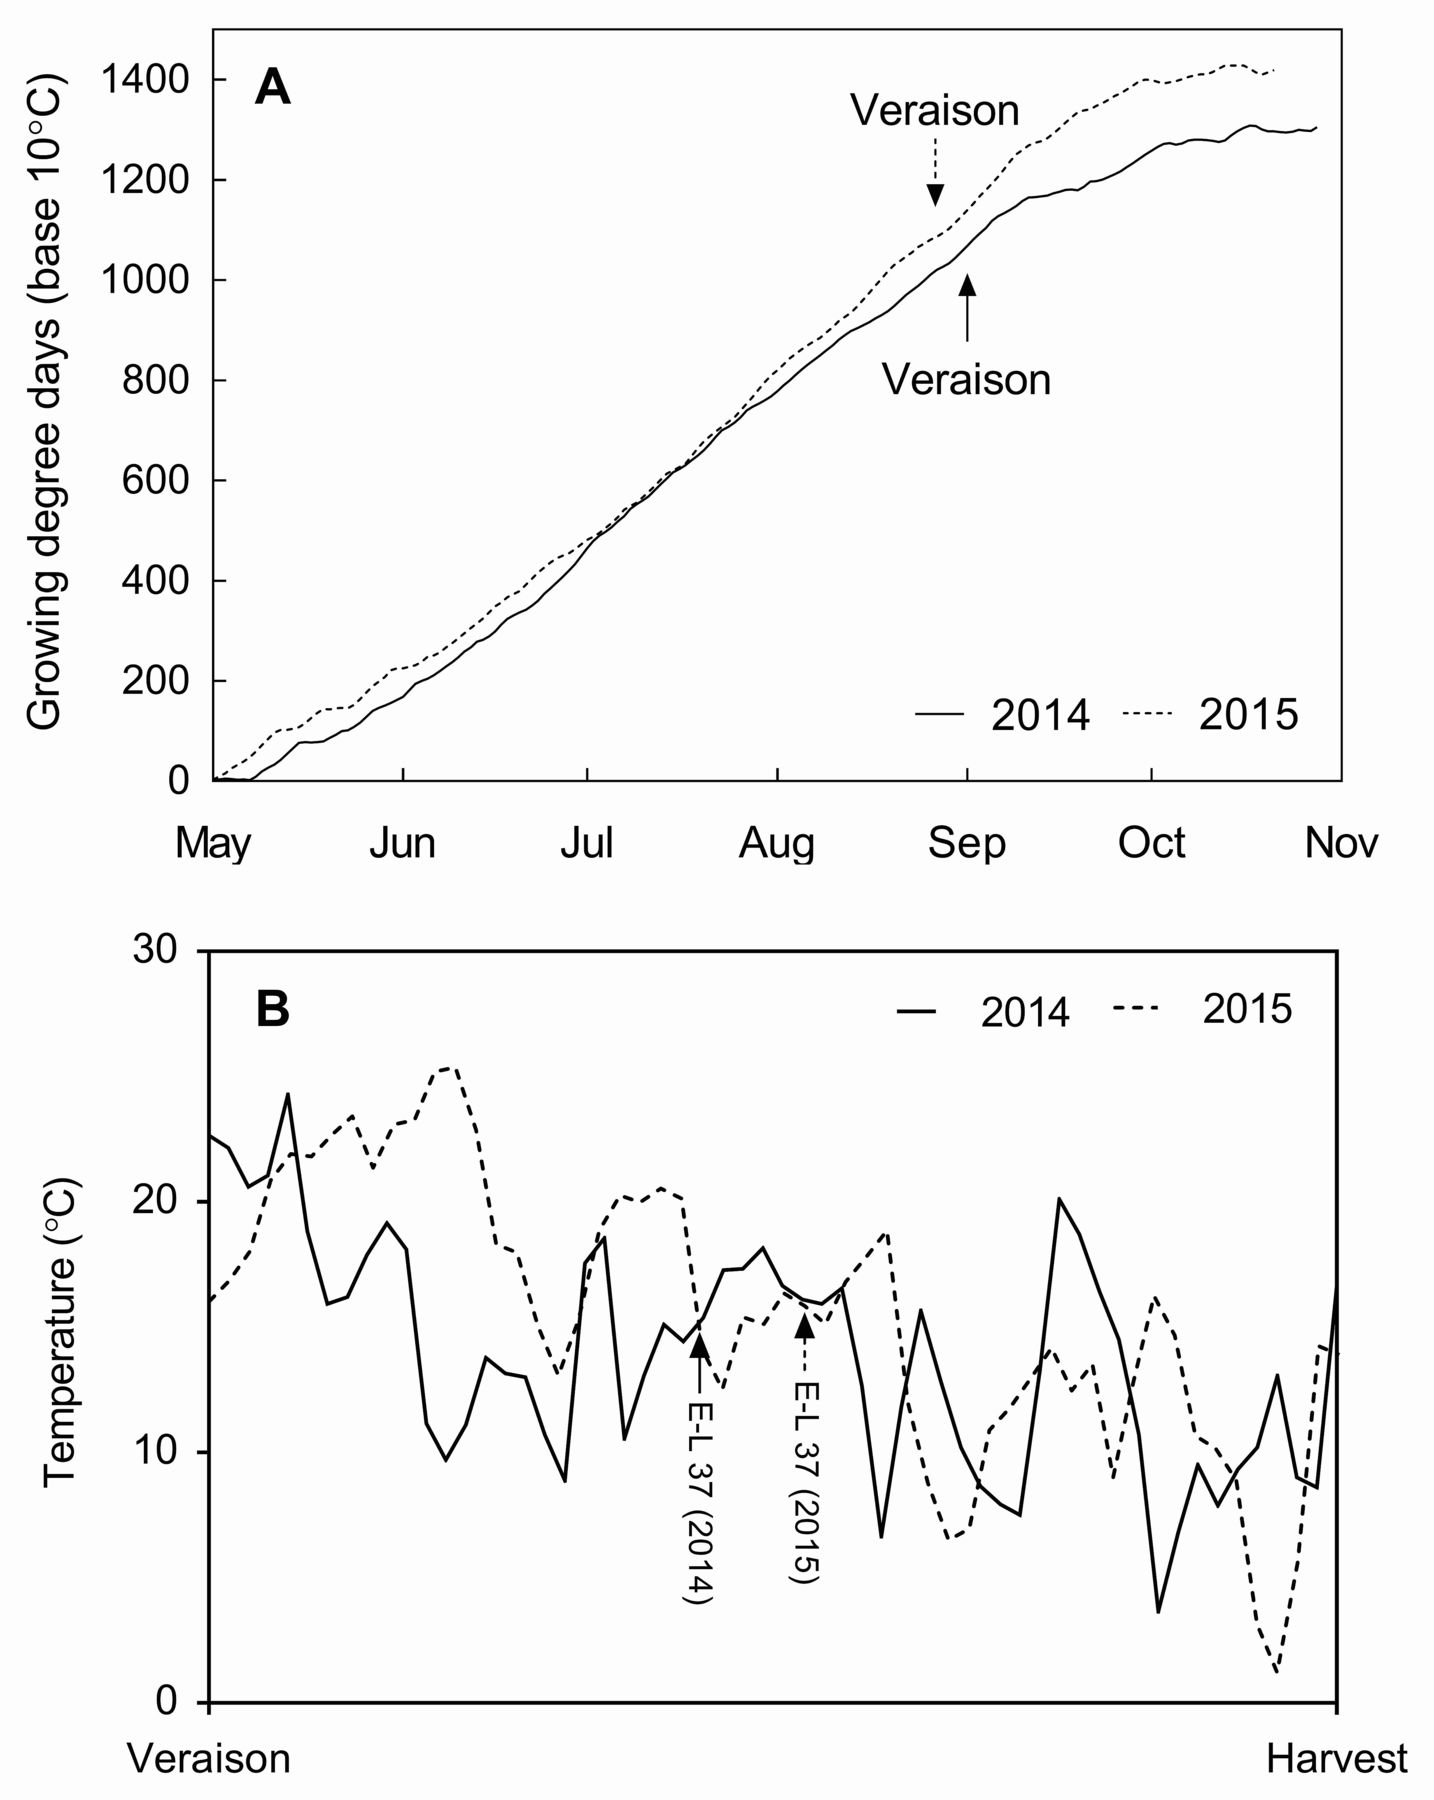
(A) Cumulative growing degree days from 1 May to harvest in Geneva, NY in 2014 and 2015. Arrows indicate the time of veraison for each season. (B) Average daily air temperature from veraison to harvest in Geneva, NY in 2014 and 2015. Arrows indicate the time of the E-L 37 sampling point for each season.
Vine vegetative growth and yield components
In 2014, there were no differences in EPQA parameters between treatment comparisons (CON versus MSE; LR versus PVLR) on the first measurement date (6 Aug), despite previous implementation of leaf removal in the MSE and LR vines (Table 1). CEFA and LEFA could not be quantified on this first date, as canopy light penetration could not be measured due to unfavorable weather conditions. For the second and third sample dates (12 Sept, 7 Oct), as expected, MSE vines had less dense canopies (LLN, OLN), fewer interior clusters and leaves (PIC, PIL), and more light available to clusters and leaves (CEFA, LEFA) compared to the highly vegetative CON vines. The timing of leaf removal treatments (LR versus PVLR), however, did not significantly impact any of the EPQA parameters at the second and third sample dates either, despite the second EPQA measurements being conducted shortly (eight days) after PVLR was implemented.
Effect of fruit-zone leaf removal treatments on selected enhanced point quadrat analysis variablesa in Noiret grapevines in 2014 (n = 5).
During the 2015 season, periodic removal of leaves from the fruit-zone (MSE) reduced canopy density (LLN, OLN) and percent of interior clusters and leaves (PIC, PIL), and increased sunlight reaching the clusters and leaves (CEFA, LEFA), compared to the CON on all three data collection dates (Table 2). Differences in canopy density and light availability between the timing of leaf removal treatments (LR versus PVLR) changed over the 2015 season. Fourteen days after LR was applied (16 July), LR vines had fewer leaf layers (LLN) and PIL, as well as increased CEFA and LEFA, compared to PVLR vines (not defoliated yet). An opposite trend was observed later in the season; 15 days after leaf removal was applied on the PVLR vines (11 Sept), PVLR vines had less dense canopies (LLN, OLN), fewer interior clusters and leaves (PIC, PIL), and more light interception by clusters (CEFA) than the LR vines. Additionally, changes in each of the EPQA parameters between July and September indicate a trend of increasing canopy density and decreasing light availability for LR vines. The differences between LR and PVLR treatments observed in September were mostly maintained in the last EPQA data collection taken 13 days before harvest (8 Oct). Fruit-zone leaf removal treatments did not significantly affect pruning weight or crop load in either year of study (Table 3). In 2014, LR vines had lower yield, number of clusters, and average berry weight compared to the PVLR vines, while there were no differences in yield parameters between CON and MSE vines. In 2015, the MSE treatment had lower average cluster weight compared to the CON. No significant differences in yield components were found between the LR and PVLR treatments in 2015.
Effect of fruit-zone leaf removal treatments on selected enhanced point quadrat analysis variablesa in Noiret grapevines in 2015 (n = 5).
Effect of fruit-zone leaf removal treatments on Noiret yield components, vine size, and crop load for in the 2014 and 2015 seasons (n = 5).
Berry and wine composition
There were no significant differences between treatments in berry TSS and berry and post-MLF wine pH for either season (Table 4). In both 2014 and 2015, TA was lower in the MSE fruit than in the CON at harvest, and wine produced in 2015 from the MSE fruit had significantly lower TA than the CON. The alcohol concentration in wines sampled at the completion of MLF varied significantly between treatment comparisons in 2014 (MSE < CON; LR > PVLR), as well as for the CON versus MSE comparison (MSE > CON) in 2015.
Effect of fruit-zone leaf removal treatments on Noiret berry composition at harvest (n = 5), and postmalolactic fermentation wine chemistry (n = 2).
Rotundone concentration in berries
Rotundone was successfully identified in Noiret grapes (Figure 4). Rotundone was detected but not quantified (concentrations were below the LOQ) in berries collected at preveraison and veraison.
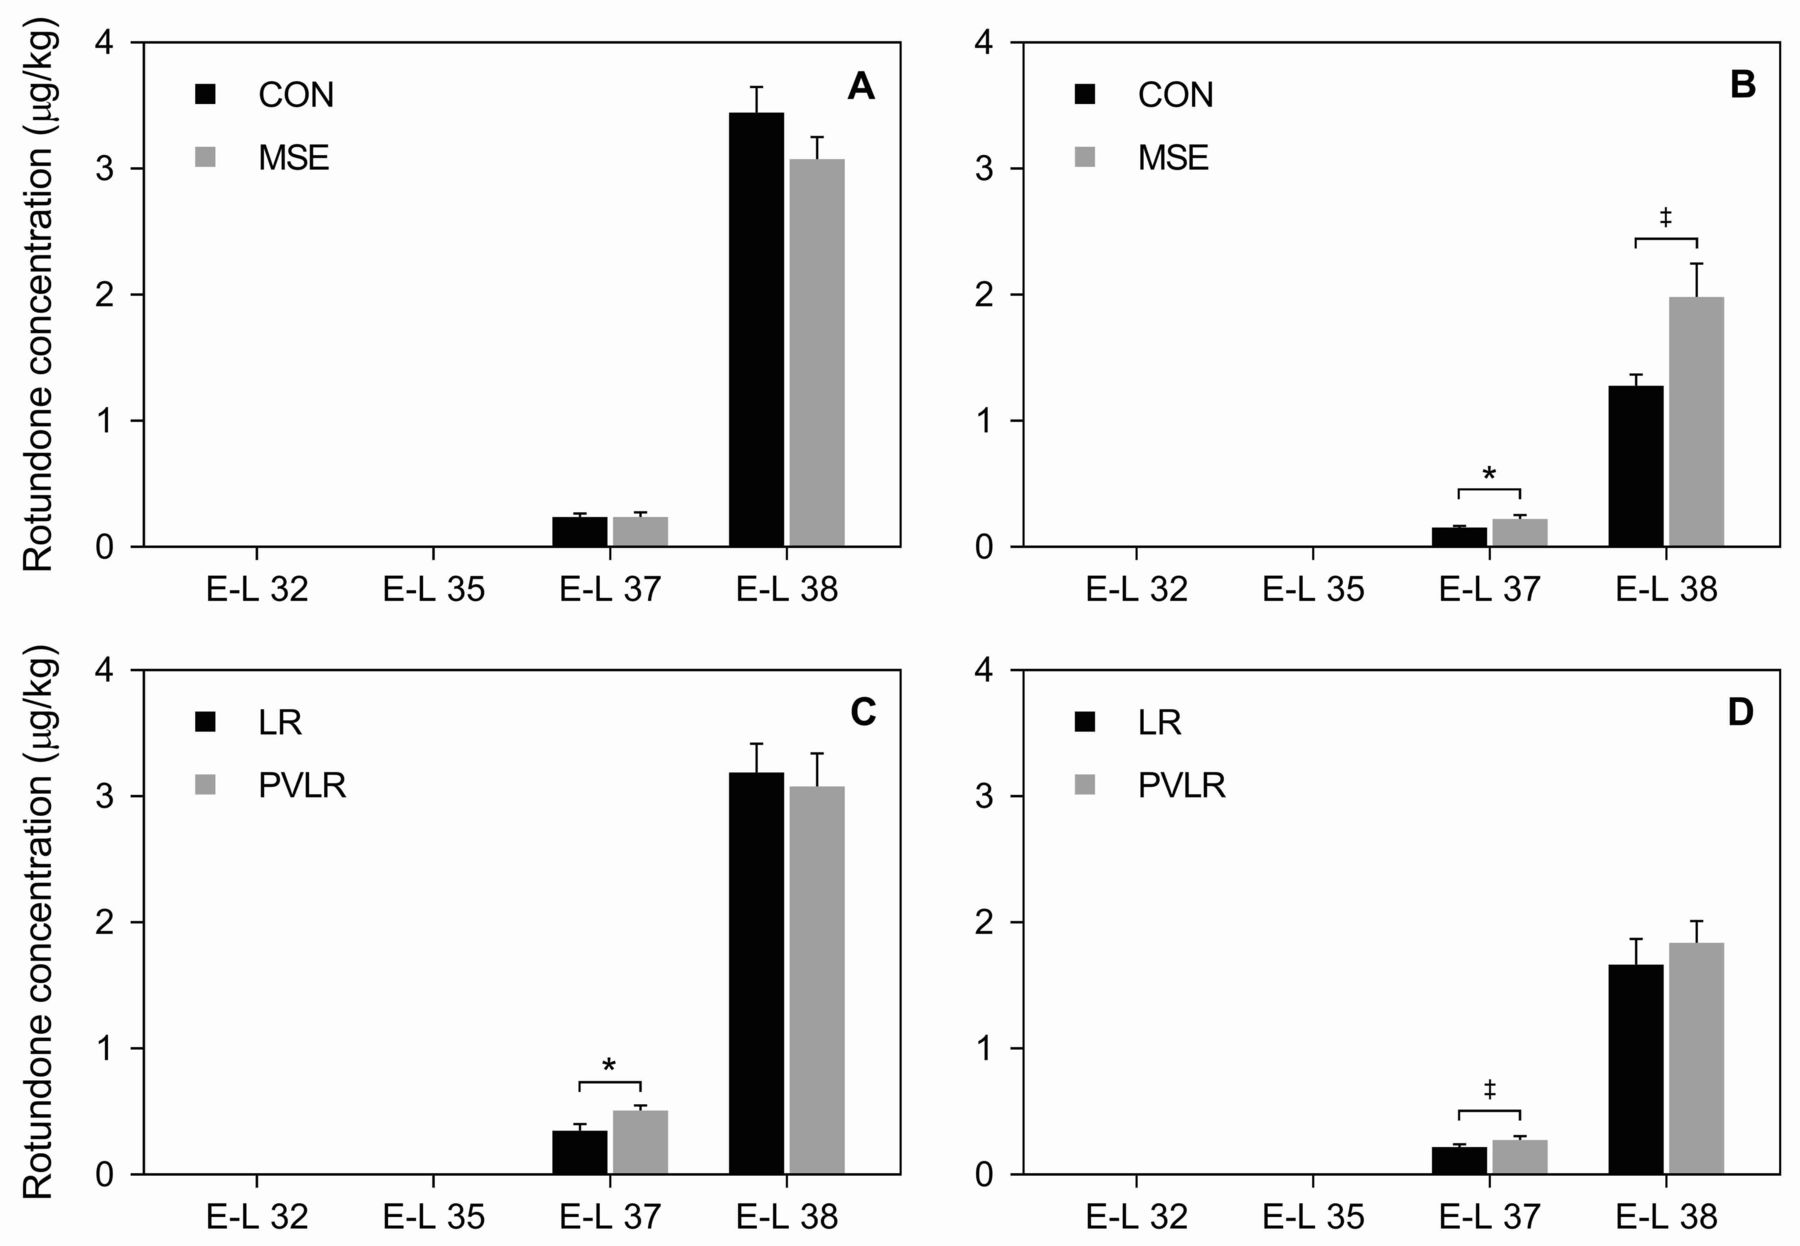
Effects of fruit-zone sunlight exposure intensity (control [CON] versus maintained fruit-zone sunlight exposure [MSE]) on berry rotundone concentration in (A) 2014 and (B) 2015. Impact of phenological timing of fruit-zone leaf removal (preveraison leaf removal [LR] versus postveraison leaf removal [PVLR]) on berry rotundone concentration in (C) 2014 and (D) 2015. Berry samples were collected at bunch closure (E-L 32), one week after 50% veraison (E-L 35), berries not quite ripe (E-L 37), and harvest (E-L 38). Data are mean values ± SE (n = 5). Double dagger (‡) indicates a significant difference at p < 0.10; single asterisk (*) indicates a significant difference at p < 0.05.
At harvest, rotundone concentrations ranged between 1.28 μg/kg (CON 2015) and 3.45 μg/kg (CON 2014), and were significantly (p < 0.001) higher in 2014 than in 2015 for both treatment comparisons. In 2014, there were no differences in rotundone concentrations between CON and MSE berry samples collected at growth stage E-L 37 (p = 0.999) and at harvest (p = 0.236) (Figure 4A). In 2015, rotundone concentrations were significantly higher in the MSE treatment than in the CON fruit at growth stage E-L 37 (MSE = 0.23 μg/kg; CON = 0.16 μg/kg; p = 0.014), and again at harvest (MSE = 1.98 μg/kg; CON = 1.28 μg/kg; p = 0.066) (Figure 4B).
The timing of leaf removal (LR versus PVLR) did not significantly affect rotundone concentrations at harvest in 2014 (p = 0.442) or 2015 (p = 0.459) (Figure 4C and 4D). The PVLR treatment had, however, significantly (p = 0.038) higher rotundone concentration (0.51 μg/kg) than the LR treatment (0.35 μg/kg) in fruit collected at growth stage E-L 37 in 2014. Again, in 2015, rotundone concentration for PVLR fruit (0.27 μg/kg) was significantly higher (p = 0.061) than for the LR fruit (0.22 μg/kg) at growth stage E-L 37.
Rotundone concentration and black pepper aroma intensity in wines
In both 2014 and 2015, rotundone concentration in wine was not affected by the timing of leaf removal (LR versus PVLR). In 2015, rotundone concentration was 43% lower in the CON compared to the MSE wine sampled at the completion of MLF (p = 0.006) (Table 4). Black pepper aroma intensity was positively related to rotundone concentration in bottled wines diluted with deionized water (2:1 v/v) (p = 0.023, r = 0.791) (Figure 5).

Relationship of mean black pepper aroma intensity ratings (n = 61) to rotundone concentration for 2014 and 2015 Noiret bottled wines diluted with deionized water (2:1 v/v). Regression equation: y = 0.090x + 32.07, p = 0.023.
Discussion
In this study, leaf removal was implemented to modify fruit-zone sunlight exposure, and potentially cluster temperature, to assess how differences in fruit-zone microclimate would affect rotundone accumulation in grapes and concentration in finished wines. The treatments were imposed on vigorous Noiret vines with highly shaded clusters. Although the optimum crop load range for Noiret has not been identified, crop loads between eight and 12 were suggested for another highly vegetative hybrid cultivar (Traminette) (Bordelon et al. 2008). Crop load values for Noiret vines ranged from 4.5 to 5.5 in 2014 and from 5.7 to 6.6 in 2015, indicating that the vines were highly vegetative and likely undercropped in both years. Crop loads in a mature Noiret vineyard in the same region (Finger Lakes AVA, Seneca Lake) were similar to those in our study, ranging from ~4.5 to 7.5 in 2015 and from 6.4 to 7.4 in 2016 (Vanden Heuvel, unpublished data, 2017). The impact of leaf removal treatments on yield components was inconsistent across years, suggesting that leaf removal mainly affected fruit-zone microclimate without significant impact on production and vine size parameters.
In 2014, the leaf removal treatments did not affect preveraison canopy density, despite that leaves were previously removed from the LR and MSE vines. This may be explained by inconsistencies in pulling a similar amount of leaves among replications of the same treatment; standard error values of the EPQA parameters were higher for the first sampling date than for the following dates. In the preveraison stage, the vines are also in their highly vegetative growth stage; vegetative regrowth likely occurred during the 21 days between leaf pulling and EPQA data collection, resulting in no significant differences between treatments. In addition, a hailstorm on 31 July 2014 caused severe damage to exposed fruit and leaves, which may have contributed to the lack of differences in canopy characteristics on the first EPQA data collection date. The storm damage can also explain why there was no visible vegetative regrowth in the LR vines, and therefore, no differences in EPQA parameters between the timing of leaf removal treatments throughout the season, especially shortly (eight days) after PVLR was implemented.
In 2015, removing leaves early in the season (LR) only temporarily decreased canopy density (LLN, OLN) and increased light availability to the clusters and leaves (CEFA, LEFA), whereas pulling leaves shortly after veraison (PVLR) resulted in increased fruit-zone sunlight exposure during fruit ripening. These in-season variations of light available to the fruit are likely the result of the vegetative growth of lateral shoots in the fruit-zone of LR vines.
Despite the impact of leaf pulling on the postveraison fruit-zone microclimate in MSE vines, there were no differences in rotundone concentrations between MSE and CON fruit in 2014. In the second year of the study, MSE vines had higher rotundone concentrations than the CON for berries sampled at growth stage E-L 37 and at harvest. Previous work indicated that leaf removal at veraison decreased rotundone concentration in Duras wines compared to an undefoliated control (Geffroy et al. 2014). However, greater extent of natural shading (i.e., less sunlight exposure and lower berry temperature) from veraison to harvest did not affect rotundone concentrations in Shiraz grapes (Zhang et al. 2015a). Those studies were conducted in climates with longer growing seasons than the northeastern United States, and treatments were imposed later in the season (e.g., veraison). In addition, the other studies used V. vinifera varieties, whereas we used an interspecific Vitis hybrid cultivar, making comparisons between this study and previous reports difficult.
Cooler temperatures, especially between veraison and harvest, are associated with greater rotundone accumulation in fruit (Geffroy et al. 2014, Zhang et al. 2015a). Similarly, in our study, rotundone concentrations in 2015 (the season characterized by warmer temperatures and more cumulative GDDs) were 63% (CON), 48% (LR), 40% (PVLR), and 36% (MSE) lower than those of the same treatments imposed in 2014. DH25 was found to be the most significant weather parameter influencing variations in rotundone concentration between vintages (Zhang et al. 2015a). DH25 was negatively correlated with rotundone concentrations at harvest, as greater DH25 resulted in lower rotundone concentration. In our study, DH25 from veraison to harvest was indeed lower in 2014 than in 2015 (3.6% versus 8.5%).
Our findings for the effect of fruit sunlight exposure on rotundone concentration contrast with reports of a negative effect of temperature on rotundone accumulation. Although berry temperature was not monitored in our study, it is possible that the increased sunlight exposure reaching the fruit-zone because of leaf removal would increase berry surface temperatures in comparison to shaded clusters (Geffroy et al. 2014). The effects of leaf removal and microclimate conditions on rotundone accumulation are still uncertain (Geffroy et al. 2014, Zhang et al. 2015a) and might depend on the phenological stage at which fruit sun exposure or temperature conditions change. There are several potential explanations for why maintaining increased fruit sunlight exposure from the preveraison stage to harvest resulted in greater rotundone accumulation in 2015. The increase in sunlight exposure, and potentially higher berry temperatures through leaf removal, may have induced more favorable microclimate conditions for the conversion of α-guaiene to rotundone. The VvSTO2 enzyme was recently identified as having the ability to biotransform α-guaiene to rotundone in grapes, and this enzymatic transformation was most favorable between 30 and 40°C (Takase et al. 2016). Therefore, the MSE treatment might have enhanced VvSTO2 enzyme activity. Beyond enzymatic conversion, aerial oxidation was also proposed as a mechanism for the conversion of α-guaiene to rotundone (Huang et al. 2014). The increased sun exposure and air temperature induced by leaf removal may have advanced oxidation, as these reactions are favored at higher temperatures (Barter et al. 2015).
Based on the EPQA data, it is unclear whether preveraison fruit-zone sunlight exposure influences the formation of α-guaiene or rotundone in Noiret. In 2014, parameters associated with canopy density (LLN, OLN) were not different between CON and MSE prior to veraison, but differences were achieved postveraison. Conversely, in 2015, MSE vines had significantly decreased canopy density (LLN, OLN) and increased light availability (CEFA, LEFA) compared to the CON during both pre- and postveraison stages. Therefore, the influence of preveraison fruit light exposure on rotundone formation warrants further investigation.
The multiple episodes of leaf removal during the season may also have elicited a stress response as a signaling mechanism against herbivore attack (Martin et al. 2003, Logan 2015). Such a response could increase sesquiterpene production, as reported for other plant species (Martin et al. 2003). In both years, the removal of leaves after veraison (PVLR) increased rotundone concentrations at growth stage E-L 37 compared to preveraison leaf removal (LR), although differences in canopy density or light availability only occurred in 2015. Moreover, differences in rotundone concentrations between LR and PVLR were not maintained at harvest. These results suggest that development of rotundone, or its precursor α-guaiene, may be a stress response induced by defoliation (Martin et al. 2003, Logan 2015).
Although it was not possible to quantify rotundone in berry samples taken before and at 100% veraison due to the method limitations reported previously, Noiret berries collected 22 (2014) and 29 (2015) days after veraison had less than 17% of the rotundone concentration measured at harvest. This suggests that while rotundone was present, the majority of the formation occurred between E-L 37 and harvest. Similarly, previous studies found that rotundone concentration in Shiraz remained low until three to four weeks after veraison (Herderich et al. 2012, Logan 2015).
Differences in rotundone concentration between wines produced from the vineyard treatments matched those found for the fruit at harvest, confirming that the amount of rotundone in fruit at harvest is a good predictor of rotundone concentration in finished wines (Zhang et al. 2015b). Previous work found that perceived black pepper aroma intensity is well correlated with rotundone concentration in wine (Wood et al. 2008, Geffroy et al. 2016). This work supports those results, as there was a significant linear relationship between the mean black pepper aroma intensity rating and rotundone concentration in diluted Noiret wines. However, it is also true that for the lowest rotundone concentrations (98.1 to 165.3 ng/L), there was no clear impact on black pepper intensity rating. We also recognize that the black pepper aroma in undiluted Noiret wines made from the different viticulture treatments may be too strong for different intensity levels to be distinguished. Regardless of this potential limitation, this study demonstrates impacts of vineyard management practices on rotundone concentration in berries and wine.
Conclusions
This was the first study to identify rotundone in Noiret, a complex interspecific hybrid of Vitis with a pedigree devoid of known rotundone-containing cultivars. In a cool-climate region, Noiret grapes exposed to increased fruit-zone sunlight exposure from preveraison (berry pea-size stage) to harvest (2015) accumulated more rotundone than did highly shaded grapes. Greater rotundone concentrations in treatments with multiple instances of leaf removal may be a result of prolonged stress from defoliation, and rotundone formation through enzymatic or nonenzymatic oxidation might have been enhanced by increased sunlight exposure. Rotundone accumulation in the grapes varied between vintages; it was significantly higher in the season with cooler temperatures and less cumulative GDDs (2014). Black pepper wine aroma intensity rating was positively correlated with rotundone concentrations in the wines diluted with deionized water (2:1 v/v).
Acknowledgments
Financial support for this study was provided by the Pennsylvania Wine Marketing and Research Board Program. The authors would like to thank Steven Lerch and Don Smith for their technical support with field measurements, Denise Gardner for her winemaking guidance, and Richard Marini, Alyssa Bakke, and Dan Sykes for providing assistance with data analyses. The authors also thank members of the Australian Wine Research Institute, especially Tracey Siebert and Sheridan Barter, for generously donating rotundone standards, performing wine rotundone analysis, and fielding many technical questions. Alina Stelick from the Sensory Evaluation Center at Cornell University is also acknowledged for her help with the wine sensory analysis.
- Received November 2016.
- Revision received April 2017.
- Revision received June 2017.
- Accepted June 2017.
- Published online September 2017
- ©2017 by the American Society for Enology and Viticulture
Literature Cited
Vol 68 Issue 4


Jump to section
Related Articles
Cited By...
More from this TOC section
Similar Articles
